Abstract
Background
Investigators use phase-contrast magnetic resonance (PC-MR) and computational fluid dynamics (CFD) to assess cerebrospinal fluid dynamics. We compared qualitative and quantitative results from the two methods.
Methods
Four volunteers were imaged with a heavily T2-weighted volume gradient echo scan of the brain and cervical spine at 3T and with PC-MR. Velocities were calculated from PC-MR for each phase in the cardiac cycle. Mean pressure gradients in the PC-MR acquisition through the cardiac cycle were calculated with the Navier-Stokes equations. Volumetric MR images of the brain and upper spine were segmented and converted to meshes. Models of the subarachnoid space were created from volume images with the Vascular Modeling Toolkit. CFD simulations were performed with a previously verified flow solver. The flow patterns, velocities and pressures were compared in PC-MR and CFD flow images.
Results
PC-MR images consistently revealed more inhomogeneous flow patterns than CFD, especially in the anterolateral subarachnoid space where spinal nerve roots are located. On average, peak systolic and diastolic velocities in PC-MR exceeded those in CFD by 31% and 41%, respectively. On average, systolic and diastolic pressure gradients calculated from PC-MR exceeded those of CFD by 11% and 39%, respectively.
Conclusions
PC-MR shows local flow disturbances that are not evident in typical CFD. The velocities and pressure gradients calculated from PC-MR are systematically larger than those calculated from CFD.
Keywords: CSF flow imaging, phase-contrast MR, computational fluid dynamics
Introduction
Abnormal cerebrospinal fluid (CSF) dynamics in theory have a pathogenic role in idiopathic syringomyelia, Chiari I, presyrinx, and possibly other neurologic disorders.1–4 The causes and consequences of abnormal CSF dynamics have not been fully described. To study CSF dynamics in patients, phase-contrast magnetic resonance (PC-MR) can be used to display velocity and to calculate pressure gradients along the spinal canal.5 Computational fluid dynamics (CFD), which has extensive applications in engineering, medicine, and physiology, provides another method to compute fluid velocities and pressures in vivo.6,7
Recent CFD studies have shown discrepancies between velocities measured by PC-MR and those calculated from CFD.8 Peak velocities calculated from PC-MR tend to exceed the peak velocities in CFD simulations. The reasons for the discrepancies are not known. These published comparisons have predominantly focused on individual pixel velocities and not on integrated flow metrics such as average velocity profiles, volume flow, and craniocervical pressure gradients.
One cause for discrepancies between PC-MR and CFD may be the hydrodynamic effects of structures in the subarachnoid space such as nerve roots and denticulate ligaments.8,9 Although not well resolved in MR anatomic images, these structures influence the flow patterns that are evident in PC-MR flow images. These structures are not typically included in the models used for CFD studies because of the resolution in images used when constructing the model. Their effects on flow in CFD are therefore typically disregarded in patient-specific CFD studies. To what extent focal disturbances in CSF flow affect volume flow and average flow and craniocervical pressure gradients has not been adequately addressed.
The goal of this study was to compare the patterns of flow from PC-MR images and CFD in multiple individuals, to estimate the magnitude of differences in flow parameters calculated from the two methods, and to determine if systematic or random errors explain the different results with CFD and PC-MR. The study was intended to inform clinical practitioners whether results from PC-MR and CFD might be compared.
Methods
The institutional review board at the University of Oslo approved the acquisition of MR and PC-MR images in volunteers and approved the use of the anonymized data for the purpose of simulating flow with CFD and measuring flow in the subarachnoid space with PC-MR.
Participants were selected from staff and student volunteers at the institution. They were imaged in a 3T Philips Ingenia system (Philips, Best, The Netherlands) with a 32-channel head coil. Magnetic resonance imaging (MRI) acquisitions included a volumetric heavily T2-weighted gradient echo scan covering the brain and cervical spine with 2500/330 ms repetition time (TR)/echo time (TE), 90-degree flip angle, and 0.49 × 0.49 mm2 pixel size. PC-MR images were obtained in the axial plane at the mid-C1 or C2 levels with 16/11 ms TR/TE, 0.56 × 0.56 mm2 pixel size, 7 mm slice thickness, 6 cm/s encoding velocity, and 32–40 phases with retrospective cardiac gating. PC-MR was obtained four times in each individual over a time period of approximately two hours.
A neuroradiologist (GR) with 11 years’ experience reviewed the volumetric T2-weighted and PC-MR images to evaluate the image quality. The PC-MR flow studies were transferred to a console with NordicICE® (NordicNeuroLab AS, Bergen, Norway). The reviewer defined a region of interest (ROI) on axial PC-MR phase images to include the entirety of the region with systolic flow signal in the subarachnoid space.
MR data were transferred to MatLab (MathWorks, Natick, MA) for further analysis. Velocities were calculated for each pixel in each cardiac phase in each of the four PC-MR acquisitions in each volunteer. Pixels with aliasing artifacts were identified and the velocities corrected, as in previous studies.10 The area of the ROI in each volunteer was measured with resident software. The average velocity for each phase in the cardiac cycle was calculated by averaging the velocities in all pixels for each phase. From the four acquisitions in each volunteer, the average and standard deviation of the velocities were calculated. The largest flow velocities in the positive and negative flow directions were identified as the peak systolic and peak diastolic flow rates, respectively.
With the Navier–Stokes equations, we calculated mean pressure gradients in the PC-MR acquisition through the cardiac cycle from the change in velocity between phases.11 The maximal positive and negative pressure gradients were tabulated.
The volumetric MRI images of the brain and upper spine were segmented and converted to meshes with the Vascular Modelling Tool Kit as in previous studies.6 A mesh with 650,000 vertices was chosen. It was smoothed with Taubin’s non-shrinking algorithm (60 iterations, pass band of 0.095) until the surfaces were judged sufficiently smooth and undiminished in volume.
CFD simulations were performed in the models with a previously verified flow solver that uses an incremental pressure correction scheme.11 For simulations, the bulk flow of CSF per unit time in each of the four PC-MR studies was specified as a boundary condition at the cranial end of each model. The time step for simulations was 0.001 seconds.
An investigator compared the PC-MR images through the cardiac cycle at C1 or C2 with the time-resolved flow images in a cross-section from the CFD at the same level, using Paraview. The investigator evaluated the patterns and variability in velocities across the PC-MR and CFD images by inspection.
The systolic and diastolic volume flow rates in the CFD were computed in Paraview and compared with those from PC-MR. The systolic and diastolic pressure gradients calculated from the PC-MR were compared with those from the CFD. Maximal volume flow rates and pressure gradients for the two methods were compared.
The correlation of velocities and pressure gradients for the two methods were analyzed with least squares regression. The coefficient of determination (R2) was calculated to estimate the proportion of the pressure value that is predictable from the velocity in the linear regression model. Goodness of fit was calculated with chi square as a measure of the discrepancy between the measured values and the values predicted by the linear model.
Reynolds numbers were computed on cross-sections using the hydraulic diameter and the 90th percentile velocities. The sensitivity of the CFD techniques was tested by running additional simulations at 1,300,000 vertices and time step of 0.0001 seconds.
Results
The four volunteers included one woman and three men, ages 23 to 41. The neuroradiologist interpreted the images in each volunteer as normal and judged image quality good in all sequences and deemed artifacts minimal.
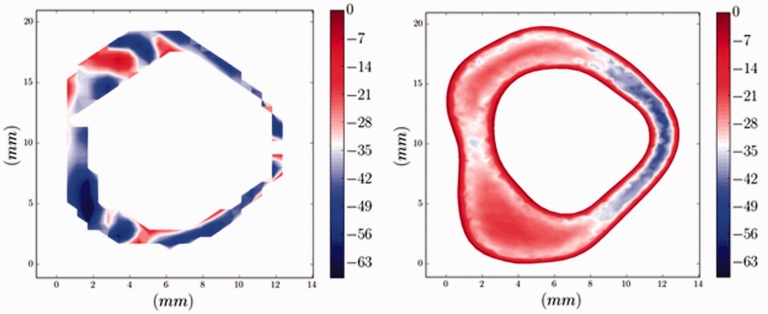
Axial PC-MR images showed patterns of CSF flow different from the axial CFD images at the same levels (Figure 1). In the anterolateral subarachnoid space where the nerve roots are located, PC-MR showed more inhomogeneous flow patterns than did CFD. Posterior to the spinal cord, PC-MR showed localized variation in velocities; CFD showed less. CFD showed the boundary layer (zero flow) at the periphery of the subarachnoid space better than PC-MR did.
Figure 1.
Axial PC-MR image (left) and CFD image (right) during peak systolic flow in one volunteer. In both images, the anterior subarachnoid space is oriented to the reader’s left. The PC-MR image has a more pixelated appearance because of the finite pixel size and lack of smoothing. This MR image shows no zero-flow layer at the perimeter of the ROI. The CFD image shows a zero-flow layer adjacent to the dural sac and spinal cord. PC-MR shows inhomogeneity in the velocities anterolateral to the spinal cord, where nerve roots are located, and variations in velocity from 0.7 to 6.3 cm/s. CFD shows a more homogenous flow pattern with velocities in the range of 2.1 to 2.5 cm/s in the same anterolateral location. Posterior to the spinal cord, PC-MR shows some localized variation in velocities while CFD does not. PC: phase-contrast; MR: magnetic resonance; CFD: computational fluid dynamics; ROI: region of interest.
The cross-sectional area calculated for the subarachnoid space in CFD exceeded the area measured in the ROI in PC-MR. In CFD, the cross-sectional area varied from 1.3 to 2.2 cm2 and in the ROI in PC-MR it varied between 0.8 and 1.7 cm2.
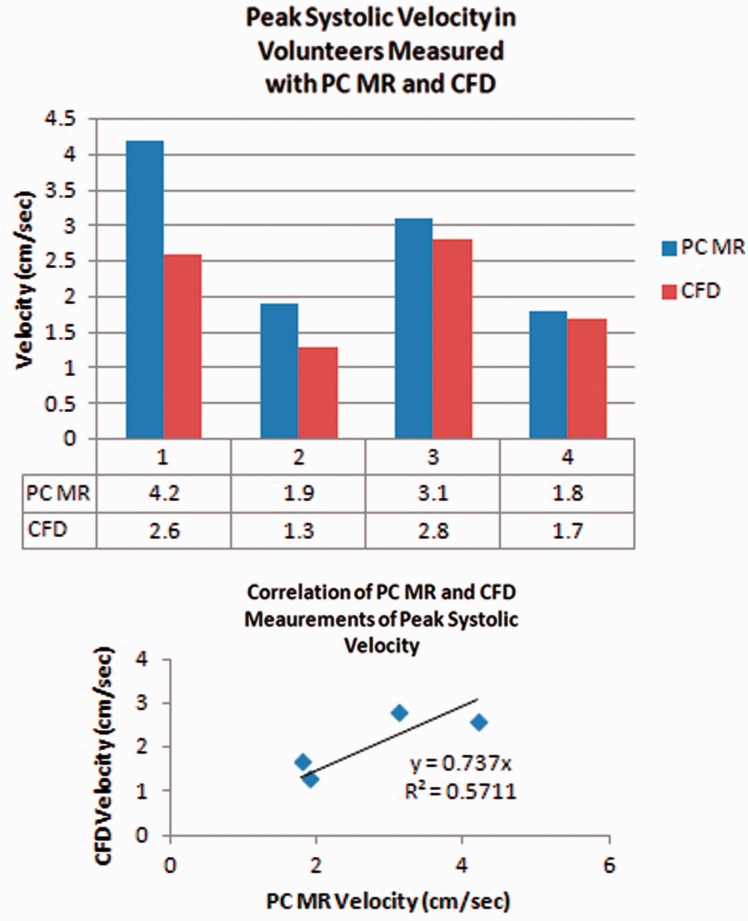
Peak systolic velocities averaged 31% greater with PC-MR than with CFD. With PC-MR the average peak systolic velocity was 2.8 cm/s (range 1.8 to 4.2 cm/s) and with CFD was 2.1 cm/s (range 1.3 to 2.6) (Figure 2). Regression analysis showed a roughly linear correlation of the CFD and PC-MR velocity values. The coefficient of determination was 0.7 and the goodness of fit 0.6.
Figure 2.
(a) and (b) Bar graph (upper) shows the average peak systolic velocities for each volunteer measured from PC-MR and from CFD. Velocities are consistently greater with PC-MR than with CFD. Scatter plot (lower) shows the correlation of velocity measurements with CFD and PC-MR in participants. The correlation appears roughly linear. The coefficient of determination is 0.7 and the goodness of fit is 0.6. PC: phase-contrast; MR: magnetic resonance; CFD: computational fluid dynamics.
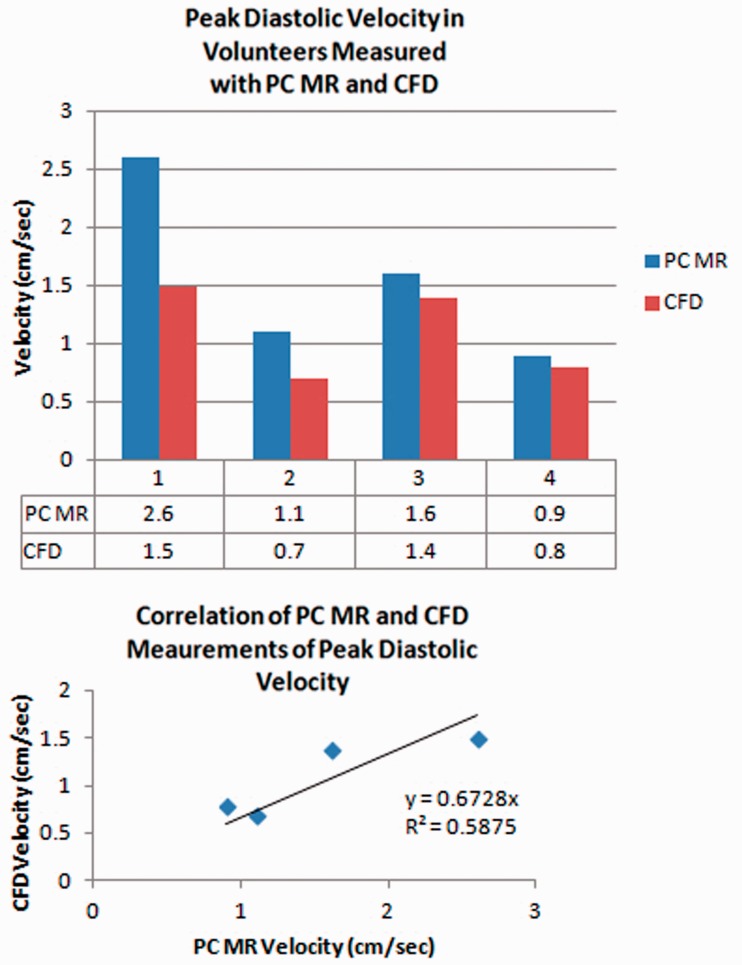
Peak diastolic pressure gradient averaged 41% more with PC-MR than with CFD. Peak diastolic velocities averaged 1.6 cm/s (range 0.9 to 2.6 cm/s) with PC-MR and 1.1 cm/s (0.7 to 1.5 cm/s) with CFD (Figure 3). Regression analysis showed a roughly linear correlation between PC-MR and CFD with a 0.7 coefficient of determination and 0.6 goodness of fit.
Figure 3.
(a) and (b) Bar graph (upper) for peak diastolic velocities measured with PC-MR and CFD. PC-MR velocities are consistently greater than PC-MR for each volunteer. Scatter plot (lower) shows the correlation of velocity measurements with CFD and PC-MR in the participants. The coefficient of determination is 0.7 and the goodness of fit is 0.6. PC: phase-contrast; MR: magnetic resonance; CFD: computational fluid dynamics.
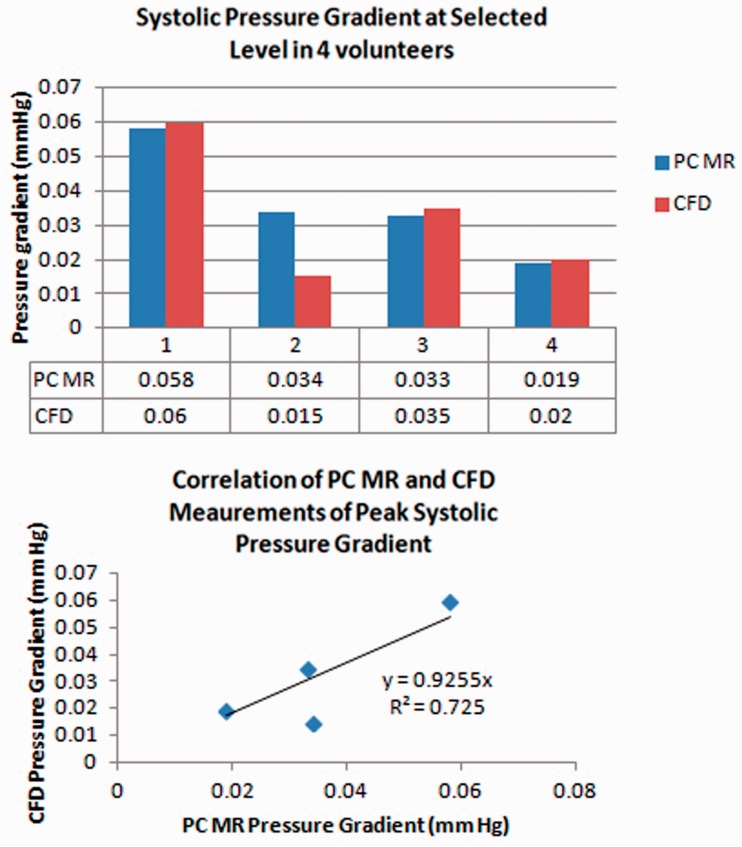
Peak systolic pressure gradients averaged 11% greater with PC-MR than with CFD. With PC-MR the average peak systolic pressure gradient was 0.04 m Hg (range 0.02 to 0.06 Hg) and with CFD was 0.03 mm Hg (range 0.02 to 0.06 mm Hg) (Figure 4). The correlation appeared linear and the coefficient of determination was 0.9 and goodness of fit was 0.7.
Figure 4.
(a) and (b) Bar graph (upper) for the peak pressure gradient during systole in each volunteer, calculated from PC-MR and CFD. Differences in pressure gradients are relatively small except in volunteer 2. Scatter plot (lower) shows the roughly linear correlation of pressure gradient measurements with CFD and PC-MR in participants. The coefficient of determination is 0.9 and the goodness of fit is 0.7. PC: phase-contrast; MR: magnetic resonance; CFD: computational fluid dynamics.
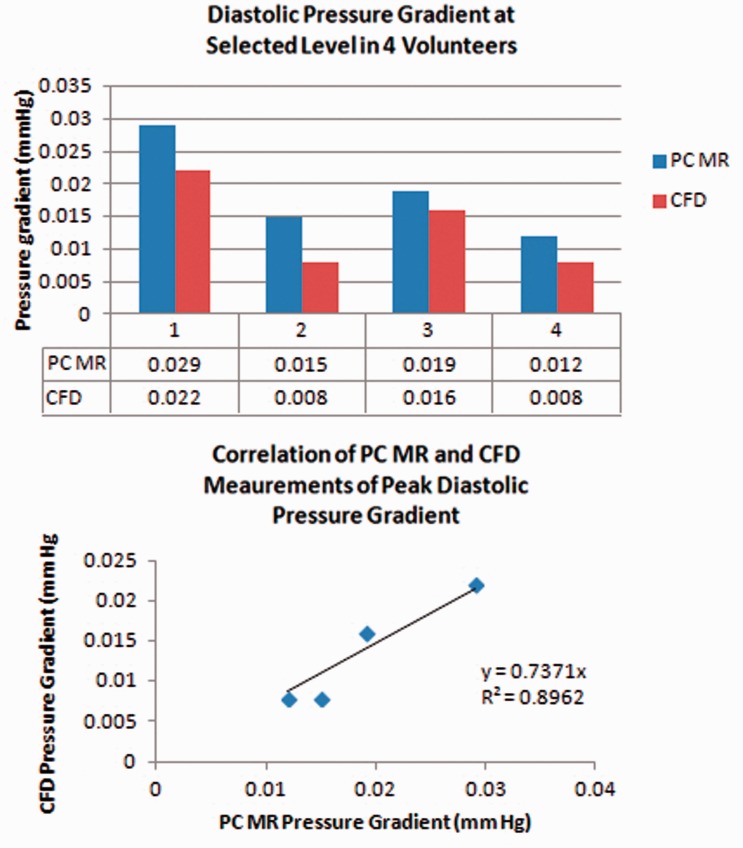
Peak diastolic pressure gradient averaged 39% more with PC-MR than with CFD, 0.02 mm Hg (range 0.01 to 0.03 mm Hg) with PC-MR and 0.01 mm Hg (range 0.01 to 0.02 mm Hg) with CFD (Figure 5). The correlation appeared linear; the coefficient of determination was 0.7 and goodness of fit was 0.9.
Figure 5.
Bar graph (upper) for the peak pressure gradients during diastole calculated from PC-MR and CFD for each volunteer. The PC-MR consistently produces greater values than CFD in each volunteer. Scatter plot (lower) shows the roughly linear correlation of pressure gradient measurements with CFD and PC-MR in participants. The coefficient of determination is 0.7 and the goodness of fit is 0.9. PC: phase-contrast; MR: magnetic resonance; CFD: computational fluid dynamics.
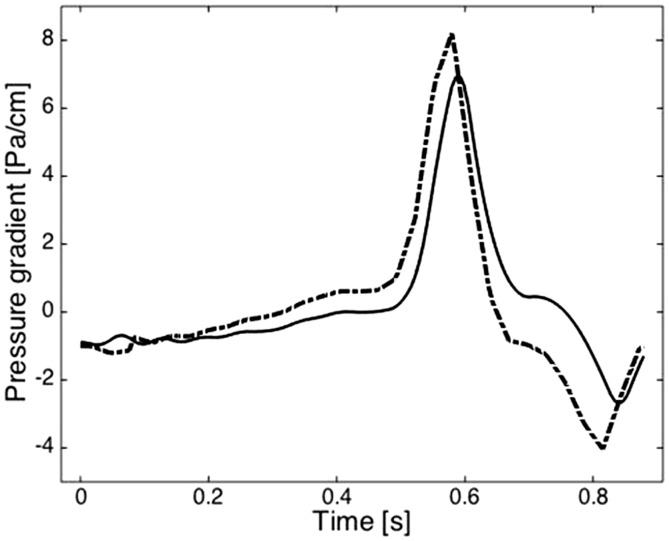
Pressure gradients calculated from PC-MR and from CFD fluctuated similarly through the cardiac cycle (Figure 6).
Figure 6.
Plot of the pressure gradients calculated with PC-MR (dotted line) and CFD (solid line) during the cardiac cycle averaged for the four volunteers. The slight difference in phase results from the use of the velocity in successive phases in PC-MR to calculate pressure for each point in the cardiac cycle versus the use of millisecond temporal resolution in CFD. PC: phase-contrast; MR: magnetic resonance; CFD: computational fluid dynamics.
The Reynolds number calculated in each volunteer did not exceed 500. The increase in matrix size to 1,300,000 vertices and the reduction of the time step to 0.0001 seconds did not change parameter values by more than 3%.
Discussion
The study demonstrates systematic qualitative and quantitative differences between PC-MR flow imaging and CFD flow simulation. PC-MR images reveal local disturbances of CSF flow in the region of the spinal nerve roots while CFD simulations do not. Velocities measured with PC-MR on average exceed those measured with CFD by 31% to 41%. Pressure gradients calculated from PC-MR on average exceed those with CFD by 11% to 39%. The PC-MR and CSF pressure and velocity measurements appear linearly related by regression analysis and the values for the one method are predictable to a fair or good degree compared with the values obtained with the other method.
The patterns of CSF flow and flow velocities in axial PC-MR and CFD images agree generally with previous reports.2,3,5,6,8,11,12 Investigators have previously reported greater velocities in PC-MR and in four-dimensional PC-MR than in simulations.8 Without an independent pressure or velocity measurement, the accuracy of PC-MR measurements and CFD computations cannot be determined. In phantom studies, PC-MR overestimates actual velocities for CSF by as much as 10% to 40%.13 CFD reportedly underestimates velocities in the subarachnoid space when the nerve roots are omitted from the model.8 The manual selection of ROI in PC-MR images, based on flow signal, explains the smaller areas in PC-MR compared to CFD. This effect tends to increase the average velocity. Flow oblique to the z axis, which represents a small percentage of flow velocities,14 was neglected in our CFD calculations. With Reynolds numbers calculated to be less than 500, the assumption of laminar flow is justified. With 3% or less change in parameter values with an increase in matrix size and in temporal resolution, selections of 650,000 vertices and 0.001 seconds time steps were justified.
In summary, PC-MR shows local flow disturbances related to nerve roots that typical CFD models do not, because nerve roots are not typically included in patient-specific computational models. PC-MR imaging shows consistently larger velocities and larger pressure gradients than CFD. The differences between methods are more systematic than random.
Funding
This research received no specific grant from any funding agency in the public, commercial, or not-for-profit sectors.
Conflict of interest
The authors declared no potential conflicts of interest with respect to the research, authorship, and/or publication of this article.
References
- 1.Quigley MF, Iskandar B, Quigley MA, et al. Cerebrospinal fluid flow in foramen magnum: Temporal and spatial patterns at MR imaging in volunteers and in patients with Chiari I malformation. Radiology 2004; 232: 229–236. [DOI] [PubMed] [Google Scholar]
- 2.Wolpert SM, Bhadelia RA, Bogdan AR, et al. Chiari I malformations: Assessment with phase-contrast velocity MR. AJNR Am J Neuroradiol 1994; 15: 1299–1308. [PMC free article] [PubMed] [Google Scholar]
- 3.Fischbein NJ, Dillon WP, Cobbs C, et al. The “presyrinx” state: A reversible myelopathic condition that may precede syringomyelia. AJNR Am J Neuroradiol 1999; 20: 7–20. [PubMed] [Google Scholar]
- 4.Struck AF, Haughton VM. Idiopathic syringomyelia: Phase-contrast MR of cerebrospinal fluid flow dynamics at level of foramen magnum. Radiology 2009; 253: 184–190. [DOI] [PubMed] [Google Scholar]
- 5.Ringstad G, Lindstrøm EK, Vatnehold SAS, et al. Non-invasive assessment of pulsatile intracranial pressure with phase-contrast magnetic resonance imaging. PLoS One 2017; 12: e0188896. [DOI] [PMC free article] [PubMed] [Google Scholar]
- 6.Rutkowska G, Haughton V, Linge S, et al. Patient-specific 3D simulation of cyclic CSF flow at the craniocervical region. AJNR Am J Neuroradiol 2012; 33: 1756–1762. [DOI] [PMC free article] [PubMed] [Google Scholar]
- 7.Sun Q, Groth A, Aach T. Comprehensive validation of computational fluid dynamics simulations of in-vivo blood flow in patient-specific cerebral aneurysms. Med Phys 2012; 39: 742–754. [DOI] [PubMed] [Google Scholar]
- 8.Heidari Pahlavian S, Bunck AC, Thyagaraj S, et al. Accuracy of 4D flow measurement of cerebrospinal fluid dynamics in the cervical spine: An in vitro verification against numerical simulation. Ann Biomed Eng 2016; 44: 3202–3214. [DOI] [PMC free article] [PubMed] [Google Scholar]
- 9.Haga PT, Pizzichelli G, Mortensen M, et al. A numerical investigation of intrathecal isobaric drug dispersion within the cervical subarachnoid space. PLoS One 2017; 12: e0173680. [DOI] [PMC free article] [PubMed] [Google Scholar]
- 10.Frič R, Lindstrøm EK, Ringstad GA, et al. The association between the pulse pressure gradient at the cranio-cervical junction derived from phase-contrast magnetic resonance imaging and invasively measured pulsatile intracranial pressure in symptomatic patients with Chiari malformation type 1. Acta Neurochir (Wien) 2016; 158: 2295–2304. [DOI] [PubMed] [Google Scholar]
- 11.Mardal KA, Rutkowska G, Linge S, et al. Estimation of CSF flow resistance in the upper cervical spine. Neuroradiol J 2013; 26: 106–110. [DOI] [PMC free article] [PubMed] [Google Scholar]
- 12.Haughton V, Korosec FR, Medow JE, et al. Peak systolic and diastolic CSF velocity in the foramen magnum in adult patients with Chiari I malformations and in normal control participants. AJNR Am J Neuroradiol 2003; 24: 169–176. [PMC free article] [PubMed] [Google Scholar]
- 13.Wentland AL, Wieben O, Korosec FR, et al. Accuracy and reproducibility of phase-contrast MR imaging measurements for CSF flow. AJNR Am J Neuroradiol 2010; 31: 1331–1336. [DOI] [PMC free article] [PubMed] [Google Scholar]
- 14.Roldan A, Wieben O, Haughton V, et al. Characterization of CSF hydrodynamics in the presence and absence of tonsillar ectopia by means of computational flow analysis. AJNR Am J Neuroradiol 2009; 30: 941–946. [DOI] [PMC free article] [PubMed] [Google Scholar]


