

Abstract
Anthropogenic perturbations including habitat loss and emerging disease are changing pollinator communities and generating novel selection pressures on plant populations. Disruption of plant–pollinator relationships is predicted to cause plant mating system evolution, although this process has not been directly observed. This study demonstrates the immediate evolutionary effects of pollinator loss within experimental populations of a predominately outcrossing wildflower. Initially equivalent populations evolved for five generations within two pollination treatments: abundant bumblebee pollinators versus no pollinators. The populations without pollinators suffered greatly reduced fitness in early generations but rebounded as they evolved an improved ability to self-fertilize. All populations diverged in floral, developmental, and life-history traits, but only a subset of characters showed clear association with pollination treatment. Pronounced treatment effects were noted for anther–stigma separation and autogamous seed set. Dramatic allele frequency changes at two chromosomal polymorphisms occurred in the no pollinator populations, explaining a large fraction of divergence in pollen viability. The pattern of phenotypic and genetic changes in this experiment favors a sequential model for the evolution of the multitrait “selfing syndrome” observed throughout angiosperms.
Keywords: Climate change, evolutionary rescue, experimental evolution, mating systems, pollinators
Approximately 180,000 flowering plant species rely on pollinators, including at least 100 agricultural species (Committee on the Status of Pollinators in North America 2007). A variety of human disturbances, including climate change, habitat fragmentation, and the introduction of invasive species are disrupting plant–pollinator relationships (Memmott et al. 2007; Hegland et al. 2009). One consequence is that plants receive less outcross pollen in human-disturbed habitats than in undisturbed areas (Eckert et al. 2010). Although the ecological effects of pollinator limitation are starting to receive proper attention, the evolutionary consequences of pollinator declines remain understudied.
The reproductive assurance hypothesis posits that pollinator limitation will cause plant populations to evolve increased rates of self-fertilization (Baker 1967; Kalisz et al. 2004). Indeed, the transition from cross-pollination to self-pollination has occurred many times in the history of angiosperms and is associated with changes in floral biology, life history, and ecology (Grant 1949; Ornduff 1969). Highly selfing plant taxa routinely have reduced flowers, less vegetative mass, reduced anther–stigma separation (herkogamy), and develop more rapidly than closely related outcrossing taxa. This constellation of features is commonly called the “selfing syndrome” (Ornduff 1969). It remains unclear if the traits of the selfing syndrome evolve simultaneously or in a piecemeal fashion during the transition from outcrossing to selfing. Some features of the syndrome may evolve subsequent to mating system change. For example, smaller flowers may evolve within selfing populations, not because reduced corolla area is necessary for self-fertilization, but simply because the investment in corolla tissue is unnecessary after a population has become predominantly selfing.
The Mimulus guttatus species complex exhibits the syndrome in a number of highly selfing lineages thought to be recently derived from outcrossing ancestors. Mimulus guttatus (2n = 28; Phrymaceae), the most common member of the complex, is a self-compatible, hermaphroditic plant with extensive variation in morphology and life history (Wu et al. 2008). It exhibits multiple adaptations for pollination by bees, including a wide, showy corolla with a landing platform and a touch-sensitive stigma. Previous studies of M. guttatus have demonstrated heritable variation for a variety of mating system related traits including rate of development, corolla width and length, style width and length, anther length, ovary size, ovary and pollen number, amount of red pigmentation on the corolla, and autogamous seed set (Carr and Fenster 1994; Robertson et al. 1994; Kelly and Arathi 2003; van Kleunen and Ritland 2004; Scoville et al. 2009).
Numerous evolutionary lineages derived from M. guttatus (or a guttatus-like ancestor) are highly selfing: M. nasutus, M. laciniatus, M. pardalis, M. longulus, M. clementinus, M. micranthus, M. platycalyx, and M. cupriphilus (Grant 1924; Vickery 1978; Macnair et al. 1989; Ritland and Ritland 1989; Sweigart and Willis 2003). Mimulus nasutus (2n = 28) is perhaps the most widespread of the selfing taxa and differs dramatically from M. guttatus in floral morphology and other mating system characters (Fig. 1A). Mimulus nasutus corollas are greatly reduced relative to M. guttatus, often cleistogamous. Mimulus nasutus also exhibits reduced anther–stigma separation and produces less pollen per flower, but has larger leaves than M. guttatus. As expected, autogamous seed set is more than 10-fold greater in M. nasutus than M. guttatus (Fishman et al. 2002). Reduced flower size and reduced anther–stigma separation are common traits to the various selfing species in the complex including M. platycalyx (Ritland and Ritland 1989; Dole 1992), M. micranthus (Carr and Fenster 1994; Carr and Dudash 1996), and M. cupriphilus (Macnair 1989; Macnair and Cumbes 1989).
Figure 1.
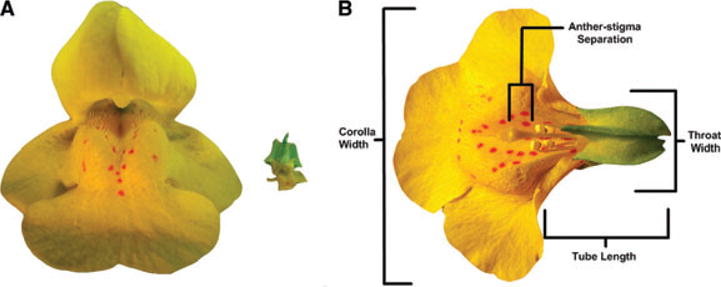
(A) Trait differences between outcrossing and selfing Mimulus congeners—anterior perspective of flowers from M. guttatus (left) and M. nasutus (right). (B) Diagram of floral measurements. Mimulus guttatus flower, dorsal view, with upper corolla removed to show reproductive structures. Floral measures reported in study depicted with brackets.
Although taxonomic data provide clear expectations regarding the traits that are likely to evolve with increased selfing, the expected pace of change is difficult to predict. How often do outcrossing populations harbor sufficient genetic variation in autogamy, the ability to set seed by selfing, to allow a rapid evolutionary response to environmental change? The rate that increased autogamy evolves is critical because pollinator decline will likely cause negative population growth and could ultimately lead to extinction. The likelihood of “evolutionary rescue”—wherein adaptation prevents extinction (Lynch and Lande 1993; Gomulkiewicz and Holt 1995)—depends on the nature of genetic variation in traits that are essential to survival and reproduction under the novel environmental condition.
Gomulkiewicz et al. (2010) recently analyzed a number of genetic models and conclude that genes with large phenotypic effects can facilitate rescue. Studies of M. guttatus have demonstrated a contribution of major chromosomal polymorphisms to variation in pollination-related traits. The “Meiotic Drive” Locus on linkage group 11 (alternative alleles D/d) exhibits segregation distortion through female meiosis (Fishman and Saunders 2008), but also has phenotypic effects on pollen viability, floral development rate, and anther–stigma separation (Scoville et al. 2009). The drive-allele (D) is maintained at 30–40% in the Iron Mountain population (Fishman and Saunders 2008), which is the source of plants used in the present experiment. The “LG6 Inversion” is a polymorphic inversion (C/c) with phenotypic effects on pollen and development traits (Lee 2009; Scoville et al. 2009). Floral traits are also affected by the inversion, but the estimated effects are heterogeneous among different mapping crosses (Scoville et al. 2009).
Here, we describe an experimental evolution study documenting immediate evolutionary changes following pollinator loss. We measure changes in the means and genetic variances of a series of quantitative traits and in allele frequencies at the two major chromosomal polymorphisms. These data are used to address the following questions: (1) What are the fitness consequences of pollinator loss? (2) Can a population of short-lived plants evolve rapidly in response to pollinator loss? (3) If so, what traits evolve? (4) Are major polymorphisms critical to mating system evolution? (5) Do genetic variances change on the same time scale as trait means with a shift in mating system?
Materials and Methods
THE POLLINATORS
Bumblebees (genus Bombus, family Apidae) may be the most important native pollinators for North American Mimulus species. Bombus fervidus, B. griseocollis, and B. impatiens are frequent visitors of M. ringens (Mitchell et al. 2004), as is B. vosnesenski of M. lewisii (Schemske and Bradshaw 1999). Mimulus guttatus, the plant investigated here, is visited by many other Bombus species over its natural range. Recorded visits to Californian populations by Bombus include B. balteatus, B. biarius, B. californicus, B. centralis, B. occidentalis, B. flavifrons, and B. vosnesenskii (Thorp et al. 1983; Macnair et al. 1989; USDA-ARS 2006). Populations at Iron Mountain, Oregon, the source of plants in this experiment, receive visits by B. edwardsii, B. mixtus, and B. melanopygus (Arathi and Kelly 2004; B. edwardsii was recently recognized as a subspecies of B. melanopygus, occurring sympatrically in this region [Owen et al. 2010]). However, M. guttatus is not exclusively pollinated by Bombus. In Yosemite National Park (U.S.A.), M. guttatus is visited by mining bees (Andrenidae), sweat bees (Halictidae), and mason bees and allies (Megachilidae, USDA-ARS 2006). Frequent visitation by Osmia bucephala (Megachilidae) has been documented in the Oregon population at Dexter reservoir (Kelly and Willis 2002), and the introduced European honey bee, Apis mellifera, is now a frequent visitor to lower elevation populations of M. guttatus (Macnair et al. 1989; Martin 2004; Ivey and Carr 2005). Admittedly, studies documenting field visitation of flowers do not prove effective transfer of outcross pollen. However, the diversity of visitors to M. guttatus, as well as the morphology of the flowers (Fig. 1), strongly suggests that M. guttatus is not specifically adapted to any single pollinating species.
We used B. impatiens as the experimental pollinator in our treatments. In part, this is a practical choice because colonies of B. impatiens are commercially available. Bombus impatiens occurs across eastern North America and thus does not pollinate Oregon populations of M. guttatus. However, it is closely related to western Bombus species (Cameron et al. 2007) and is intermediate in size to the documented visitors at Iron Mountain. B. impatiens worker bees are 8.5–16 mm long, smaller on average than B. melanopygus but larger than B. mixtus (Franklin 1912). More importantly, both greenhouse and field studies have demonstrated that Bombus species are very effective pollinators of M. guttatus, regardless of whether a particular bumblebee species is from the location from which the plants are sampled (see Robertson et al. 1999; Arathi and Kelly 2004).
THE PLANTS
As a starting point for experimental evolution, we synthesized a large outbred source population of genotypes derived from a single natural population. The source was created by randomly intercrossing plants from three distinct F2 populations. Each F2 was derived from crossing a large flowered genotype to a small flowered genotype. These parentals were sampled from the high and low selected populations of an artificial selection experiment on corolla width (Kelly 2008; Lee 2009). Source genotypes are all derived from a single natural population located on Iron Mountain in Oregon (Willis 1993; Arathi and Kelly 2004). Although the selfing rate is highly variable among M. guttatus populations (Ritland and Ganders 1987; Awadalla and Ritland 1997; Sweigart et al. 1999), Iron Mountain is primarily outcrossing (Willis 1993, 1996, 1999a, b). Source seed was distributed into two experimental treatment groups each containing two replicate populations: “No Bee” treatment populations (A1, A2) and “Bee” treatment populations (B1, B2). Each population consisted of four boxes with approximately 200 plants per box. Boxes did not create subdivision within populations. Gene flow occurred across boxes within each population and seed was randomly dispersed among boxes when sown for the next generation. In Generation 1, each box was sown with 20 mg of source seed, but sowing density of subsequent generations was adjusted as necessary to maintain optimal adult density (∼200/box) within flats.
THE TREATMENTS
In each generation, for a total of five generations, seeds were grown to flowering plants following the same protocol. No Bee populations (A1, A2) were maintained in a pollinator-free greenhouse. Plants could reproduce only by selfing, or perhaps by physical contact with flowers of neighboring plants. Bee treatment populations (B1, B2) were grown in the same greenhouse except for two weeks during their flowering period. During this interval, Bee populations were rotated into a distinct greenhouse containing bumblebees (B. impatiens). We obtained colonies of approximately 30 bees from Koppert Biological Systems for each generation of the experiment. Replicates remained with the bees over two-day rotations for the duration of two weeks. As in previous experiments using Koppert bumblebee hives (Arathi and Kelly 2004), we observed that bees typically visited >10 flowers per foraging run and that most flowers were visited multiple times during a rotation. Replicate populations were kept separate, and bees isolated within their hive between rotations to prevent gene flow between B1 and B2. Six weeks after setting seed to soil, all populations were transported to a growth room allowing the plants to senesce. Fruits were collected as they matured. We counted the number of reproductive plants per population and bulked seed to sow the next generation.
BREEDING DESIGN
In December of 2008, progeny of Generation 5 were grown simultaneously with source plants without selection. In this Generation 6, 245 seedlings were sampled from each population with half randomly assigned as dams and the other half as sires. Floral measurements were taken on the first two flowers produced at anthesis, including corolla width, throat width, tube length, and anther–stigma separation (Fig. 1B). Floral measurements were averaged over both flowers, giving mean per-plant values. In addition, the maximum width of the largest vegetative leaf was recorded upon anthesis of the second flower. A pollen sample was collected from all individuals upon anthesis of a third flower and the number of viable and inviable pollen grains was estimated using a Coulter Counter Model Z1 dual (Kelly et al. 2002; Kelly and Arathi 2003). After measurements were completed, each sire was randomly paired with one dam within a population and hand-pollinated. This produced between 91 and 103 fully outbred families per population (Family numbers: A1 = 102, A2 = 91, B1 = 103, B2 = 103, Source = 99). Finally, leaf tissue was collected from each sire/dam individual for subsequent DNA extraction and genotyping.
The progeny of these crosses, three individuals per family (n = 1,494 total for Generation 7), were grown in two cohorts. Days to flower and the morphological measurements of Generation 6 were taken on each plant. The ability to set seed by self-fertilizing was evaluated by collecting seed produced from an unmanipulated fourth flower (no pollination). The inclusion of Generation 6 between the last generation of selection (Generation 5) and measurement of response (Generation 7) served two purposes. First, the random mating of Generation 6 adults allowed meaningful comparisons of trait mean values in Generation 7. Genotyping of Generation 6 plants (described below) confirmed that individuals within the No Bee and Bee populations were inbred to differing extents. Random mating of adults from Generation 6 produced outbred progeny within each population. Given that inbreeding directly changes means for these traits without selection (Holeski and Kelly 2006), outbred plants are necessary for meaningful comparisons of trait divergence across populations. Second, the controlled crosses generate a family structure for Generation 7 allowing us to estimate the genetic and environmental variance of each trait for each population.
GENOTYPING
To quantify genetic changes associated with mating system evolution, each individual of Generation 6 was scored at four putatively neutral gene-based markers (MgSTS_461, MgSTS_755, MgSTS_523, and MgSTS_641) and two previously mapped chromosomal polymorphisms. The length polymorphic marker HB5 was used as an indicator of the genotype at the meiotic drive polymorphism (D/d): the 277 base pairs (bp) length allele was scored as the derived allele, D, whereas all other allele lengths were scored as the ancestral allele, d. The derived inversion haplotype, C, was identified by a combination of alleles at two marker loci: allele length 240 bp at MgSTS_431 and allele length 201 bp at MgSTS_229. All other combinations were scored c (ancestral). DNA was extracted using our standard procedure (Marriage et al. 2009) followed by amplification using touchdown PCR (Hall and Willis 2005). All primer sequences can be accessed at www.mimulusevolution.org.
ANALYSIS
To determine if there was significant divergence among populations in the continuously distributed traits of Generation 7, we used one factor ANOVAs with Tukey–Kramer posthoc tests. We also applied a two-level ANOVA to each of these traits with population (random) nested within pollination treatment (fixed). “Self seed”—the raw count of seeds produced via autogamy of the fourth flower—was highly right skewed with many zeros. For this response variable, we applied an overdispersed Poisson model with the log link function. Another autogamy variable, ln self seed, is the natural logarithm of [seed count +1], a variable considered in several analyses (e.g., Figs. 3 and 5). Population and treatment effect analyses were performed using JMP 8© and Minitab 14©.
Figure 3.
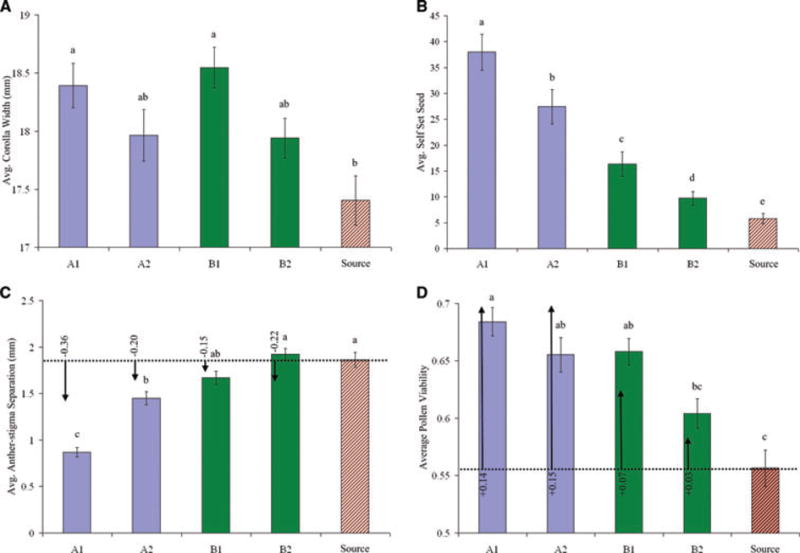
Character divergence and chromosomal polymorphism effects. Population trait means (Generation 7) are given for (A) corolla width, (B) self seed, (C) anther–stigma separation, and (D) pollen viability after five generations of selection for the No Bee (A1, A2), Bee (B1, B2), and source populations. Means sharing letters above bars are not significantly different from one another (Tukey–Kramer posthoc). Error bars are ± 1 SEM. In panels (C, D), the predicted effects of the two chromosomal polymorphisms are depicted with arrows for each population (direction and magnitude of trait change expected given the allele frequency difference from the source population). Values at arrow origins are predicted units of trait change. Panel (C) includes only the Inversion whereas (D) is combined effects of Inversion and Drive on pollen viability.
Figure 5.
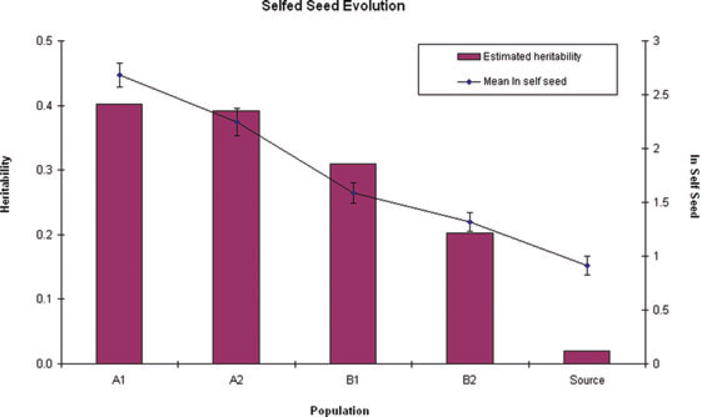
Mean autogamy positively covaries with heritability for this trait in Generation 7 plants. Error bars are ± 1 SEM.
The phenotypic effects of the two chromosomal polymorphisms on Generation 6 source plants were estimated using one-way ANOVA (Table S4). We denote the effect on phenotype of having one or two derived alleles as e1 and e2, respectively. The contribution of each chromosomal polymorphism to the outbred mean of a population was estimated as Z = 2×q×(1 − q) × e1 + q2 × e2, where q is the population frequency of the derived allele (Table 1). The predicted divergence between source and evolved population (A1, A2, B1, B2) trait means caused by allele frequency change at the chromosomal polymorphism is the difference in Z between populations.
Table 1.
Genotype counts for Generation 6 plants of each population at the Inversion and Drive chromosomal polymorphisms.
| Inversion | cc | Cc | CC | Total | C-type frequency |
|---|---|---|---|---|---|
| Source | 71 | 78 | 26 | 175 | 0.371 |
| A1 | 145 | 2 | 1 | 148 | 0.014 |
| A2 | 95 | 19 | 10 | 124 | 0.157 |
| B1 | 106 | 45 | 11 | 162 | 0.207 |
| B2 | 105 | 35 | 3 | 143 | 0.143 |
| Drive | dd | Dd | DD | Total | D-type frequency |
| Source | 41 | 96 | 40 | 177 | 0.497 |
| A1 | 107 | 34 | 31 | 172 | 0.279 |
| A2 | 138 | 11 | 17 | 166 | 0.136 |
| B1 | 78 | 77 | 32 | 187 | 0.377 |
| B2 | 36 | 67 | 55 | 158 | 0.560 |
The mean inbreeding coefficient (F) of each population was estimated from genotypic data (Generation 6 plants) at the length polymorphic markers MgSTS_461, MgSTS_755, MgSTS_523, and MgSTS_641. We used the moment estimator for F of Lynch and Ritland (1999) calculated by the program COANCESTRY (Wang 2011; http://www.zsl.org/science/research/software). The F estimates were subsequently used to estimate the additive genetic variance (VA) and environmental variance (VE) associated with measured traits in Generation 7. Assuming additive genetic inheritance, the predicted covariance of full-siblings is (1 + F) VA (Harris 1964). We used maximum likelihood to estimate variance components, first assuming a single VA and VE across populations (Model I). We then fit a more elaborate model allowing VA to differ among populations (Model II). Finally, we allowed population-specific values for both VA and VE (Model III). All models contained six fixed effects: trait means for each population (A1, A2, B1, B2, and Source) and a cohort effect (the difference in means between cohorts due to environmental effects). We compare Models (II to I and III to II) on a trait-to-trait basis using likelihood ratio tests. There are four more parameters in Model II than Model I and four more in Model III than Model II, giving a critical value for each test of 9.49. These tests are likely conservative given that variances are bounded to nonnegative values (Self and Liang 1987). The computer programs to execute these calculations were simplified from previous C programs (Kelly 2003, 2008; Kelly and Arathi 2003) and the code is available upon request.
Results
PHENOTYPIC EVOLUTION
Mean fecundity within the Bee populations remained high over the five generations of pollination (Fig. 2). Per capita seed production was greatly reduced in the No Bee populations in early generations, but improved substantially in generations 4–5. All measured traits differed significantly among populations in Generation 7 (Fig. 3, Table 2; descriptive statistics are reported for all measured traits in Generations 6 and 7 in Tables S1 and S2). However, divergence was clearly explained by pollination treatment only for days to flower and production of self-fertilized seed (Table 2). Despite large differences among populations, flower size was not clearly associated with treatment. The joint distribution of anther–stigma separation and autogamous seed set across populations (Fig. 4) suggests that evolution in the former trait may be causally related to improvement of average plant fitness within the No Bee populations over time (Fig. 2).
Figure 2.
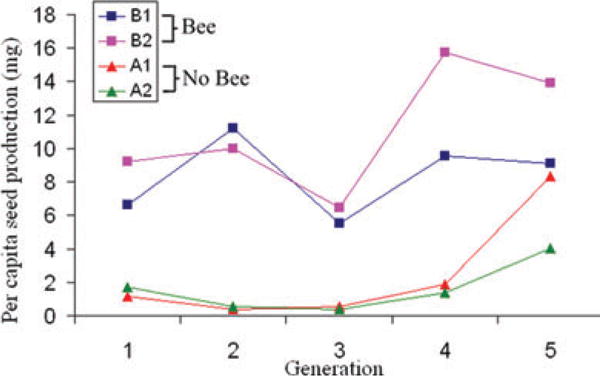
Population fitness over five generations of evolution. Per capita seed production (mg) for each population and generation calculated by dividing bulked seed collected from each population by the number of adult plants. As a consequence, standard errors could not be estimated.
Table 2.
Tests for trait mean differences in Generation 7 for each measured trait. (A) Tests for differences among populations (population as factor). (B) Tests with population nested within treatment.
| Trait | F ratio | P value | (A) Treatment | (B) Population within treatment | ||
|---|---|---|---|---|---|---|
| F ratio | P value | F ratio | P value | |||
| Days to flower | 23.70 | <0.0001 | 45.91 | 0.0228 | 1.00 | 0.3677 |
| Avg. CW (mm) | 5.62 | 0.0002 | 1.91 | 0.3456 | 3.71 | 0.0221 |
| Avg. TW (mm) | 13.01 | <0.0001 | 1.82 | 0.3541 | 8.65 | 0.0002 |
| Avg. TL (mm) | 10.53 | <0.0001 | 2.10 | 0.3230 | 6.69 | 0.0013 |
| Avg. A/S (mm) | 36.92 | <0.0001 | 2.46 | 0.2891 | 19.19 | <0.0001 |
| Leaf Width (mm) | 11.86 | <0.0001 | 14.13 | 0.0679 | 1.48 | 0.2273 |
| ln Total Pollen | 13.67 | <0.0001 | 1.57 | 0.4337 | 10.68 | <0.0001 |
| PV | 14.02 | <0.0001 | 4.62 | 0.1787 | 4.81 | 0.0083 |
| LRT | P value | LRT | P value | LRT | P value | |
| Self Seed (raw count) | 133.4 | <0.0001 | 109.8 | <0.0001 | 12.64 | 0.0018 |
Figure 4.
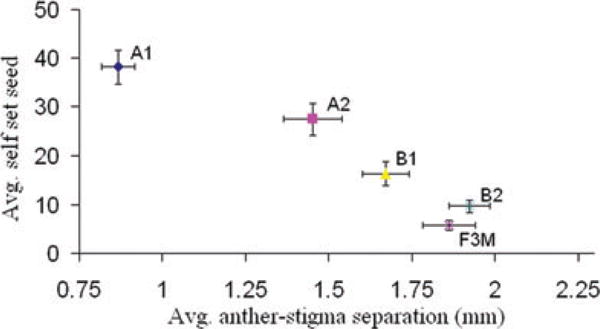
Bivariate plot of the negative relationship between mean anther–stigma separation and mean self seed by experimental population for Generation 7. Error bars are ± 1 SEM.
GENETIC DIVERGENCE
All experimental populations maintained substantial allelic variation at our four putatively neutral markers (Table S3), although expected heterozygosity values were lowest in the No Bee populations. The mean inbreeding coefficient (F) was indistinguishable from zero in Generation 6 of the source population, which is expected given that these plants were generated by controlled out-crosses. F was moderate for Bee populations (F[B1] = 0.43, SE = 0.04; F[B2] = 0.33, SE = 0.04) and high for No Bee populations (F[A1] = 0.75, SE = 0.04; F[A2] = 0.73, SE = 0.03). Substantial changes in allele frequency at both chromosomal polymorphisms were observed within experimental populations (Table 1; LG6 Inversion: χ2 = 137.8, df = 8, P< 0.0001; LG11 Drive locus: χ2 = 200.2, df = 8, P< 0.0001). The derived alleles for each (C, D) were at an intermediate frequency in the source population. C and D frequencies declined across experimental populations, but the reductions were substantially greater in the No Bee than Bee populations.
Hypothesis tests and estimates for quantitative genetic variance components (VA and VE) are summarized in Table 3. We cannot reject Model I (same VA and VE across all five populations) for average throat width (TW), average tube length (TL), or leaf width. The other floral dimension (average CW) does exhibit marginally significant differences in VA and VE across populations. The most pronounced changes in variance components were observed for anther–stigma separation, days to flower, ln self seed, and the pollen traits. A consistent increase in VA across experimental populations relative to the source population is evident for anther–stigma separation and ln self seed. Figure 5 illustrates the correspondence between mean values for ln self seed and the estimated heritability of this trait (obtained from Model II) across populations.
Table 3.
Model-specific estimates of the variance components reported for each trait in each population. Variance estimates are standardized such that the trait variance of the source population is 1. The LRT value next to model 2 is the test of model 2 versus model 1, whereas the value next to model 3 is for model 3 versus model 2. For each trait, bold indicates the model favored by the LRT.
| Trait | Model | LRT | VE | VA | ||||||||
|---|---|---|---|---|---|---|---|---|---|---|---|---|
| Source | A1 | A2 | B1 | B2 | Source | A1 | A2 | B1 | B2 | |||
| Avg. CW | 1 | 0.74 | 0.26 | |||||||||
| 2 | 7.0 | 0.61 | 0.39 | 0.20 | 0.20 | 0.21 | 0.12 | |||||
| 3 | 10.4 | 0.62 | 0.74 | 0.78 | 0.53 | 0.99 | 0.38 | 0.26 | 0.22 | 0.47 | 0.01 | |
| Avg. TW | 1 | 0.78 | 0.22 | |||||||||
| 2 | 4.7 | 0.70 | 0.30 | 0.09 | 0.20 | 0.23 | 0.21 | |||||
| 3 | 6.2 | 0.64 | 0.83 | 0.81 | 0.66 | 0.94 | 0.36 | 0.17 | 0.19 | 0.34 | 0.06 | |
| Avg. TL | 1 | 0.68 | 0.32 | |||||||||
| 2 | 5.9 | 0.55 | 0.45 | 0.27 | 0.23 | 0.22 | 0.22 | |||||
| 3 | 9.3 | 0.71 | 0.81 | 0.68 | 0.55 | 0.67 | 0.29 | 0.19 | 0.32 | 0.45 | 0.33 | |
| Avg. A/S | 1 | 0.80 | 0.20 | |||||||||
| 2 | 28.3 | 0.56 | 0.44 | 0.00 | 0.26 | 0.28 | 0.11 | |||||
| 3 | 38.3 | 0.98 | 0.71 | 0.86 | 0.72 | 0.82 | 0.02 | 0.29 | 0.14 | 0.28 | 0.18 | |
| Days to flower | 1 | 0.92 | 0.08 | |||||||||
| 2 | 16.5 | 0.71 | 0.29 | 0.14 | 0.21 | 0.00 | 0.03 | |||||
| 3 | 16.5 | 1.00 | 0.97 | 0.72 | 1.00 | 0.92 | 0.00 | 0.03 | 0.28 | 0.00 | 0.08 | |
| Leaf width | 1 | 0.68 | 0.32 | |||||||||
| 2 | 6.4 | 0.57 | 0.43 | 0.16 | 0.26 | 0.29 | 0.25 | |||||
| 3 | 5.2 | 0.69 | 0.76 | 0.65 | 0.55 | 0.84 | 0.31 | 0.24 | 0.35 | 0.45 | 0.16 | |
| ln total pollen | 1 | 0.83 | 0.17 | |||||||||
| 2 | 23.4 | 0.54 | 0.46 | 0.10 | 0.00 | 0.10 | 0.23 | |||||
| 3 | 13.4 | 0.93 | 0.76 | 1.00 | 0.66 | 0.86 | 0.07 | 0.24 | 0.00 | 0.34 | 0.14 | |
| ln self seed | 1 | 0.69 | 0.31 | |||||||||
| 2 | 17.5 | 0.98 | 0.02 | 0.66 | 0.63 | 0.44 | 0.25 | |||||
| 3 | 1.5 | 1.00 | 0.57 | 0.69 | 0.66 | 0.76 | 0.00 | 0.43 | 0.31 | 0.34 | 0.24 | |
| PV | 1 | 0.82 | 0.18 | |||||||||
| 2 | 25.0 | 0.55 | 0.45 | 0.05 | 0.06 | 0.05 | 0.19 | |||||
| 3 | 2.2 | 0.70 | 0.91 | 0.90 | 0.86 | 0.78 | 0.30 | 0.09 | 0.10 | 0.14 | 0.22 | |
PREDICTING PHENOTYPIC FROM GENETIC DIVERGENCE
In the source plants of Generation 6, the Inversion had significant effects on leaf width, anther–stigma separation, and pollen viability, whereas the Drive locus affected only pollen viability and ln total pollen (Table S4). Using these point estimates for effects on anther–stigma separation and pollen viability, our allele frequency estimates within populations A1, A2, B1, and B2 predict the amount of phenotypic change due to changes at the Inversion and Drive loci. Selection against C and D alleles appeared to explain a large fraction of pollen viability evolution (Fig. 3D), as well as an incremental contribution to differences in anther–stigma separation (Fig. 3C).
Discussion
Populations subjected to novel environmental stress are likely to have reduced reproductive success. If the stress is severe, populations may be driven extinct. However, theoretical (Lynch and Lande 1993; Gomulkiewicz and Holt 1995) and empirical (Bell and Gonzalez 2009) work has shown that populations with sufficient genetic variation may evolve rapidly enough to overcome extinction. The evolutionary rescue model predicts an initial population decline following environmental change, succeeded by an exponential increase of adapted genotypes. Our No Bee populations effectively experienced an immediate environmental change in that a population adapted to outcrossing was denied pollinators. Mean fitness declined precipitously in the first two generations, but rebounded as selfing-efficient genotypes increased in frequency. The resulting population trajectories are thus consistent with evolutionary rescue (Fig. 2).
Environmental conditions were not sufficiently harsh in the present experiment to provide a full test of the evolutionary rescue model. This is because pollinator loss did not cause negative population growth. Even in the first few generations, the No Bee populations were adequately fecund to seed the next generation at prescribed levels (absolute fitness > 1). Natural populations face harsher physical conditions and the potentially reinforcing effects of demographic stochasticity and inbreeding depression. Thus, in the field, pollinator loss would likely cause negative population growth. Additionally, although increased selfing may be advantageous in the short term, this shift in mating system could prove detrimental in the long run. Elevated inbreeding has myriad consequences, including alteration of the distribution of genetic variation within populations, the balance between mutation and selection, the effective population size, gene flow, and metapopulation dynamics (Lande and Schemske 1985; Charlesworth 2003). Reduced genetic diversity may limit further adaptive evolution within a population and perhaps increase the likelihood of extinction (Stebbins 1957; Igic et al. 2008).
MATING SYSTEM EVOLUTION
The observed changes in the No Bee populations (A1 and A2) provide clear support for the reproductive assurance hypothesis— pollinator absence generated strong selection for traits that facilitate selfing. Across experimental populations, selfed seed set was strongly correlated with reduced anther–stigma separation (Fig. 4); consistent with field results showing positive selection for reduced anther–stigma separation under pollen-limiting conditions (Fishman and Willis 2008). An unexpected outcome is that our Bee populations also evolved an increased capacity for selfing (Figs. 3–5). Mean inbreeding coefficients at neutral markers are consistent with a selfing rate of approximately 0.5 in B1 and B2 (Table S3). In part, selection for selfing may be due to the fact that our two-week pollination interval is nested within the flowering interval. Flowers that open before the arrival of bees, or after their departure, can only set seed by selfing or through physical contact between flowers of neighboring plants.
Bumblebees moving pollen from one flower to another on the same plant (geitonogamy) is likely a major cause of selfing in the Bee populations. We routinely observed intraplant visitation in the foraging runs of bumblebees. Unlike the differences in selfed seed set produced by Generation 7 plants, geitonogamy is not clearly an evolved response of the Bee populations. Instead, it is an incidental effect of plants producing multiple flowers at the same time. An alternative hypothesis for frequent selfing in the Bee populations is that bumblebees were ineffective pollinators, but multiple lines of evidence speak against this explanation. Per capita seed set was uniformly high in the Bee populations, even in the first few generations when these populations had limited capacity for autogamy (Fig. 2). Second, previous experiments have shown that recurrent visitation of M. guttatus by B. impatiens yields seed set comparable to saturating hand-pollination (see Fig. 2 of Arathi and Kelly 2004). In principle, visitation could induce selfing if a foraging bee carries pollen from anthers to stigma within a flower. However, M. guttatus has a touch-sensitive stigma in which the pollen receiving surface quickly closes after first contact of the pollinator. This limits the opportunity for induced selfing. Direct evidence for infrequent induced selfing comes from a different set of experiments in which we measured seed set from the first eight flowers (each on a different plant) visited by a bee on a foraging run (Julius P. Mojica, unpubl. data). Bees were not carrying pollen at the beginning of a run and none of the flowers had been previously visited. Thus, any seed from the first flowers visited should be due to selfing. An average 0.125 seeds were set by first flowers (SE = 0.125). In contrast, the average seed produced by flowers 3–8 of a foraging run was 29.8 (SE = 4.4). This striking difference in seed counts suggests that B. impatiens is an effective pollinator in this experimental system.
Although geitonogamy is likely a major contributor to the high selfing rate of Bee populations (marker data from Generation 6), it does not explain the increased capacity for within-flower selfing (phenotypic measurements of Generation 7; Fig. 5). Other environmental features of our experiment may have favored elevated autogamy in our Bee populations. The automatic transmission advantage associated with selfing (Fisher 1941) implies that high inbreeding depression (ID) is necessary to maintain outcrossing even if pollination is not limiting (Lloyd 1979; Charlesworth and Charlesworth 1987). The Iron Mountain population does exhibit high ID (Willis 1993; Kelly 2003), but the severity of ID is environmentally dependent (Carr and Dudash 1996; Armbruster and Reed 2005) and may be less severe under the growth conditions of this study. Also, our populations were evolving with greatly reduced temporal variation in environmental conditions relative to the field. One of the major consequences and potential advantages of outcrossing is the production of genetically variable progeny. Any advantage associated with variable progeny would likely be diminished in our experiment and might even have been a disadvantage.
The rapid changes in traits observed under our selection regime provide a useful contrast to the observed phenotypic divergence between M. guttatus and closely related but selfing species such as M. nasutus (Fig. 1A), M. micranthus, and M. cupriphilus. Our No Bee populations evolved toward the “selfing phenotype” in some traits, but not others. As in the selfing species, anther–stigma separation decreased and self seed increased. However, corolla size was not substantially reduced in No Bee populations relative to Bee populations. Days to flower evolved opposite to the syndrome. Bee populations progress to flowering faster than No Bee populations (Table S1), on average within two days of when bumblebees first became available during each generation. These observations suggest that the evolution of selfing can occur in a sequential fashion, with change in some traits preceding others. The first steps may be the recruitment of standing genetic variation for traits key to reproductive assurance such as self seed production. Reduction in flower size may follow as secondary evolutionary response.
Fenster and Ritland (1994) suggested that pollinator limitation may have been responsible for the evolution of the selfing taxa M. laciniatus and M. micranthus and our results indicate the plausibility of this selective mechanism. However, Macnair and Cumbes (1989) proposed that selfing in M. cupriphilus evolved subsequent to colonization of copper mine tailings as a means to reduce maladaptive gene flow. Also, the selfing taxa in the complex tend to occupy relatively drier habitats than M. guttatus (e.g., Macnair et al. 1989; Kiang and Hamrick 1978) so edaphic adaptation might provide an alternative route for the evolution of selfing (see Macnair and Gardner 1999). Levin (2010) has recently argued that colonization of novel habitat may itself cause increased self-fertilization via plastic responses in traits such as anther–stigma separation. In our experiment, physical conditions were constant and changes in mating system were genetically based and not due to plasticity. However, the experimental evolution methodology could be adapted to constant pollination with variable edaphic conditions and thus employed to investigate these alternative scenarios.
MAJOR POLYMORPHISMS AND THE GENETIC BASIS OF DIVERGENCE
Large allele frequency changes occurred at both the LG 6 Inversion and the LG 11 Meiotic Drive Locus (Table 1). Previous studies had documented pronounced effects of both of these chromosomal polymorphisms on pollen viability; and strong but less-consistent effects on floral pigmentation, rate of development, and anther–stigma separation (Fishman and Saunders 2008; Scoville et al. 2009). In the current experiment, allele frequency changes at these two loci jointly explain most of the change in pollen viability (Fig. 3D). Given that a major goal for quantitative trait locus mapping is to understand morphological evolution at a genetic scale, these data provide an encouraging example. Unfortunately, we cannot determine whether these loci contributed to changes in self seed because this trait was not measured in Generation 6.
As noted in the Introduction, major polymorphisms may be critical to evolutionary rescue (Gomulkiewicz et al. 2010). The Inversion and Drive Locus are polymorphisms with major effects, but evolution at these loci may be more a consequence of mating system evolution than a cause. The observed increases in pollen viability are likely due to genetic purging. Inbreeding increases the frequency of homozygotes relative to heterozygotes and homozygosity is apparently detrimental to the derived types (C and D) at each locus (Table S4; Fishman and Saunders 2008; Lee 2009; Scoville et al. 2009). The Driver (D) has a segregation advantage in female gamete formation of heterozygotes, but DD individuals have approximately 20% lower pollen viability. Less is known about the derived Inversion allele (C), but several experiments have found reduced pollen viability of CC plants. Homozygosity is highest in the No Bee populations, intermediate in the Bee populations, and lowest in the source population (Table S3).
Changes in the additive genetic variance (VA) of experimental populations also suggest a contribution of major polymorphisms to standing variation (Fig. 5; Table 3). If the genetic variance in a trait is due entirely to small contributions from many loci (the infinitesimal model), the variance should evolve much more slowly than the mean under directional selection. Changes in allele frequency at a major locus can cause VA to increase or decrease, depending on allele frequencies (Agrawal et al. 2001). The apparent increase in VA with increased ln self seed across populations (Fig. 5) suggests that alleles increasing autogamy may be uncommon and/or partly recessive in our source population. Selection favoring such alleles would have brought them to more intermediate frequencies, simultaneously increasing trait means and variances. Scalar epistasis is an alternative explanation for Fig. 5 given that the source population is close to the lowest possible value for the trait (zero seed set). Interpretation is more straightforward for pollen viability given the direct measurements of causal loci (the Driver and the Inversion). Here, selection drove C and D from intermediate frequencies to relative rarity (Table 1) which is likely the major cause for the striking reductions in VA for pollen viability in A1, A2, and B1 relative to the source population.
CAVEATS
Our experimental populations were founded by genotypes from a single natural population and our propagation methods were devised based on results from studies of that original population. For example, microsatellite loci exhibit minimal spatial structure over the Iron Mountain site (Sweigart et al. 1999), and for this reason, we randomly mixed seed within populations between generations. However, plant populations routinely exhibit small-scale structure owing to limited seed dispersal (Levin 1988), including other populations of M. guttatus (Ritland and Ganders 1987). In this situation, transfer of pollen between neighboring plants results in biparental inbreeding. Biparental inbreeding was excluded by design from this experiment, but could be an important factor in mating system evolution more generally (Uyenoyama et al. 1993).
Perhaps the most important issue, at least with regard to the generality of our results, is the amount and pattern of genetic variation for mating-system related traits. There are two reasons that the current experiment may underestimate the response to selection following pollinator loss. The first is that Iron Mountain contains only a fraction of the genetic variation present in M. guttatus, a species distributed broadly across the western United States. Although the population is a natural unit for investigations of microevolution, response at the meta-population level might be greater if pollinator loss occurs on a broad geographic scale. Also, other populations of M. guttatus may actually have a greater initial capacity for response to selection for increased selfing. Iron Mountain is a highly outcrossing population (Willis 1993) and the additive genetic variance in autogamy might be higher in populations with higher average selfing rates (e.g., Awadalla and Ritland 1997).
A second reason that we may be underestimating response is that our founding population contained only a subset of the genetic variation resident to Iron Mountain. All variation in the source population is due to segregation of heterozygosity from three F1 plants (see Methods). The sampling effect on our source population can be directly evaluated from the variance component estimates in Table 3. The estimated heritability of corolla width is 0.38 for the source population, exactly the value obtained from a large half-sibling/full-sibling breeding design (see Control population estimates from Table 3 of Kelly 2008). Source heritability estimates for anther–stigma separation, days to flower, and pollen number are lower than in the background population. The notable exception is pollen viability, where the source population heritability (0.45) is about twice the estimate for the entire population (see Table 3 of Scoville et al. 2009). This can be largely explained by the fact that the Inversion and Drive polymorphisms, each with large effects on pollen viability, have more intermediate allele frequencies in our source than in the background population. Here, we note that the variance component estimates of Table 3 were obtained from outbred plants (Generation 7) created through controlled crosses (Generation 6). As a consequence, differences in genetic variances can be attributed to differences in allele frequencies. However, the estimates of Table 3 do not capture the effects of inbreeding on genetic variation owing to deviations from Hardy–Weinberg equilibrium or interlocus associations. These associations likely affected response to selection, but were eliminated or at least diminished by the breeding design of Generations 6 and 7.
SUMMARY
The extent of phenotypic changes evident after only five generations indicates that rapid adaptation is possible if a population loses pollinators. Self-compatible, pollinator-reliant plants experiencing mounting human-induced environmental stress might adapt rapidly in the short term. However, the resulting decrease in genetic diversity may leave them vulnerable to extinction with further environmental alterations. We found that a substantial fraction of phenotypic change could be explained by large changes in allele frequency at two chromosomal polymorphisms; an intriguing observation in light of recent theoretical work on evolutionary rescue. The increase of genetic variance along with mean trait expression of self fecundity is consistent with a scenario in which rare alleles in the source population increased in frequency as populations evolved increased selfing. Finally, our results favor a sequential model for the evolution of the selfing syndrome. Traits essential to increasing selfing efficiency (e.g., anther–stigma separation) evolve first, followed by evolution of other characters (e.g., flower size) subsequent to mating system change.
Supplementary Material
Table S1. Least squares means and standard deviations are reported for each measured trait of Generation 6.
Table S2. Least squares means and standard deviations for each measured trait of Generation 7.
Table S3. Neutral marker data for genotyped individuals of Generation 6.
Table S4. The effect of chromosomal polymorphisms on traits in Source plants of Generation 6.
Acknowledgments
We thank H. Alexander, J. Willis, T. Marriage, C. McNeil, S. Roels, V. Koelling, L. Hileman, and two anonymous referees for helpful comments on the manuscript. USDA-ARS pollinator data were provided by H.W. Ikerd and supported in part by the Yosemite Fund. This project was supported by grants NIH GM073990, NSF DEB-054052, and NSF DEB-1010899, and by funding from the University of Kansas Botany Endowment Funds.
Footnotes
Supporting Information
The following supporting information is available for this article:
Supporting Information may be found in the online version of this article.
Please note: Wiley-Blackwell is not responsible for the content or functionality of any supporting information supplied by the authors. Any queries (other than missing material) should be directed to the corresponding author for the article.
LITERATURE CITED
- Agrawal AF, Brodie ED, Rieseberg LH. Possible consequences of genes of major effect: transient changes in the G-matrix. Genetica. 2001;112–113:33–43. [PubMed] [Google Scholar]
- Arathi HS, Kelly JK. Corolla morphology facilitates both autogamy and bumblebee pollination in Mimulus guttatus. Int J Plant Sci. 2004;165:139–145. [Google Scholar]
- Armbruster P, Reed DH. Inbreeding depression in benign and stressful environments. Heredity. 2005;95:235–242. doi: 10.1038/sj.hdy.6800721. [DOI] [PubMed] [Google Scholar]
- Awadalla P, Ritland K. Microsatellite variation and evolution in the Mimulus guttatus species complex with contrasting mating systems. Mol Biol Evol. 1997;14:1023–1034. doi: 10.1093/oxfordjournals.molbev.a025708. [DOI] [PubMed] [Google Scholar]
- Baker HG. Support for Baker’s Law-as a rule. Evolution. 1967;21:853–856. doi: 10.1111/j.1558-5646.1967.tb03440.x. [DOI] [PubMed] [Google Scholar]
- Bell G, Gonzalez A. Evolutionary rescue can prevent extinction following environmental change. Ecol Lett. 2009;12:942–948. doi: 10.1111/j.1461-0248.2009.01350.x. [DOI] [PubMed] [Google Scholar]
- Cameron SA, Hines HM, Williams PH. A comprehensive phylogeny of the bumble bees (Bombus) Biol J Linn Soc. 2007;91:161–188. [Google Scholar]
- Carr DE, Dudash MR. Inbreeding depression in two species of Mimulus (Scrophulariaceae) with contrasting mating systems. Am J Bot. 1996;83:586–593. [Google Scholar]
- Carr DE, Fenster CB. Levels of genetic variation and covariation for Mimulus (Scrophulariaceae) floral traits. Heredity. 1994;72:606–618. [Google Scholar]
- Charlesworth D. Effect of inbreeding on genetic diversity of populations. Phil Trans R Soc Lond B. 2003;358:1051–1070. doi: 10.1098/rstb.2003.1296. [DOI] [PMC free article] [PubMed] [Google Scholar]
- Charlesworth D, Charlesworth B. Inbreeding depression and its evolutionary consequences. Annu Rev Ecol Syst. 1987;18:237–268. [Google Scholar]
- Committee on the Status of Pollinators in North America. Fruits of their labour: status of pollinators in North America National. Academies Press; Washington DC: 2007. [Google Scholar]
- Dole JA. Reproductive assurance mechanisms in three taxa of the Mimulus guttatus complex (Scrophulariaceae) Am J Bot. 1992;79:650–659. [Google Scholar]
- Eckert CG, Kalisz S, Geber MA, Sargent R, Elle E, Cheptou PO, Goodwillie C, Johnston MO, Kelly JK, Moeller DA, et al. Plant mating systems in a changing world. Trends Ecol Evol. 2010;25:35–43. doi: 10.1016/j.tree.2009.06.013. [DOI] [PubMed] [Google Scholar]
- Fenster CB, Ritland K. Evidence for natural selection on mating system in Mimulus (Scrophulariaceae) Int J Plant Sci. 1994;155:588–596. [Google Scholar]
- Fisher RA. Average excess and average effect of a gene substitution. Ann Eugen. 1941;11:53–63. [Google Scholar]
- Fishman L, Kelly AJ, Willis JH. Minor quantitative trait loci underlie floral traits associated with mating system divergence in Mimulus. Evolution. 2002;56:2138–2155. doi: 10.1111/j.0014-3820.2002.tb00139.x. [DOI] [PubMed] [Google Scholar]
- Fishman L, Saunders A. Centromere-associated female meiotic drive entails male fitness costs in monkeyflowers. Science. 2008;322:1559–1562. doi: 10.1126/science.1161406. [DOI] [PubMed] [Google Scholar]
- Fishman L, Willis JH. Pollen limitation and natural selection on floral characters in the yellow monkeyflower, Mimulus guttatus. New Phytol. 2008;177:802–810. doi: 10.1111/j.1469-8137.2007.02265.x. [DOI] [PubMed] [Google Scholar]
- Franklin HJ. The Bombidae of the new world. Trans Am Ent Soc. 1912;38:177–486. [Google Scholar]
- Gomulkiewicz R, Holt RD. When does evolution by natural selection prevent extinction? Evolution. 1995;49:201–207. doi: 10.1111/j.1558-5646.1995.tb05971.x. [DOI] [PubMed] [Google Scholar]
- Gomulkiewicz R, Holt RD, Barfield M, Nuismer SL. Genetics, adaptation and invasion in harsh environments. Evol Appl. 2010;3:97–108. doi: 10.1111/j.1752-4571.2009.00117.x. [DOI] [PMC free article] [PubMed] [Google Scholar]
- Grant AL. A monograph of the genus Mimulus. Ann Missouri Bot Gard. 1924;11:99–398. [Google Scholar]
- Grant V. Pollination systems as isolating mechanisms in angiosperms. Evolution. 1949;3:82–97. doi: 10.1111/j.1558-5646.1949.tb00007.x. [DOI] [PubMed] [Google Scholar]
- Hall MC, Willis JH. Transmission ratio distortion in intraspecific hybrids of Mimulus guttatus: implications for genomic divergence. Genetics. 2005;170:375–386. doi: 10.1534/genetics.104.038653. [DOI] [PMC free article] [PubMed] [Google Scholar]
- Harris DL. Genotypic covariances between inbred relatives. Genetics. 1964;50:1319–1348. doi: 10.1093/genetics/50.6.1319. [DOI] [PMC free article] [PubMed] [Google Scholar]
- Hegland SJ, Nielsen A, Lázaro A, Bjerknes AL, Totland Ø. How does climate warming affect plant-pollinator interactions? Ecol Lett. 2009;12:184–195. doi: 10.1111/j.1461-0248.2008.01269.x. [DOI] [PubMed] [Google Scholar]
- Holeski LM, Kelly JK. Mating system and the evolution of quantitative traits: an experimental study of Mimulus guttatus. Evolution. 2006;60:711–723. [PubMed] [Google Scholar]
- Igic B, Lande R, Kohn JR. Loss of self-incompatibility and its evolutionary consequences. Int J Plant Sci. 2008;169:93–104. [Google Scholar]
- Ivey CT, Carr DE. Effects of herbivory and inbreeding on the pollinators and mating system of Mimulus guttatus (Phrymaceae) Am J Bot. 2005;92:1641–1649. doi: 10.3732/ajb.92.10.1641. [DOI] [PubMed] [Google Scholar]
- Kalisz S, Vogler DW, Hanley KM. Context-dependent autonomous self-fertilization yields reproductive assurance and mixed mating. Nature. 2004;430:884–887. doi: 10.1038/nature02776. [DOI] [PubMed] [Google Scholar]
- Kelly JK. Deleterious mutations and the genetic variance of male fitness components in Mimulus guttatus. Genetics. 2003;164:1071–1085. doi: 10.1093/genetics/164.3.1071. [DOI] [PMC free article] [PubMed] [Google Scholar]
- Kelly JK. Testing the rare alleles model of quantitative variation by artificial selection. Genetica. 2008;132:187–198. doi: 10.1007/s10709-007-9163-4. [DOI] [PMC free article] [PubMed] [Google Scholar]
- Kelly JK, Arathi HS. Inbreeding and the genetic variance of floral traits in Mimulus guttatus. Heredity. 2003;90:77–83. doi: 10.1038/sj.hdy.6800181. [DOI] [PubMed] [Google Scholar]
- Kelly JK, Willis JH. A manipulative experiment to estimate bi-parental inbreeding in Monkeyflowers. Int J Plant Sci. 2002;163:575–579. [Google Scholar]
- Kelly JK, Rasch A, Kalisz S. A method to estimate pollen viability from pollen size variation. Am J Bot. 2002;89:1021–1023. doi: 10.3732/ajb.89.6.1021. [DOI] [PubMed] [Google Scholar]
- Kiang YT, Hamrick JL. Reproductive isolation in the Mimulus guttatus-M. nasutus complex. Am Midl Nat. 1978;100:269–276. [Google Scholar]
- Lande R, Schemske DW. The evolution of self-fertilization and inbreeding depression in plants. I. Genetic models. Evolution. 1985;39:24–40. doi: 10.1111/j.1558-5646.1985.tb04077.x. [DOI] [PubMed] [Google Scholar]
- Lee YW. Ph D thesis. Duke University; Durham, NC: 2009. Genetic analysis of standing variation for floral morphology and fitness components in a natural population of Mimulus guttatus (common monkeyflower) [Google Scholar]
- Levin DA. Local differentiation and the breeding structure of plant populations. In: Gottleib LD, Jain SK, editors. Plant evolutionary biology. Chapman and Hall; New York: 1988. pp. 305–329. [Google Scholar]
- Levin DA. Environment-enhanced self-fertilization: implications for niche shifts in adjacent populations. J Ecol. 2010;98:1276–1283. [Google Scholar]
- Lloyd DG. Some reproductive factors affecting the selection of self-fertilization in plants. Am Nat. 1979;113:67–79. [Google Scholar]
- Lynch M, Lande R. Evolution and extinction in response to environmental change. In: Kareiva PM, Kingsolver JG, Huey RB, editors. Biotic interactions and global climate change. Sinauer; Sunderland, MA: 1993. pp. 234–250. [Google Scholar]
- Lynch M, Ritland K. Estimation of pairwise relatedness with molecular markers. Genetics. 1999;152:1753–1766. doi: 10.1093/genetics/152.4.1753. [DOI] [PMC free article] [PubMed] [Google Scholar]
- Macnair MR. A new species of Mimulus endemic to copper mines in California. Bot J Linn Soc. 1989;100:1–14. [Google Scholar]
- Macnair MR, Cumbes QJ. The genetic architecture of interspecific variation in Mimulus. Genetics. 1989;122:211–222. doi: 10.1093/genetics/122.1.211. [DOI] [PMC free article] [PubMed] [Google Scholar]
- Macnair MR, V, Macnair E, Martin BE. Adaptive speciation in Mimulus: an ecological comparison of Mimulus cupriphilus with its presumed progenitor Mimulus guttatus. New Phytol. 1989;112:269–279. [Google Scholar]
- Macnair MR, Gardner M. The evolution of edaphic endemics. In: Howard DJ, Berlocher SH, editors. Endless forms: species and speciation. Oxford Univ Press; Oxford: 1999. pp. 157–171. [Google Scholar]
- Marriage TN, Hudman S, Mort ME, Orive ME, Shaw RG, Kelly JK. Direct estimation of the mutation rate at dinucleotide microsatellite loci in Arabidopsis thaliana (Brassicaceae) Heredity. 2009;103:310–317. doi: 10.1038/hdy.2009.67. [DOI] [PMC free article] [PubMed] [Google Scholar]
- Martin N. Flower size preferences of the honeybee (Apis mellifera) foraging on Mimulus guttatus (Scrophulariaceae) Evol Ecol. 2004;6:777–782. [Google Scholar]
- Memmott J, Craze PG, Waser NM, Price MV. Global warming and the disruption of plant-pollinator interactions. Ecol Lett. 2007;10:710–717. doi: 10.1111/j.1461-0248.2007.01061.x. [DOI] [PubMed] [Google Scholar]
- Mitchell RJ, Karron JD, Holmquist KG, Bell JM. The influence of Mimulus ringens floral display size on pollinator visitation patterns. Funct Ecol. 2004;18:116–124. [Google Scholar]
- Ornduff R. Reproductive biology in relation to systematics. Taxon. 1969;18:121–133. [Google Scholar]
- Owen RE, Whidden TL, Plowright RC. Genetic and morphometric evidence for the conspecific status of the bumble bees, Bombus melanopygus and Bombus edwardsii. J Insect Sci. 2010;10:1–18. doi: 10.1673/031.010.10901. [DOI] [PMC free article] [PubMed] [Google Scholar]
- Ritland K, Ganders FR. Covariation of selfing rates with parental gene fixation indexes within populations of Mimulus guttatus. Evolution. 1987;41:760–771. doi: 10.1111/j.1558-5646.1987.tb05851.x. [DOI] [PubMed] [Google Scholar]
- Ritland C, Ritland K. Variation of sex allocation among 8 taxa of the Mimulus guttatus species complex (Scrophulariaceae) Am J Bot. 1989;76:1731–1739. [Google Scholar]
- Robertson AW, Diaz A, MacNair MR. The quantitative genetics of floral characters in Mimulus guttatus. Heredity. 1994;72:300–311. [Google Scholar]
- Robertson AW, Mountjoy C, Faulkner BE, Roberts MV, Macnair MR. Flower choice by bumblebees collecting pollen from Mimulus guttatus (Scrophulariaceae): the effects of pollen quality and reward depletion. Ecology. 1999;80:2594–2606. [Google Scholar]
- Schemske DW, Bradshaw HD. Pollinator preference and the evolution of floral traits in monkeyflowers (Mimulus) Proc Natl Acad Sci USA. 1999;96:11910–11915. doi: 10.1073/pnas.96.21.11910. [DOI] [PMC free article] [PubMed] [Google Scholar]
- Scoville A, Lee YW, Willis JH, Kelly JK. Contribution of chromosomal polymorphisms to the G-matrix of Mimulus guttatus. New Phytol. 2009;183:803–815. doi: 10.1111/j.1469-8137.2009.02947.x. [DOI] [PMC free article] [PubMed] [Google Scholar]
- Self SG, Liang KY. Asymptotic properties of maximum likelihood estimators and likelihood ratio tests under nonstandard conditions. J Am Stat Assoc. 1987;82:605–610. [Google Scholar]
- Stebbins GL. Self-fertilization and population variability in higher plants. Am Nat. 1957;91:337–354. [Google Scholar]
- Sweigart A, Karoly K, Jones A, Willis JH. The distribution of individual inbreeding coefficients and pairwise relatedness in a population of Mimulus guttatus. Heredity. 1999;83:625–632. doi: 10.1038/sj.hdy.6886020. [DOI] [PubMed] [Google Scholar]
- Sweigart AL, Willis JH. Patterns of nucleotide diversity are affected by mating system and asymmetric introgression in two species of Mimulus. Evolution. 2003;57:2490–2506. doi: 10.1111/j.0014-3820.2003.tb01494.x. [DOI] [PubMed] [Google Scholar]
- Thorp RW, Horning DS, Jr, Dunning LL. Bumble bees and cuckoo bumble bees of California. Bull Cal Insect Sur. 1983;23:1–79. [Google Scholar]
- USDA-ARS. U S National Pollinating Insects Database, United States Department of Agriculture, Agriculture Research Service. Bee Biology and Systematics Laboratory; Logan, Utah: 2006. [Google Scholar]
- Uyenoyama MK, Holsinger KE, Waller DM. Ecological and genetic factors directing the evolution of self-fertilization. Oxf Surv Evol Biol. 1993;9:327–381. [Google Scholar]
- van Kleunen M, Ritland K. Predicting the evolution of floral traits associated with mating system in a natural plant population. J Evol Biol. 2004;17:1389–1399. doi: 10.1111/j.1420-9101.2004.00787.x. [DOI] [PubMed] [Google Scholar]
- Vickery RK. Case studies in the evolution of species complexes in Mimulus. Evol Biol. 1978;11:405–507. [Google Scholar]
- Wang J. COANCESTRY: a program for simulating, estimating and analysing relatedness and inbreeding coefficients. Mol Ecol Res. 2011;11:141–145. doi: 10.1111/j.1755-0998.2010.02885.x. [DOI] [PubMed] [Google Scholar]
- Willis JH. Partial self fertilization and inbreeding depression in two populations of Mimulus guttatus. Heredity. 1993;71:145–154. [Google Scholar]
- Willis JH. Measures of phenotypic selection are biased by partial inbreeding. Evolution. 1996;50:1501–1511. doi: 10.1111/j.1558-5646.1996.tb03923.x. [DOI] [PubMed] [Google Scholar]
- Willis JH. Inbreeding load, average dominance, and the mutation rate for mildly deleterious alleles in Mimulus guttatus. Genetics. 1999a;153:1885–1898. doi: 10.1093/genetics/153.4.1885. [DOI] [PMC free article] [PubMed] [Google Scholar]
- Willis JH. The role of genes of large effect on inbreeding depression in Mimulus guttatus. Evolution. 1999b;53:1678–1691. doi: 10.1111/j.1558-5646.1999.tb04553.x. [DOI] [PubMed] [Google Scholar]
- Wu CA, Lowry DB, Cooley AM, Wright KM, Lee YW, Willis JH. Mimulus is an emerging model system for the integration of ecological and genomic studies. Heredity. 2008;100:220–230. doi: 10.1038/sj.hdy.6801018. [DOI] [PubMed] [Google Scholar]
Associated Data
This section collects any data citations, data availability statements, or supplementary materials included in this article.
Supplementary Materials
Table S1. Least squares means and standard deviations are reported for each measured trait of Generation 6.
Table S2. Least squares means and standard deviations for each measured trait of Generation 7.
Table S3. Neutral marker data for genotyped individuals of Generation 6.
Table S4. The effect of chromosomal polymorphisms on traits in Source plants of Generation 6.