Abstract
Multiple populations of wake-promoting neurons have been characterized in mammals, but few sleep-promoting neurons have been identified1. Wake-promoting cell types include hypocretin and GABA (γ-aminobutyric-acid)-releasing neurons of the lateral hypothalamus, which promote the transition to wakefulness from non-rapid eye movement (NREM) and rapid eye movement (REM) sleep2,3. Here we show that a subset of GABAergic neurons in the mouse ventral zona incerta, which express the LIM homeodomain factor Lhx6 and are activated by sleep pressure, both directly inhibit wake-active hypocretin and GABAergic cells in the lateral hypothalamus and receive inputs from multiple sleep–wake-regulating neurons. Conditional deletion of Lhx6 from the developing diencephalon leads to decreases in both NREM and REM sleep. Furthermore, selective activation and inhibition of Lhx6-positive neurons in the ventral zona incerta bidirectionally regulate sleep time in adult mice, in part through hypocretin-dependent mechanisms. These studies identify a GABAergic subpopulation of neurons in the ventral zona incerta that promote sleep.
Sleep–wake transitions are rapid, bistable and controlled by a distributed network of sleep- and wake-promoting neurons3. The lateral hypothalamus contains several subtypes of wake-promoting neurons, including glutamatergic hypocretin (Hcrt)-expressing neurons and GABAergic neurons2,3. Multiple inhibitory neuronal subtypes innervate Hcrt+ lateral hypothalamus neurons4, but their roles in regulating sleep remain unclear. The zona incerta, which is adjacent to the lateral hypothalamus, regulates sensory–motor integration and sends efferent projections to multiple brain regions5. Stimulation of thalamic afferents to the zona incerta can induce a sleep-like state6. Although bilateral ablation of the zona incerta does not affect sleep7, the role of individual zona incerta cell types in controlling sleep is unknown.
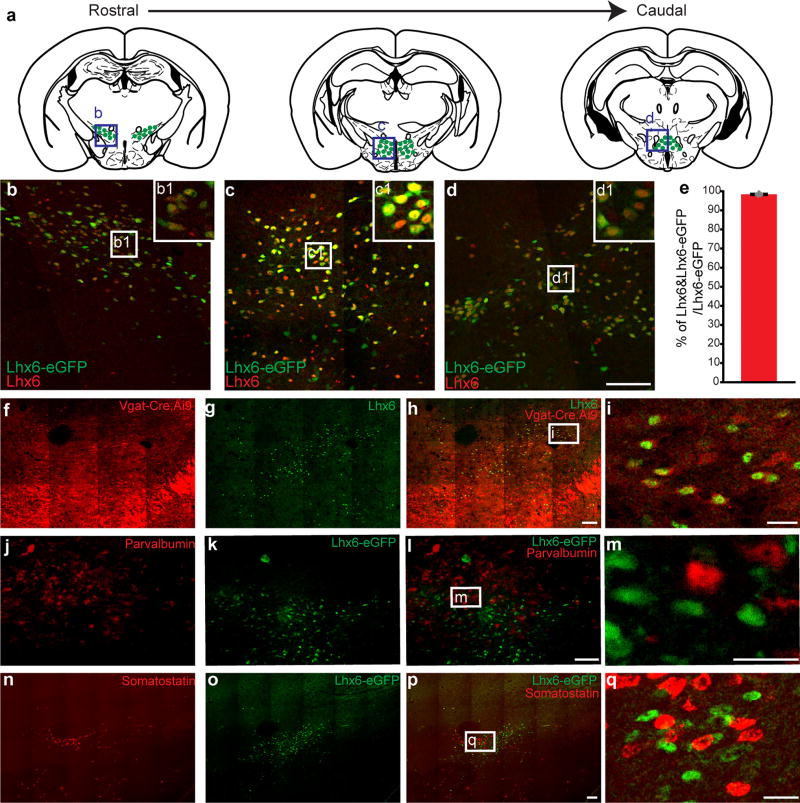
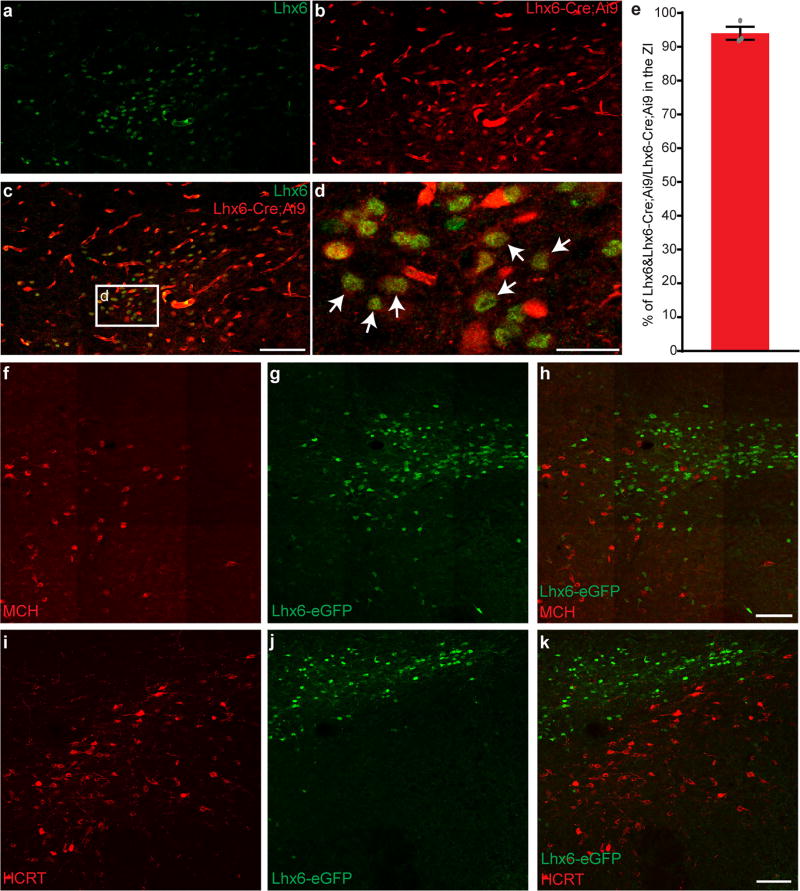
We previously observed Lhx6 expression in a subset of GABAergic neuronal precursors in the developing mouse hypothalamus from embryonic day (E) 11.5 onwards8. We identified an eGFP transgenic line9 that recapitulated native expression of Lhx6 in the brain (98% of eGFP+ cells are Lhx6+; Extended Data Fig. 1a–e). In diencephalon, Lhx6 was expressed in a zone extending from the ventral zona incerta (VZI), through the dorsomedial hypothalamic nucleus and lateral hypothalamus, to the posterior hypothalamus8 (Fig. 1a, b and Extended Data Fig. 1a–d). To study these cells, we used Lhx6-cre transgenic mice10, which showed co-expression of Lhx6 protein and tdTomato when crossed with the Ai9 reporter (Extended Data Fig. 2a–e).
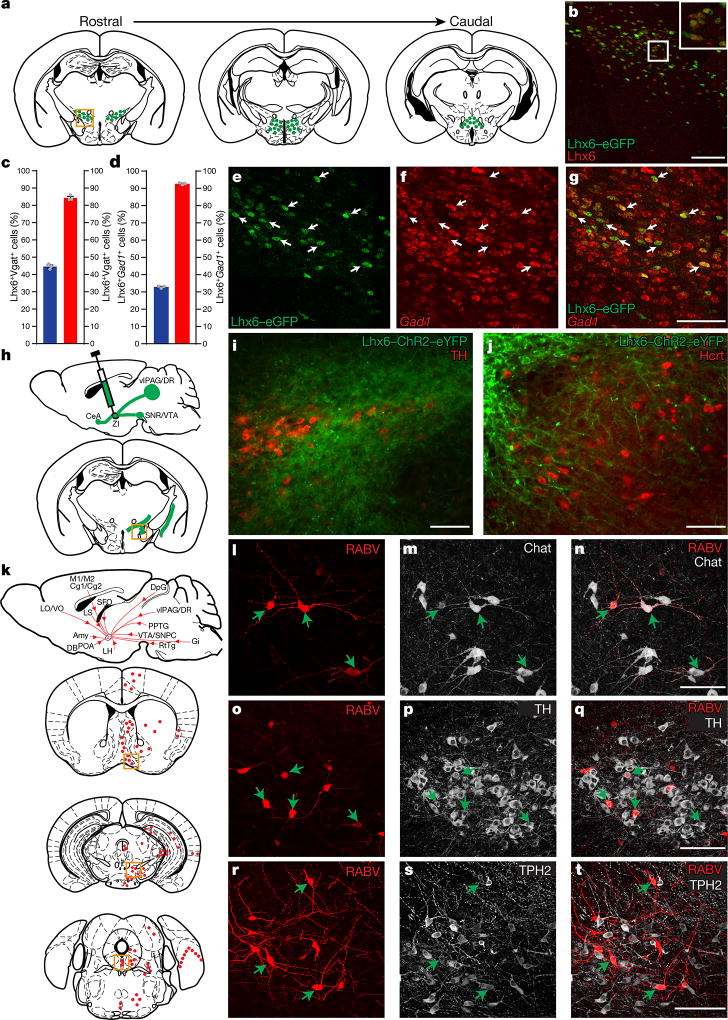
Figure 1. Lhx6+ neurons in the VZI are GABAergic, receive synaptic inputs from sleep-regulating regions, and project to Hcrt+ neurons in the lateral hypothalamus.
a, Distribution of Lhx6+ neurons in the hypothalamus. Box indicates the location of Lhx6+ neurons (green) in the VZI in b. b, Co-expression of eGFP (green) in the Lhx6–eGFP line with Lhx6 (red) in the VZI. Inset, magnification of the boxed area. c, The percentage of Lhx6+tdTomato+ cells (blue) in the VZI relative to all tdTomato+ cells in the VZI in Slc32a1-cre;Ai9 mice. The percentage of Lhx6+tdTomato+ neurons (red) relative to all Lhx6+ neurons in the VZI in Slc32a1-cre;Ai9 mice. n = 3 mice, eight sections per group. d, The percentage of Lhx6+Gad1+ cells (blue) relative to all Gad1+ neurons in the VZI. The percentage of Lhx6+Gad1+ cells (red) relative to all Lhx6+ cells in the VZI. n = 3 mice, six sections per group. Data are mean ± s.e.m. (c, d). e–g, Co-localization of Lhx6–eGFP (e, green) with Gad1 mRNA (f, red) in the VZI. Merged image is shown in g. h, ChR2–eYFP virus injection site in the zona incerta of the Lhx6-cre line. i, j, Distribution of ChR2–eYFP-infected Lhx6+ neurons (green) in the zona incerta (i) and projections of Lhx6+ neurons in the lateral hypothalamus (j). Tyrosine hydroxylase (TH) (i, red), and Hcrt (j, red) are shown. k, Rabies virus (RABV) injection site in the zona incerta of Lhx6-cre, and the distribution of neurons presynaptic to Lhx6+ VZI cells. l–n, RABV+ cells in the nucleus of the diagonal band (l, red) stained with anti-Chat (m, grey). Merged image is shown in n. o–q, RABV+ cells in the ventral tegmental area (o, red) stained with anti-tyrosine hydroxylase (p, grey). Merged image is shown in q. r–t, RABV+ cells in the dorsal raphe nucleus (r, red) stained with anti-TPH2 (s, grey). Merged image is shown in t. Scale bars, 100 µm. Arrows show cells co-expressing relevant markers. Amy, amygdala; CeA, central nucleus of the amygdala; Cg1/Cg2, cingulate cortex; DB, diagonal band; DpG, motor-related nuclei of superior colliculus; Gi, midline gigantocellular nucleus of the medulla; LH, lateral hypothalamus; LO/VO, lateral/ventral orbital cortex; LS, lateral septum; M1/M2, frontal/secondary motor cortex; POA, preoptic area; PPTG, pedunculopontine tegmental nucleus; RtTg, midbrain reticular formation; SFO, subfornical organ; SNR/VTA, substantia nigra reticular part/ventral tegmental area; vlPAG/DR, ventrolateral periaqueductal grey/dorsal raphe nucleus; VTA/SNPC, ventral tegmental area/substantia nigra pars compact; ZI, zona incerta.
Hypothalamic Lhx6+ cells express markers of GABAergic neurons, including Gad1 and Slc32a1 (Fig. 1e–g and Extended Data Fig. 1f–i). Although Lhx6 is expressed in parvalbumin-positive (Pvalb+) and somatostatin-positive (Sst+) cortical interneurons, and is necessary for their differentiation11, we observed no colocalization of Lhx6 with either Pvalb or Sst in the zona incerta or lateral hypothalamus (Extended Data Fig. 1j–q). Additionally, Lhx6+ cells in the lateral hypothalamus expressed neither Hcrt nor the sleep-promoting neuropeptide melanin-concentrating hormone (MCH)1 (Extended Data Fig. 2f–k).
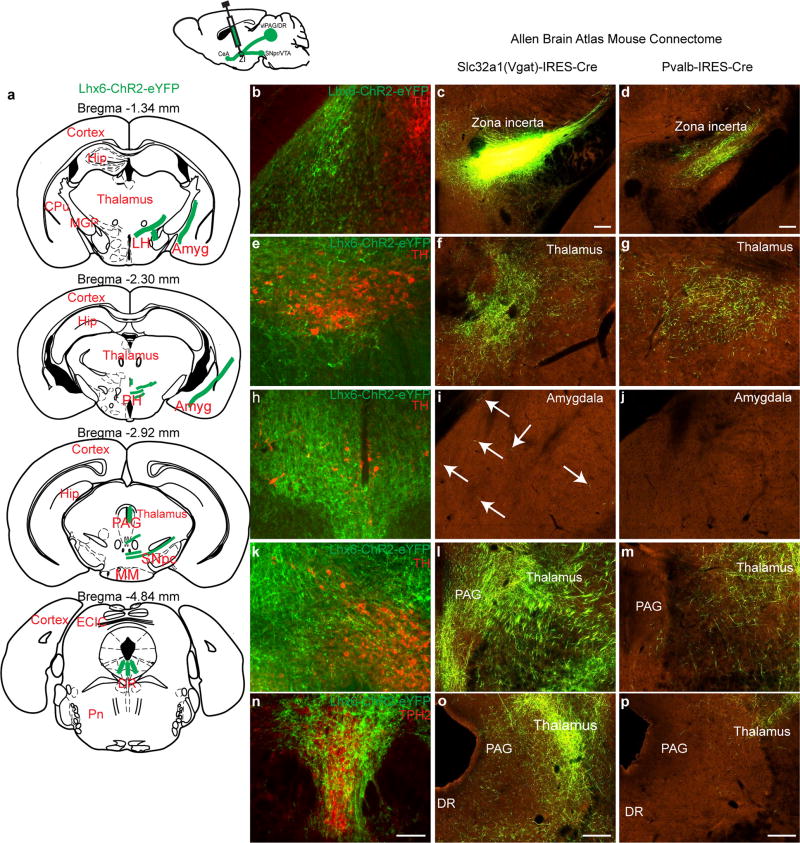
Lhx6+ cells represent 45% and 33% of all Slc32a1+ and Gad1+ cells in the VZI (Fig. 1c, d). Following AAV9-DIO-ChR2–eYFP virus injections into the zona incerta of Lhx6-creERT2 knock-in mice12 (Fig. 1h), we observed local projections within the zona incerta and to Hcrt+ neurons in the lateral hypothalamus (Fig. 1i, j). Projections to monoaminergic midbrain populations were seen, including to the substantia nigra, the ventral tegmental area and the dorsal raphe nucleus, as well as to the ventrolateral periaqueductal grey and the central amygdala (Extended Data Fig. 3b, e, h, k, n). These overlap with known projections of GABAergic neurons of the zona incerta13 (Extended Data Fig. 3c, f, i, l, o), but differ in that no projections from Lhx6 neurons of the zona incerta to the thalamus—the main target of Pvalb+ GABAergic neurons of the zona incerta—were seen (Extended Data Fig. 3d, g, j, m, p).
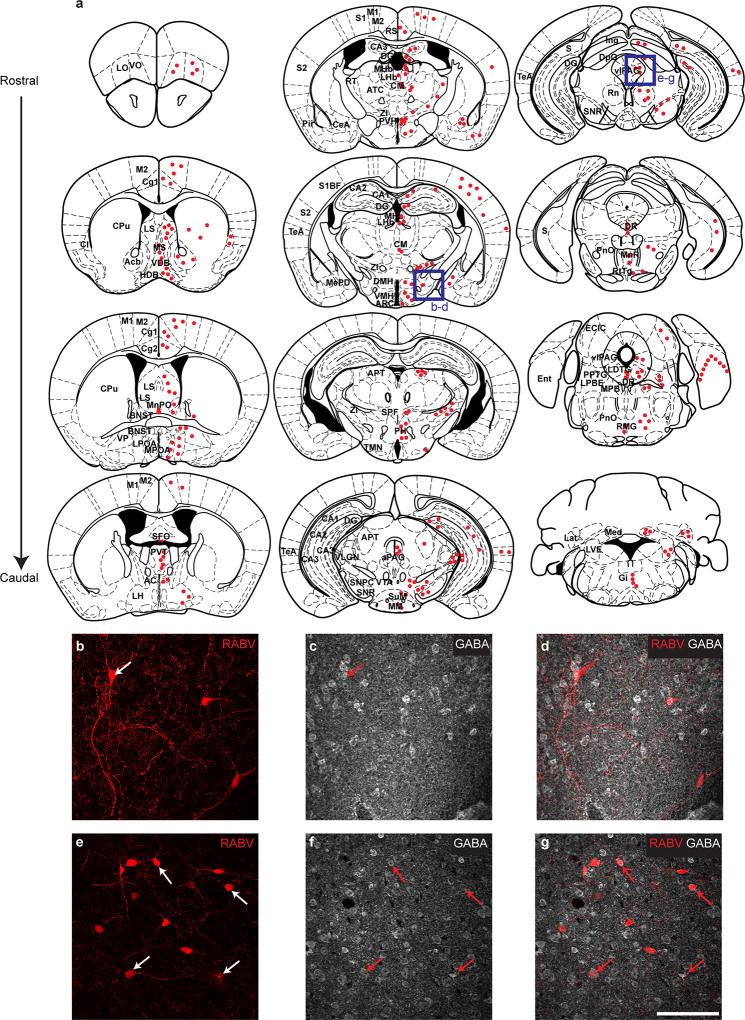
To map inputs to Lhx6+ VZI neurons, we conducted retrograde monosynaptic tracing using rabies virus14, and observed labelling in many brain regions, including reciprocal connections between all regions innervated by Lhx6+ VZI neurons, along with other regions that control sleep. Lhx6+ VZI neurons appear to receive inputs from wake-active and REM-inhibiting neurons, including dopaminergic neurons of the ventral tegmental area, serotoninergic neurons of the dorsal raphe nucleus, and GABAergic neurons of both the ventrolateral periaqueductal grey and lateral hypothalamus1,3,15 (Fig. 1k, o–t and Extended Data Fig. 4). Lhx6+ VZI neurons also receive projections from REM-promoting cholinergic neurons of the basal forebrain and pedunculopontine nucleus1,3 (Fig. 1l–n and Extended Data Fig. 4). Finally, we observed inputs from other regions that have not previously been implicated in sleep regulation (Extended Data Fig. 4).
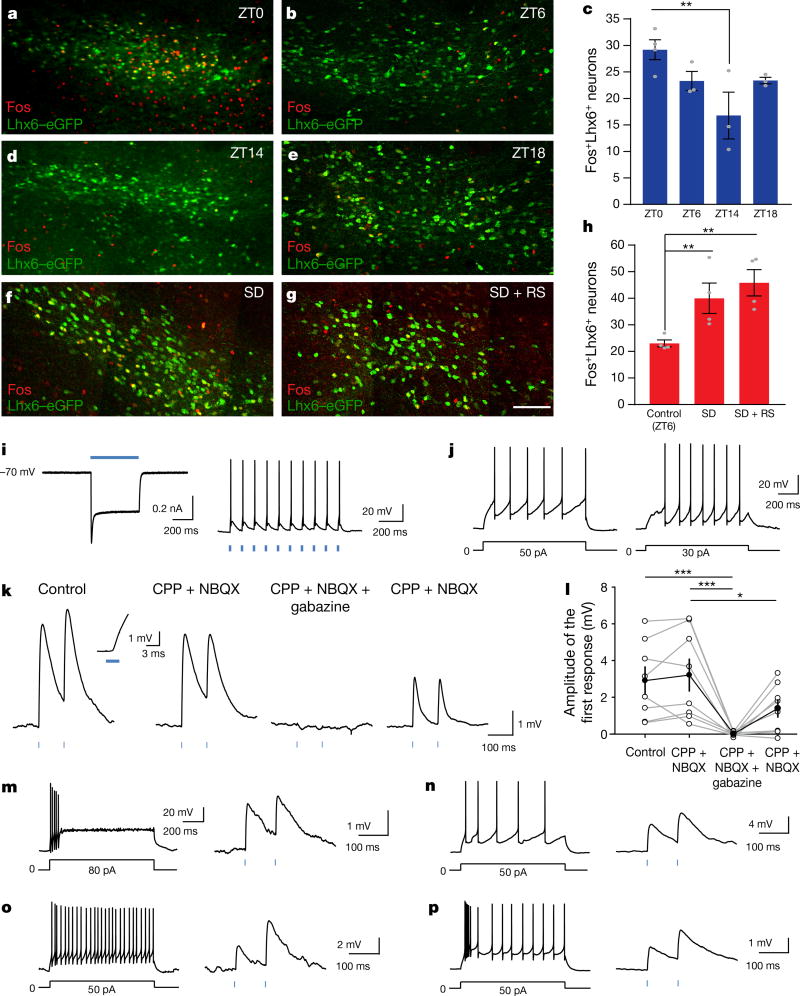
We next tested whether Lhx6+ VZI neurons were activated during sleep. We observed higher Fos expression at lights on, when sleep pressure is highest, relative to lights off, when sleep pressure is lowest16 (Fig. 2a–e). We then showed that 6-h sleep deprivation from zeitgeber time (ZT)0 (lights on) to ZT6—either alone or in combination with 1 h of recovery sleep from ZT6 to ZT7—increased Fos expression in Lhx6+ VZI neurons (Fig. 2f–h), demonstrating that Lhx6+ VZI neurons are activated by high sleep pressure.
Figure 2. Lhx6+ VZI neurons are activated by sleep pressure and are presynaptic to Hcrt+ and GABAergic neurons in the lateral hypothalamus.
a, b, d–g, Representative images of Fos immunostaining (red) and Lhx6–eGFP expression (green) in VZI for ZT0 (a), ZT6 (b), ZT14 (d), ZT18 (e), following sleep deprivation (SD) (f) and sleep deprivation paired with recovery sleep (RS) (g). Scale bar, 100 µm. c, h, The percentage of Fos+Lhx6+ neurons in the zona incerta across ZT (c) and under sleep pressure (h). **P < 0.01; linear mixed-effect model fit by REML (h), two-tailed one-way ANOVA (c). n = 4 mice per group, four brain sections analysed bilaterally per mouse. i, Average response to photostimulation (500 ms) of a ChR2-expressing Lhx6+ VZI neuron (left; voltage-clamp) and action potentials elicited by photostimulation (3 ms, 10 Hz) from the same neuron (right; current-clamp). j, Responses of two Hcrt+ neurons to depolarizing current steps. k, Postsynaptic responses from a Hcrt+ neuron following photostimulation of ChR2+Lhx6+ neurons under control conditions (left), with glutamate receptor blockers NBQX (2,3-dioxo-6-nitro-1,2,3,4-tetrahydrobenzo[f]quinoxaline-7-sulfonamide disodium salt) and CPP ((RS)-3-(2-carboxypiperazin-4-yl)-propyl-1-phosphonic acid) (CPP + NBQX; middle), CPP, NBQX and the GABAA receptor antagonist gabazine (6-imino-3-(4-methoxyphenyl)-1(6H)-pyridazinebutanoic acid hydrobromide) (CPP + NBQX + gabazine; right) and after gabazine washout (far-right). Inset shows the onset of the postsynaptic response shown at an expanded timescale for the control. l, Amplitudes of the first postsynaptic response to photostimulation in control conditions, with NBQX and CPP, with NBQX, CPP and gabazine, and after gabazine washout. Two-way ANOVA with Bonferroni correction; control versus CPP + NBQX, P = 1; CPP + NBQX versus CPP + NBQX + gabazine, ***P = 0.00024; control versus CPP + NBQX + gabazine, ***P = 0.00077; CPP + NBQX versus CPP + NBQX + gabazine washout, *P = 0.0478; n = 8 Hcrt neurons from four mice. m–p, Responses to depolarizing current steps (left) and average short-latency postsynaptic potentials (right) in Gad2+ neurons following photostimulation of ChR2+Lhx6+ neurons. Data are mean ± s.e.m. (c, h, l).
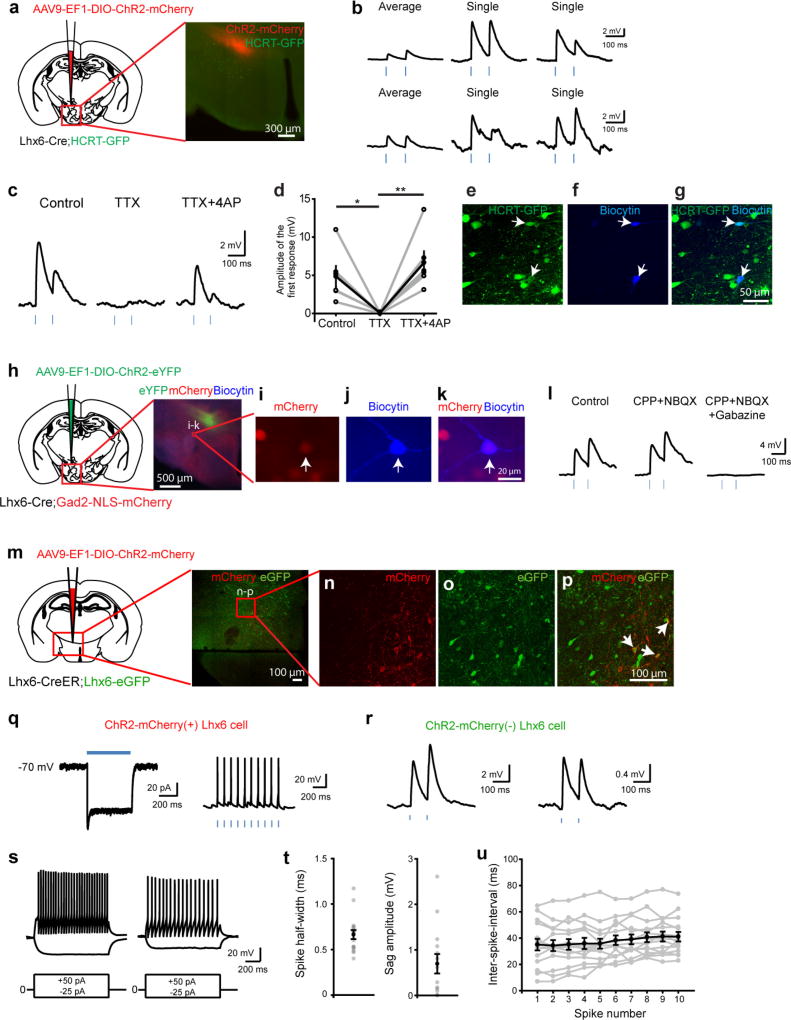
To test whether Lhx6+ VZI neurons directly inhibit wake-promoting Hcrt+ neurons in the lateral hypothalamus, we performed whole-cell patch-clamp recordings in brain slices from Lhx6-cre;Hcrt–eGFP mice17 infected with AAV9-DIO-ChR2–mCherry (Extended Data Fig. 5a). mCherry+ neurons fired action potentials in current-clamp mode following photostimulation (Fig. 2i). Photostimulation of Lhx6+ VZI neurons induced short-latency postsynaptic responses (1.82 ± 0.22 ms; n = 21) in Hcrt–eGFP+ neurons recorded using high-chloride internal solution (Fig. 2j, k and Extended Data Fig. 5b, e–g). These responses were unaffected by ionotropic glutamate receptor antagonists, and eliminated by the GABAA receptor antagonist gabazine (Fig. 2k, l). Responses recorded with co-application of the potassium channel blocker 4-AP and tetrodotoxin18 indicate that Lhx6+ VZI neurons form monosynaptic connections onto Hcrt–eGFP+ neurons (Extended Data Fig. 5c, d).
We also tested whether Lhx6+ VZI neurons inhibited wake-promoting GABAergic neurons in the lateral hypothalamus15, using Lhx6-cre;Gad2-NLS–mCherry mice and the approach described above. The Gad2–mCherry+ cells showed a range of firing patterns following current steps, as described19 (Fig. 2m–p). Gad2–mCherry+ neurons in the lateral hypothalamus exhibited short-latency postsynaptic responses following photostimulation of Lhx6+ VZI neurons, which were eliminated by gabazine, similar to Hcrt+ neurons (1.83 ± 0.19 ms, n = 10; Fig. 2m–p and Extended Data Fig. 5h–l).
Reciprocal connections among GABAergic neurons can facilitate transitions between bistable activity states, including sleep–wake transitions3,20,21. We tested whether Lhx6+ VZI GABAergic neurons were interconnected, using Lhx6-creERT2;Lhx6–eGFP mice and the approaches described above (Extended Data Fig. 5m–u). We observed short-latency postsynaptic potentials in a subset of Lhx6+ cells, indicating interconnectivity (Extended Data Fig. 5q, r).
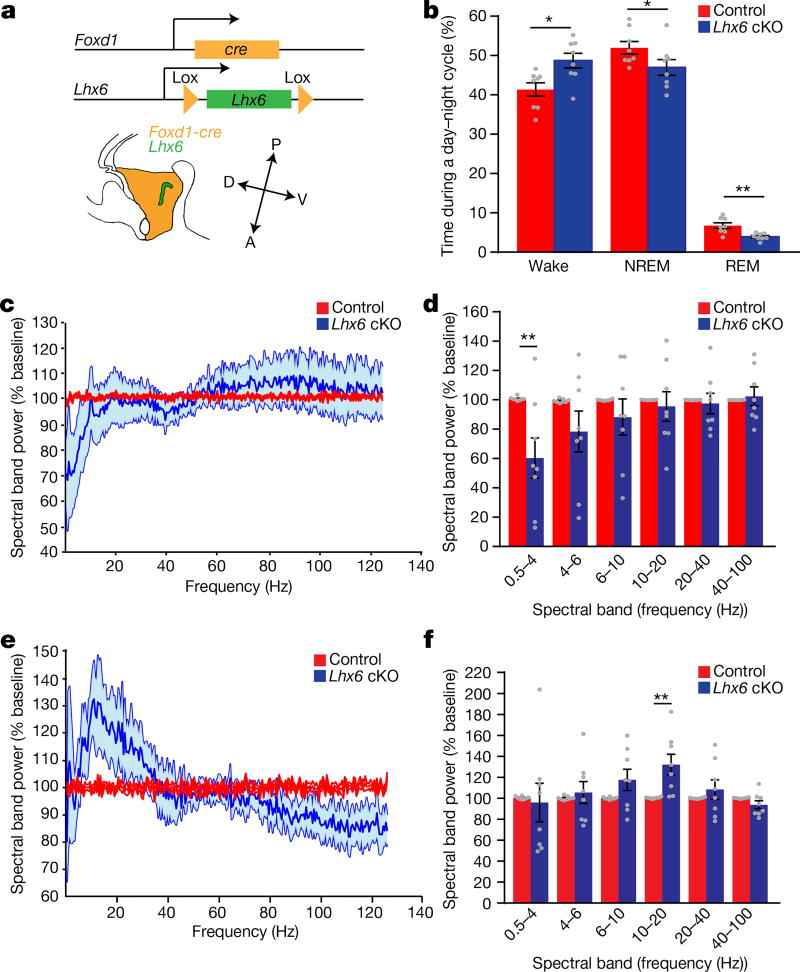
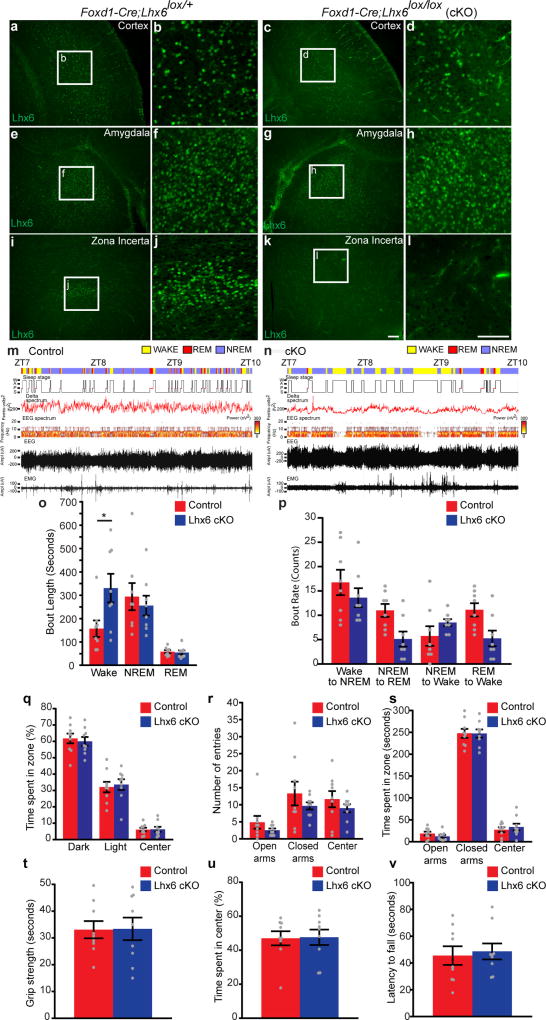
We next selectively deleted Lhx6 in diencephalon22 (Fig. 3a). Foxd1-cre; Lhx6lox/lox mice show loss of Lhx6 immunostaining in the hypothalamus, but not in the telencephalon (Extended Data Fig. 6a–l). Foxd1-cre;Lhx6lox/lox mice show no gross behavioural abnormalities (Extended Data Fig. 6q–v). However, electroencephalogram (EEG) and electromyography (EMG) data from Foxd1-cre;Lhx6lox/lox mice revealed an increase in wake time, and a reduction in NREM and REM sleep, relative to controls (Fig. 3b). Spectral analysis of EEGs from Foxd1-cre;Lhx6lox/lox mice showed a reduction in delta waves during NREM sleep (Fig. 3c, d) and an increase in alpha waves during wake (Fig. 3e, f). The relative decrease of REM sleep was greater than that of NREM sleep. Further analysis revealed an increase in wake bout length in Foxd1-cre;Lhx6lox/lox mice (Extended Data Fig. 6o, p). This shows that selective deletion of Lhx6 from the diencephalon resulted in decreased sleep.
Figure 3. Selective loss of Lhx6 expression in the diencephalon reduces both NREM and REM sleep.
a, Generation of diencephalic-specific Lhx6 conditional knockout (cKO) line by crossing Foxd1-cre and Lhx6lox/lox lines. A, anterior, D, dorsal, P, posterior, V, ventral. b, EEG/EMG analysis showing the percentage of the day–night cycle spent awake and in NREM and REM sleep in control (Foxd1-cre;Lhx6lox/+) and cKO groups. c, Fast Fourier transform (FFT) analysis of EEG power spectrum during NREM sleep of cKO (blue) compared to control (red) mice. d, The collapsed EEG frequency data are shown for control (red) and cKO (blue) mice. e, FFT analysis of EEG power spectrum frequency in cKO mice (blue) compared to controls (red). f, The collapsed EEG frequency data are shown for control (red) and cKO (blue) mice. n = 8 control and 8 cKO mice for all experiments. Data are mean ± s.e.m. *P < 0.05, **P < 0.01; two-way ANOVA followed by Sidak’s post hoc test.
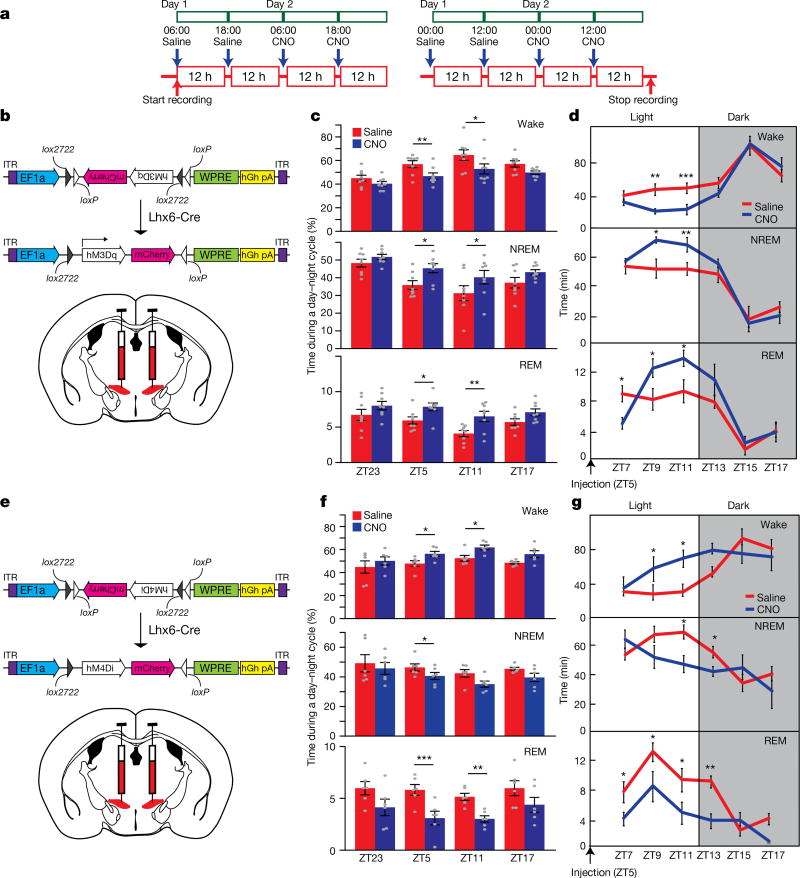
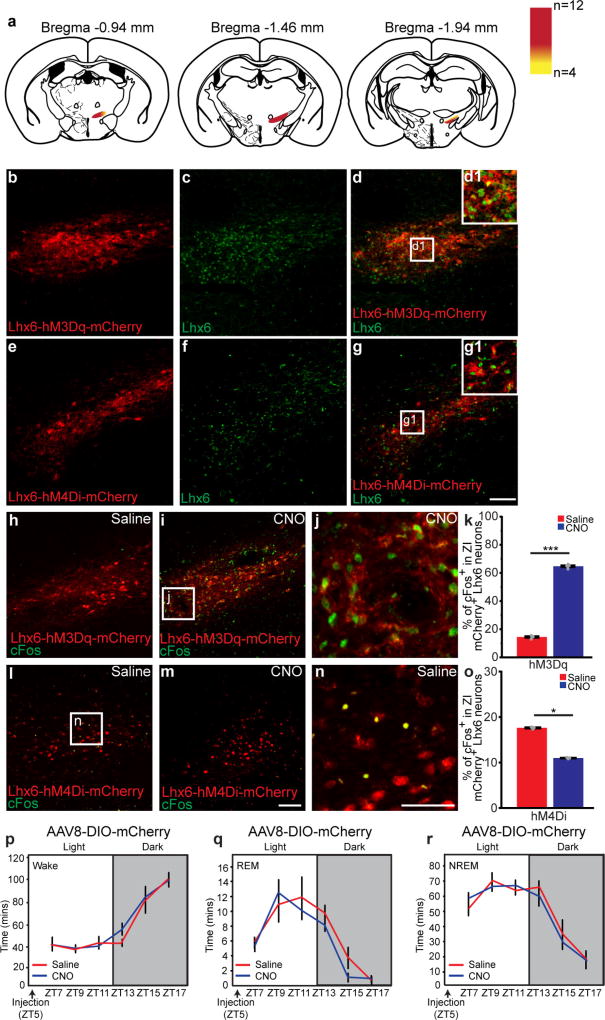
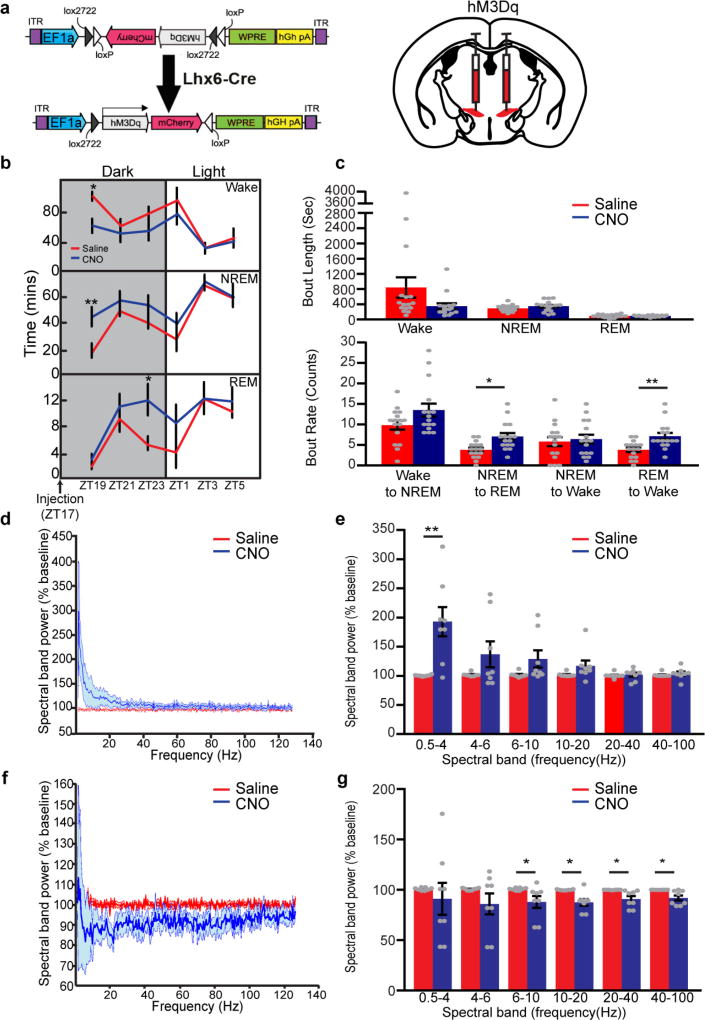
Using DREADD (designer receptors exclusively activated by designer drugs)-based chemogenetic analysis23, we next tested whether activation and inhibition of Lhx6+ VZI neurons modulated sleep. In Lhx6-cre mice infected bilaterally with Gq-coupled DREADDs, clozapine N-oxide (CNO) induced Fos expression in zona incerta cells (Fig. 4a, b and Extended Data Fig. 7h–k), and did not affect sleep in mice expressing mCherry in Lhx6+ VZI neurons (Extended Data Fig. 7p–r). We next tested whether activation of Lhx6+ VZI neurons induced sleep. We observed an increase in REM sleep during the 12 h following CNO injection at all times except ZT23, when sleep pressure is highest. Decreases in wake, and increases in NREM sleep, were observed following CNO administration at ZT5 and ZT11 (Fig. 4c, d and Extended Data Fig. 8). These effects were strongest between 2 and 8 h following CNO administration, and were gone after 12 h. CNO injection at ZT5 increased delta waves during NREM sleep and decreased theta and gamma waves during wake (Extended Data Fig. 8). Selective transduction of Lhx6+ VZI neurons was confirmed by postmortem examination (Extended Data Fig. 7a–g).
Figure 4. DREADD-dependent activation or inhibition of Lhx6+ neurons in the zona incerta regulates NREM and REM sleep.
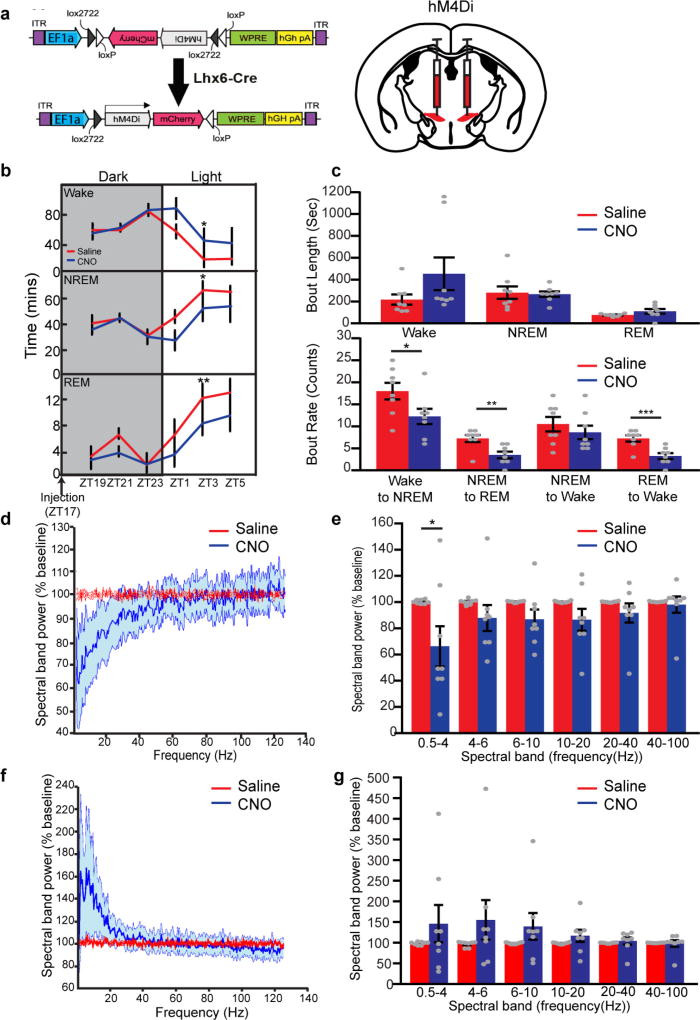
a, Schematic showing sleep recording conditions with saline- or CNO-injection in hM3Dq-infected (left, b–d) or hM4Di-infected (right, e–g) mice. b, hM3Dq–mCherry viral construct and injection site in Lhx6-cre mice. c, Percentage of time spent during the 12 h after injection in wake (top), NREM sleep (middle) and REM sleep (bottom) in saline- or CNO-injection in hM3Dq groups. d, Percentage of time spent in wake (top), NREM sleep (middle) and REM sleep (bottom) in 2-h bins following injection of saline or CNO at ZT5 in hM3Dq mice. e, hM4Di–mCherry viral construct and injection site in Lhx6-cre mice. f, Percentage of time spent during the 12 h after injection in wake (top), NREM sleep (middle) and REM sleep (bottom) in saline- or CNO-injection in hM4Di mice. g, Percentage of time in wake (top), NREM sleep (middle) and REM sleep (bottom) in 2-h bins following injection of saline or CNO at ZT5 in hM4Di mice. *P < 0.05, **P < 0.01, ***P < 0.001; two-way ANOVA followed by Sidak’s post hoc test. n = 8 mice for all experiments. Data are mean ± s.e.m.
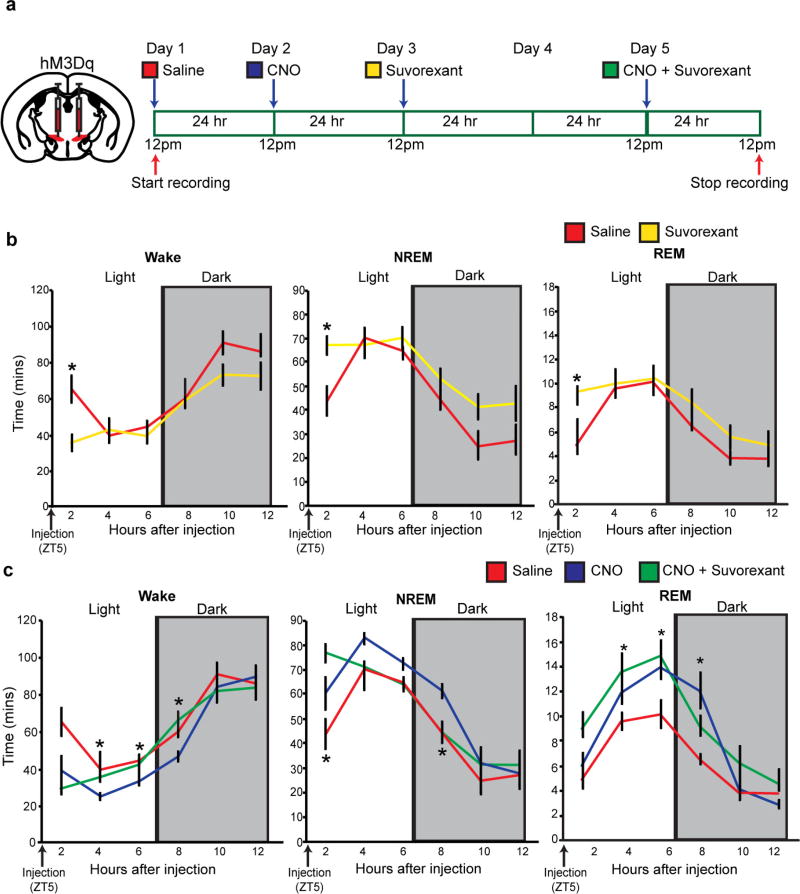
To determine whether activation of Lhx6+ VZI neurons promotes sleep by inhibiting Hcrt+ neurons, we performed a pharmacological occlusion experiment, where we activated Lhx6+ zona incerta neurons while applying the dual hypocretin receptor antagonist suvorexant24. As reported, suvorexant rapidly increased both NREM and REM sleep, but these effects were lost by 4 h (Extended Data Fig. 9). Combining CNO and suvorexant resulted in levels of wake and of NREM sleep, but not of REM sleep, indistinguishable from those seen with suvorexant alone, indicating that Lhx6+ zona incerta neurons control Hcrt release to promote NREM, but not REM, sleep.
Finally, we show that inhibition of Lhx6+ VZI neurons with Gi-coupled DREADDs reduced sleep (Fig. 4a, e–g and Extended Data Fig. 10). CNO administration at ZT5 and ZT11 reduced time spent in REM sleep. A decrease in time spent in NREM sleep, and corresponding increase in time awake, were also observed following CNO administration at ZT5 (Fig. 4f), along with a decrease in delta waves during NREM sleep (Extended Data Fig. 10). CNO administered at ZT5 inhibited NREM and REM sleep, and increased wake, for up to 8 h following injection (Fig. 4g). No significant change was seen in total time spent in wake, NREM or REM sleep in the 12 h following CNO injection in the middle or the end of the dark phase at ZT17 and ZT23 (Extended Data Fig. 10). When data were examined in two-hour bins, decreases in NREM and REM sleep, and a corresponding increase in wake, were observed 8–10 h following CNO administration. These decreases occurred during the beginning of the light phase (Extended Data Fig. 10), suggesting that the sleep-inhibiting effects of Lhx6+ VZI neurons are confined to the normal sleep time of mice (light phase) (Fig. 2h).
In this study, we identify GABAergic Lhx6+ VZI neurons as a subpopulation of sleep-promoting neurons. These join a handful of other GABAergic sleep-promoting neuronal populations, including cells in the ventrolateral preoptic area and the parafacial zone of the medulla25–27. Lhx6+ VZI neurons differ from these sleep-promoting cells in that they promote both NREM and REM sleep, rather than either alone. They also exhibit a relatively slow-onset but long-lasting regulation of sleep, which may be related to their interconnectivity, a property that they share with other GABAergic zona incerta neurons28. Lhx6+ VZI neurons receive inputs from multiple different subtypes of sleep-regulating neurons, and are directly presynaptic to wake-promoting GABAergic and Hcrt+ neurons of the lateral hypothalamus and inhibit their activity, with this latter function being essential for their promotion of NREM sleep. Since complete ablation of the zona incerta does not induce changes in sleep–wake cycles7, and global activation of GABAergic neurons in the zona incerta does not affect sleep15, these findings imply that other wake-promoting GABAergic subpopulations exist in the zona incerta.
Methods
Mice
All experimental animal procedures were approved by the Johns Hopkins University Institutional Animal Care and Use Committee. The BAC transgenic Lhx6–eGFP mouse line was generated as part of the GENSAT project9 and obtained from the MMRRC (stock number: 000246). Hcrt–eGFP transgenic mice were obtained from L. de Lecea (Stanford University School of Medicine)17. Lhx6-cre mice were shared by A. Gittis (Carnegie Mellon University) and were originally generated by N. Kessaris (University College London)10. Lhx6-creERT2 knock-in mice were generated by Z. J. Huang (Cold Spring Harbour Laboratories)12 and were purchased from The Jackson Laboratory (stock number: 010776). Foxd1-cre–eGFP knock-in mice29 (stock number: 012463) and Gad2-T2a-NLS–mCherry mice30 (stock number: 023140) were obtained from The Jackson Laboratory.
The conditional Lhx6 allele was generated through homologous recombination using a targeting construct in which loxP sites were placed in non-coding regions that are 5′ to coding exon 1b and 3′ to coding exon 3. The 5′ homology consists of a 3.1-kb XbaI–SacI fragment containing the 5′ upstream region and the first exon (1a) of Lhx6, whereas the 3′ homology consists of a 5.4-kb ApaI–NheI fragment. For the Lhx6-targeting vector, the 2-kb genomic fragment between the homology regions is replaced by a 4-kb cassette, containing the following: (1) the 1b, 2 and 3 coding exons flanked by loxP sites; (2) the neomycin-resistance gene under the control of the phosphoglycerate kinase (PGK) promoter (PGK-Neo) flanked by FRT sites. Targeting constructs were linearized and electroporated into E14Tg2A embryonic stem cells. Targeted clones were identified and analysed in detail by Southern blotting using 5′ and 3′ external probes. Germline transmission of the mutant alleles was achieved using standard protocols. The phenotypic analysis presented was performed on mice from which the PGK-Neo cassette was removed by crossing founder Lhx6lox/lox mice with the Actb::FlPe transgenic line31. For the maintenance of the Lhx6lox/lox colony, we performed PCR using the following primers: Lhx6flR: GGAGGCCCAAAGTTAGAACC Lhx6flF: CTCGAGTGCTCCGTGTGTC.
Behavioural analysis of Foxd1-cre;Lhx6lox/lox mice
We conducted several behavioural tests to investigate the phenotype of Foxd1-cre;Lhx6lox/lox mice (Extended Data Fig. 6).
Light–dark preference test
Each mouse was placed in an apparatus consisting of a dark chamber and a light-illuminated chamber. Mice could move freely between the two chambers. The duration each mouse spent in the dark chamber, light chamber or centre was measured and normalized relative to the entire experimental period.
Elevated plus maze (EPM)
Each mouse was placed in the centre of the EPM and videotaped for 5 min. The time spent in the open and closed arms was determined from the video recording by blinded observers.
Open field test
Mice were placed in the open field chamber and time spent in the centre and periphery was assessed for 30 min, using a Photobeam activity system to measure beam breaks.
Rotarod
Up to four mice were tested at one time on a rotating rod with the capacity to gradually accelerate up to 99.9 revolutions per minute (r.p.m.). A photobeam activity system was used to record when the mouse dropped off of the rod as the rotation speed gradually increased. The average terminal rotation speed and time spent on the Rotarod was used for analysis.
Grip strength
Forelimb grip strength was measured as tension force using a computerized grip strength meter (GSM). Mice were lifted over the baseplate by their tails, and their forepaws allowed to grasp the steel grip. The tail of each mouse was then placed in the centre of the Single Axis Grip Strength Alignment Tool (SAGSAT) and the mouse was then gently pulled backward by the tail until its grip was released. The GSM was then used to measure the maximal force before the mouse released the bar. Three trials were performed for each mouse with a 1-min resting period between trials.
Fos analysis
To characterize zona incerta Lhx6 neurons activated under different lighting conditions, adult Lhx6–eGFP mice (2–4 months old) were deeply anaesthetized with ketamine at four time points across the light–dark cycle: 07:00 (ZT0); 13:00 (ZT6); 21:00 (ZT14, lights off); 01:00 (ZT18). For the 07:00 time point, mice were anaesthetized a few minutes before lights on with minimal light exposure. All other mice were anaesthetized within 15 min of their time-point group. Immediately after anaesthesia, mice were transcardially perfused with 20 ml 1× phosphate-buffered saline (PBS) followed by 4% paraformaldehyde (PFA) (m/v) in 1× PBS. For analysis of Fos expression during sleep deprivation, adult Lhx6–eGFP mice (2–4 months old) were sleep-deprived starting at 07:00 (ZT0) until 13:00 for a total of 6 h. To facilitate sleep deprivation, EEG-implanted mice were monitored in new cages with new bedding, given water and food ad libitum, and occasionally touched gently with a soft brush when they seemed drowsy, as previously described32. Control mice were not disturbed and allowed to sleep freely. Mice in the sleep deprivation group and control group were anaesthetized at 13:00 and transcardially perfused and stained according to the protocol for immunohistochemistry. Mice in the sleep deprivation with recovery sleep group were permitted to sleep at 13:00 for 1 h and then perfused at 14:00.
Cell counting
For quantification of co-localization of Lhx6 and other histological markers, the area used for counting was demarcated by the Lhx6 cells in the zona incerta that were labelled by Lhx6–eGFP. All cell counting was conducted blind on 3 × 2 tiled images of the zona incerta using ImageJ. For each mouse, brain sections were analysed bilaterally, and the percentage of marker-positive neurons in Lhx6–eGFP+ neurons was compared by nonparametric statistical methods (see ‘Statistics’).
Stereotaxic AAV injection and EEG/EMG implantation
Surgery
AAV vectors were obtained from vector cores of the University of Pennsylvania (AAV9-EF1a. DIO.hChR2–eYFP)33 (Fig. 1 and Extended Data Fig. 4) and University of North Carolina (AAV9-EF1a.DIO.hM3Dq–mCherry; AAV9- EF1a.DIO.hM3Dq–eYFP; AAV9-EF1a.DIO.hM4Di–mCherry)23. For bilateral stereotaxic injection of AAV into the zona incerta, adult male mice (2–4 months old) were anaesthetized with ketamine/xylazine (100 µl of 100 mg ml−1 ketamine, 20 mg ml−1 xylazine) and placed in a stereotaxic frame. The scalp was incised to expose the skull and connective tissue was gently scraped away. After exposing the skull, bilateral craniotomies (~1 mm diameter each) were made to allow virus delivery (600–800 nl at 40 nl min−1). Stereotaxic coordinates: AP: −1.54 mm, L: 0.55 mm, DV: −4.8 mm, according to the reference atlas in ref. 34. Skin covering the boreholes was sutured closed following surgery. Lhx6-creERT2 mice that were injected with ChR2–eYFP constructs to map postsynaptic projections of Lhx6 VZI neurons, beginning one week following viral injection, 1.0 mg of 4-hydroxytamoxifen dissolved in corn oil was administered via intraperitoneal injection once a day for a total of five days in order to activate expression of the Cre-dependent channel-rhodopsin (ChR2) construct.
For EEG/EMG recordings, four-channel tethered EEG/EMG biosensors (Pinnacle Technology Inc.) were anchored onto the mouse skull. The two front screws used for EEG1 signal recording were positioned at: AP: +2 mm, ML: ±1.5 mm. The two back screws used for the EEG2 signal recording were positioned at: bregma AP: −4 mm, ML: ±1.5 mm. With the same implant, two EMG antenna electrodes were inserted into the left and right neck muscles. The EEG/EMG recording implant was secured to the mouse skull with dental cement. For EEG/EMG analysis of DREADD-injected mice, this surgery was performed immediately following AAV injection.
EEG/EMG recording
For all analysis of sleep behaviour, the Pinnacle Technology EEG/EMG tethered recording system for sleep behaviour evaluation was used, and mice were allowed a minimum of 10 days recovery in a 12-h light–dark cycle following EEG/EMG biosensor implantation. Implanted mice were tethered to a 100× preamplifier (Pinnacle Technology) and were housed in a 12-h dark–12-h light cycle (lights on between 07:00 (ZT0) and 19:00 (ZT12)) recording chamber. The mice were allowed around 5–7 days to acclimatize to the recording chamber before recording. The EEG and EMG signals were preamplified 5,000× and digitized at 14 bits and then recorded. Signal acquisition was obtained using the Sirena acquisition suite (Pinnacle Technology Inc.). EEG/EMG traces were recorded for 48 h for Foxd1-cre;Lhx6lox/lox mice, and data from the second day extracted for analysis (Fig. 3 and Extended Data Fig. 6). For analysis of mice injected with AAV-expressing cre-dependent Gq- and Gi-linked DREADD constructs, we used the virus-transfected mice with saline injection as control compared to mice with clozapine-N-oxide (CNO, Sigma-Aldrich; 0.5 mg kg−1 in saline) intraperitoneal injection. The following injection protocol was used for analysis of all mice injected with AAV-expressing Cre-dependent DREADD constructs: on day 1, we performed two consecutive saline injections at 12-h intervals at ZT23 (06:00) and ZT11 (18:00); on day 2, we injected CNO at ZT23 and ZT11. Alternatively, on day 1, the saline was injected at ZT5 and ZT17, and CNO at the same times on day 2 (Fig. 4 and Extended Data Figs 8–10). For analysis of mice injected with AAV-expressing Cre-dependent Gq DREADDs with suvorexant, a dual orexin receptor antagonist35, we used the virus-transfected mice with saline injection as controls. These were directly compared to mice that were administered CNO by intraperitoneal injection; suvorexant (Selleckchem; 25 mg kg−1 in 20% TPGS) was administered by oral gavage as described previously24; or mice were simultaneously treated with CNO and suvorexant. The following injection protocol was used for analysis of all mice injected with AAV-expressing Cre-dependent DREADDs: on day 1, we performed one saline injection at ZT5 (12:00); on day 2, we injected CNO at ZT5; on day 3, we injected suvorexant at ZT5; on day 5, we injected CNO and suvorexant at ZT5 (Extended Data Fig. 9).
To validate the specificity and efficacy of AAV DREADD infection following behavioural analysis, mice were given a single injection of CNO (0.5 mg kg−1 in saline) and euthanized 1 h later by terminal anaesthesia and transcardiac perfusion. For Gq DREADDs mice, CNO was injected at ZT5, and for Gi DREADDs mice, CNO was injected between ZT8 and ZT9. Immunohistochemistry was then performed to detect both mCherry and Fos expression (Extended Data Fig. 7).
EEG/EMG analysis
Raw EEG/EMG signals were loaded into Neuroscore (DSI) for scoring. We set the high-pass filter at 0.5 Hz and the low-pass filter at 40 Hz for both EEG channels. EMG signals were high-pass filtered at 10 Hz and low-pass filtered at 100 Hz. EEG1 and EEG2 signals were further transformed to be temporal AR (autoregressive model) spectrums. Researchers were blinded to genotype and/or treatment before data analysis. Sleep–wake state was visually scored in ~10-s periods as either wake (low-voltage, high-frequency EEG wave with high activity of EMG), rapid eye movement (REM, low-voltage, prominent theta frequency in EEG channel and low EMG) or NREM (high-voltage, low-frequency EEG wave with low activity of EMG). The percentage of time spent in each behavioural state was then statistically evaluated.
For investigating the sleep–wake behaviour of Foxd1-cre;Lhx6lox/lox mice, the EEG/EMG analysis was conducted for 24 h for both Foxd1-cre;Lhx6lox/+ control and Foxd1-cre;Lhx6lox/lox mice (Fig. 3 and Extended Data Fig. 6). In our analysis of sleep–wake behaviour in mice expressing activating or silencing DREADDs, we analysed data for 12 h after either saline or CNO injection (Fig. 4), as effects of CNO were not observed at time points after 10 h post-injection. A 2-h accumulation analysis was also conducted for evaluating temporal dynamics of sleep–wake states.
Sleep deprivation was performed on EEG/EMG chip-implanted mice as previously described9 and EEG/EMG signals were recorded simultaneously for 6 h of sleep deprivation and 1 h of recovery sleep. The fraction of time spent asleep or awake in each stage during this period was quantified as described above to confirm that the mice were kept awake during the 6 h of sleep deprivation and went to sleep during the 1 h sleep recovery. For the Gq DREADDs plus suvorexant drug experiment, we conducted EEG/EMG recordings and analysis as described above to quantify the duration of each sleep–wake stage when treated with CNO, suvorexant or both drugs simultaneously.
For spectral band analysis, we used a previously described methodology15. We applied FFT to 5-s epochs of raw EEG waves from extracted NREM or wakefulness episodes separately to calculate EEG power frequency within the frequency range of 0.1–125 Hz. On the basis of the sleep–wake stage labelling, we extracted a 2-h period of raw EEG wave of NREM or wake episodes between ZT7–ZT9 for both Lhx6 cKO and control mice for EEG power spectrum analysis. Similarly, in DREADD experiments, we extracted raw EEG waves of NREM or wake episodes between 2 and 4 h (ZT7–ZT9) after injection with saline or CNO at ZT5 for EEG power spectrum analysis to evaluate the effect of activating or silencing Lhx6 zona incerta neurons. Artefacts were removed from analysis by visual inspection of raw EEG and EMG data. In particular, data epochs that contained noise associated with large movements (EMG muscle artefacts) that occurred during active wake and vigilance states, which cover ~10% of the recording interval, were manually flagged and excluded from analysis. Movements were confirmed by analysis of the videotape. In addition, a low-rank approximation was applied to remove the 5% smallest Eigen factors from the raw data, and similar results were obtained to those seen using manual removal of artefacts.
The frequency data was collapsed into 0.5 Hz bins. All spectrum data were averaged for each bin for NREM or wake episodes separately. We then standardized the spectrum data by expressing each frequency bin from NREM or wake episodes for Lhx6 cKO or control mice as a percentage, relative to the same frequency bin and sleep stage in a baseline condition for the same mouse and at the same time of a different day (same zeitgeber time) (Fig. 3c–f). For DREADD experiments, we standardized the spectrum data by expressing each frequency bin in either saline or the CNO condition as a percentage, relative to the same frequency bin and sleep stage for a baseline condition for the same mouse and at the same time on a different day (same zeitgeber time) (Extended Data Figs 8, 10). The standardized frequency data were then averaged among each group of mice. To analyse the EEG frequency bands, relative power bins were summed as follows: delta 0.5–4 Hz, low theta 4–6 Hz, high theta 6–10 Hz, alpha 10–20 Hz, beta 20–40 Hz and gamma 40–100 Hz. All the frequency bins and bands analyses were done using custom software written using MATLAB (MathWorks).
We applied bout length and state transition analysis for all EEG/EMG physiology data (Extended Data Figs 6, 8, 10). The sleep–wake stages bout lengths and transition counts were extracted from the same 2-h recording period (ZT7–ZT9) by reading the sleep bout reports (Neuroscore, DSI) automatically with a coding script written using MATLAB (Mathworks). The sleep–wake stage bout lengths and state transitions were averaged for each group of mice.
Monosynaptic retrograde tracing with rabies virus
Virus production
The rabies viral vector RVΔG-4mCherry(EnvA) was made as described36. In brief, HEK 293T cells (ATCC CRL-11268) were transfected with expression vectors for the ribozyme-flanked viral genome (pRVΔG-4mCherry), rabies viral genes (pTIT-N, pTIT-P, pTIT-G and pTIT-L), and the T7 polymerase (pCAG-T7Pol). Supernatants were collected from 4 to 7 days after transfection, filtered, and pooled, passaged 3–4 times in BHK-B19G2 cells37 at a multiplicity of infection of 2–5, then passaged in BHK-EnvA2 cells37 at a multiplicity of infection of 2. Purification, concentration and titration were done as described36,37.
Adeno-associated viral vector genome plasmid pAAV-Syn-FLEX-splitTVAeGFP-tTA was made from pAAV-Syn-FLEX-sTpEpB38 by cloning the tetracycline transactivator gene in place of the SAD B19 glycoprotein gene and eliminating the BamHI and NcoI sites in the P2A sequences by seamless cloning. Adeno-associated viral vector genome plasmid pAAV-TREtight-BFP2-B19G was made by cloning the ‘TRE-tight’ tet response element from pAAV-TRE-HTG39, the mTagBFP2 gene40, a P2A element and the SAD B19 glycoprotein gene into pAAV-Syn-FLEX-sTpEpB38 by seamless cloning. Genomes were packaged into serotype 1 AAV by the University of North Carolina Vector Core. These AAV genome plasmids and their complete sequences have been deposited with Addgene with accession numbers 100798 and 100799.
Surgery
Monosynaptic retrograde tracing using rabies virus was performed as described14,38. Adult Lhx6-cre mice were anaesthetized under 1–2% isoflurane in oxygen with a 0.6–0.8 l per minute flow rate in a stereotaxic apparatus (Kopf). Virus was injected with a microsyringe (Hamilton, 33 GA) and microinjection pump (Hamilton) (rate at 100 nl min−1). For rabies virus-based retrograde tracing, mice were injected with 500 nl 1:1 mixed AAV1-Syn-FLEX-splitTVA-eGFP-tTA and AAV1-TREtight-BFP2-B19G in the right zona incerta (AP: −1.5 mm, ML: +0.5 mm, DV: −4.75 mm). After one week, the same mice received the second injection of 300 nl pseudotyped rabies virus RVΔG-4mCherry(EnvA) using the same coordinates. Control mice were injected with RVΔG-4mCherry(EnvA) alone, with helper virus omitted. Then mice were transferred to a quarantined cubicle for special housing and monitoring. Seven days after rabies injection, mice were anaesthetized with ketamine and perfused with ice-cold 4% PFA in PBS. Brains were collected and placed in 4% PFA overnight and switched to 30% sucrose for 2–3 days until they were fully sunk. Brains were sectioned on a microtome at a thickness of 40 µm and stored in the anti-freeze solution at −20°C for further usage. Control mice showed no red or green fluorescence in any brain regions examined (data not shown).
Electrophysiological recordings in brain slices
Surgery
Postnatal day (P)25–P31 Lhx6-cre;Hcrt–eGFP, Lhx6-cre;Gad2-NLS–mCherry or Lhx6-creERT2;Lhx6-GFP mice were anaesthetized with ketamine (50 mg kg−1), dexmedetomidine (25 µm kg−1) and the inhalation anaesthetic isoflurane (1–3%) and fixed in a custom-made stereotaxic frame. A small craniotomy was made and 50–100 nl of the AAV9-EF1α-DIO-hChR2(H134R)–mCherry vector (University of Pennsylvania Vector Core) was pressure-injected into the zona incerta (AP: −1.35 mm, ML: 0.3 mm lateral and DV: −4.7 mm) through a glass pipet (15–20-µm tip diameter, Drummond). For experiments performed with Lhx6-cre;Gad2-NLS–mCherry mice, 50–100 nl of AAV9-EF1α-DIO-hChR2(H134R)–eYFP (University of Pennsylvania Vector Core) was injected. The analgesic buprenorphine (0.05 mg kg−1) was administered to all mice post-operatively. For experiments with Lhx6-creERT2;Lhx6-GFP mice only, beginning on the fifth day following viral injection, 0.5 mg of 4-hydroxytamoxifen dissolved in corn oil was administered by intraperitoneal injection once a day for five days to activate expression of Cre recombinase. Mice were euthanized 11–31 days after virus injection for use in electrophysiological experiments.
Brain slice preparation and cell identification
Mice were anaesthetized with isoflurane and the brains were rapidly removed and chilled in ice-cold sucrose solution containing (in mM): 76 NaCl, 25 NaHCO3, 25 glucose, 75 sucrose, 2.5 KCl, 1.25 NaH2PO4, 0.5 CaCl2 and 7 MgSO4, pH 7.3. Acute brain slices (300 µm) were prepared in a coronal orientation using a vibratome (VT-1200s, Leica). Slices were then incubated in warm (32–35°C) sucrose solution for 30 min, then transferred to warm (32–34°C) artificial cerebrospinal fluid (ACSF) composed of (in mM): 125 NaCl, 26 NaHCO3, 2.5 KCl, 1.25 NaH2PO4, 1 MgSO4–7H2O, 20 d-(+)-glucose, 2 CaCl2–2H2O, 0.4 ascorbic acid, 2 pyruvic acid, and 4 l-(+)-lactic acid, pH 7.3, 315 mOsm, and allowed to cool to room temperature. All solutions were continuously bubbled with 95% O2/5% CO2.
For whole-cell recordings, slices were transferred to a submersion chamber on an upright microscope (Zeiss AxioExaminer, Objectives: 5×, 0.16 NA and 40×, 1.0 NA) fitted for infrared differential interference contrast (IR-DIC) and fluorescence microscopy. Slices were continuously superfused (2–4 ml min−1) with warm oxygenated ACSF (32–34°C). Neurons were visualized with a digital camera (Sensicam QE; Cooke) using either transmitted light or epifluorescence. Hcrt neurons in Lhx6-cre;Hcrt–eGFP mice were identified based on their eGFP expression (Extended Data Fig. 5). In Lhx6-cre;Gad2-NLS–mCherry mice, Gad2 neurons were identified based on their mCherry expression (Extended Data Fig. 5). Because Lhx6 neurons express Gad2, the response to 500 ms of photostimulation with blue light recorded in voltage-clamp was used to eliminate ChR2-expressing Lhx6 neurons from the analysis. In Lhx6-creERT2;Lhx6–eGFP mice, Lhx6 neurons were categorized as either ChR2-expressing Lhx6 cells or untransfected cells based on mCherry expression and the response to 500 ms of photostimulation with blue light recorded in voltage-clamp (Extended Data Fig. 5).
Whole-cell recordings and analysis
Glass recording electrodes (2–4 MΩ) were filled with an internal solution containing (in mM): 36.4 KCl, 96.4 KMeSO3, 9.1 HEPES, 0.18 EGTA, 4 MgATP, 0.3 NaGTP, 20 phosphocreatine(Na), pH 7.3, 295 mOsm. Biocytin (0.25% w/v) was added to the internal solution. Whole-cell patch-clamp recordings were obtained using a Multiclamp 700B amplifier (Molecular Devices), low-pass filtered at 10 kHz and digitized at 20–100 kHz using an ITC-18 (Instrutech) controlled by custom software written in Igor Pro (Wavemetrics). The series resistance averaged 11.8 ± 5.6 MΩ (mean ± s.d.) (n = 89 neurons from 17 mice, all <30 MΩ) and was not compensated. For ChR2 photoactivation, a small spot (~315 µm diameter) of blue light (6–600 mW per mm2) was delivered as previously described using a blue LED (~470 nm; Luminous)41 and focused onto the recorded cell. Neurons firing spontaneous action potentials were hyperpolarized with small current injections (−10 to −70 pA) when measuring postsynaptic responses. Pharmacological experiments used 5 µM 2,3-dioxo-6-nitro-1,2,3,4-tetrahydrobenzo[f]quinoxaline-7-sulfonamide disodium salt (NBQX; AMPA receptor antagonist), 5 µM (RS)-3-(2-carboxypiperazin-4-yl)-propyl-1-phosphonic acid (CPP; NMDA receptor antagonist) and 10 µM 6-imino-3-(4-methoxyphenyl)-1(6H)-pyridazinebutanoic acid hydrobromide (gabazine; GABAA receptor antagonist). To test for monosynaptic connections, the sodium channel blocker, tetrodotoxin (TTX, 1 µM) was first applied to the bath to confirm that recorded postsynaptic responses were action-potential dependent. Then the potassium channel blocker 4-AP (100 µM) was added along with TTX to test for monosynaptic connections18. All drugs were purchased from Tocris. The resting membrane potential was measured after whole-cell configuration was achieved. The input resistance was determined by measuring the voltage change in response to a 1-s hyperpolarizing current step (−10 to −25 pA). The amplitude of the sag response was calculated as the difference between the minimum membrane potential following the initiation of a −25-pA current step and the steady-state membrane potential at the end of the 1-s step. Data analysis was performed in Igor Pro (Wavemetrics), Excel (Microsoft), OriginPro 8 (OriginLab) and SigmaPlot (Systat Software). To determine whether Hcrt, Gad2 or Lhx6 neurons in the lateral hypothalamus received Lhx6 input, 20 or more postsynaptic responses to two brief 3-ms photostimulations were first averaged. As a subset of neurons exhibited hyperpolarizing responses shortly after break-in, neurons where the absolute value of the response to the first photostimulation exceeded 0.1 mV and two times the root mean square of the 500 ms preceding the first photostimulation were identified as responsive neurons (Hcrt neurons: 15 out of 20 neurons recorded from four mice responded with one hyperpolarizing response; Gad2 neurons: 17 out of 31 neurons recorded from five mice responded with five hyperpolarizing responses; Lhx6 neurons: 6 out of 18 recorded neurons recorded from three mice responded with two hyperpolarizing responses). To determine the failure rate, each trace was assessed in a similar manner for a response. For responses in Hcrt and Gad2 neurons, the response latency was measured as the time point at which the rise time exceeded 0.1 mV ms−1 in depolarizing responses, except for two Gad2 neurons for which the response was too small to assess. Data are presented as the mean ± s.e.m. unless otherwise noted.
Confirmation of the identity of recorded neurons
Brain slices were first fixed in 4% PFA in 0.01 M PBS after recordings, then slices were incubated with blocking buffer containing 2% Triton X-100 (Sigma-Aldrich) and either 5% normal goat serum or 5% normal donkey serum in PBS for 1 h at room temperature. To visualize biocytin-filled cells and confirm their identity, slices were incubated with Alexa Fluor 350-conjugated streptavidin (1:200, S11249, ThermoFisher Scientific) and either chicken anti-GFP antibody (1:300, GFP-1020, Aves) for Hcrt-GFP neurons or rabbit anti-DsRed antibody (1:1,000, 632496, Clontech) for Gad2–mCherry neurons in PBS containing 1% Triton X-100 and 5% corresponding serum overnight. Secondary antibodies used were either Alexa Fluor 488-conjugated goat anti-chicken antibody (1:1,000, A11039, ThermoFisher Scientific) or Alexa Fluor 568-conjugated donkey anti-rabbit antibody (1:1,000, A10042, ThermoFisher Scientific). Images were acquired using a Zeiss Cell Observer and Zeiss 510 confocal microscope.
Immunohistochemistry
Mice were anaesthetized with ketamine and transcardially perfused with 20 ml 1× PBS followed by 50 ml of 4% PFA (m/v) in PBS. Brains were removed, fixed overnight in 4% PFA, followed by 30% sucrose (m/v) in PBS overnight in 4°C for cryoprotection, and embedded and frozen at −80°C. Using a cryostat, the frozen brains were sectioned into 40-µm coronal slices for immunohistochemistry. Immunohistochemistry was performed as described previously with minor changes9. Brain sections were washed with 1× PBS and incubated with Superblock (Thermo Scientific, 37515) to block non-specific binding sites. After briefly washing the sections, primary antibodies were diluted in a blocking solution of 5% horse serum in 0.25% Triton X-100 in PBS. The following primary antibodies were used: rabbit anti-GFP (1:500, A-6455, Invitrogen); mouse anti-Lhx6 (1:100, sc-271433(Clone A-9), Santa Cruz Biotechnology), goat anti-Hrct (1:400, sc-8070, Santa Cruz Biotechnology), rabbit anti-Fos (1:400, sc-52, Santa Cruz Biotechnology), rabbit anti-tyrosine hydroxylase (TH) (1:400, p4010-150, Pel-Freez), rabbit anti-parvalbumin (1:400, PV 27, Swant) and rabbit anti-GABA (1:200, A2052, Sigma-Aldrich). Brain sections were incubated in primary antibodies and blocking solution overnight at 4°C.
Secondary antibody in blocking solution was then used to incubate the slides for 2 h at room temperature. Secondary antibodies used were: Alexa Fluor 488-conjugated donkey anti-rabbit (1:500, A21206, Invitrogen), Alexa Fluor 488-conjugated donkey anti-mouse (1:500, A212062, Invitrogen), Alexa Fluor 488-conjugated donkey anti-goat (1:500, A11055, Invitrogen), Alexa Fluor 594-conjugated donkey anti-rabbit (1:500, A21207, Invitrogen), Alexa Fluor 594-conjugated donkey anti-mouse (1:500, A21203, Invitrogen) and Alexa Fluor 594-conjugated donkey anti-goat (1:500, A11058, Invitrogen). After washing in 0.1% Triton X-100 in 1× PBS and staining with DAPI (1:5,000, 10236276001, Roche), brain sections were mounted on positively charged slides with Vectashield Mounting medium (H-1500, Vector laboratories). Fluorescent images were taken using a Zeiss Axioskop 2 Mot Plus Microscope or Zeiss Meta 510 LSM confocal microscope.
For staining of rabies virus-injected brain sections, brain sections were washed twice with TBS, followed by permeabilization with 0.5% Triton X-100 TBS for 20 min and blocking with 3.5% donkey serum in TBS + 0.1% Triton X-100 for 30 min. Sections were then incubated in the primary antibody overnight at 4°C on the shaker. On the second day, brain sections were washed with TBS and then incubated with secondary antibody at room temperature for 2 h. Primary antibodies and their dilutions are as follows: goat anti-GFP (1:500, 600-101-D16, Rockland), rat anti-mCherry (1:500, M11217, Thermo Scientific), mouse anti-Lhx6 (1:400, sc-271433, Santa Cruz), rabbit anti-GABA (1:200, A2052, Sigma-Aldrich), goat anti-ChAT (1:100, Sigma-Aldrich), rabbit anti-HDC (1:1000, 16045, Progen), rabbit anti-Tph2 (1:400, AB111828, Abcam), rabbit anti-TH (1:200, P40101-150, Pel Freez). Images were then acquired with an Olympus FLUOVIEW1000 confocal microscope using a 10× (NA 0.4) or 40× oil (NA 1.30) lens and further processed by ImageJ (Fig. 1k–t and Extended Data Figs 2, 4).
Fluorescence in situ hybridization (FISH) with immunohistochemistry
We performed FISH analysis in conjunction with anti-GFP immunohistochemistry on Lhx6–eGFP mice with in situ markers including Gad1 and somatostatin (Sst) (Fig. 1 and Extended Data Fig. 1). The RNA probes were generated using the following EST sequences as templates: Gad1 (GenBank accession AI845043), Sst (GenBank accession AI848192). Brains were removed from transgenic Lhx6–eGFP mice within 5 min after euthanasia and fixed overnight in 4% PFA (m/v) in 1× PBS at 4°C followed by incubation in 30% sucrose (m/v) in PBS overnight in 4°C for cryoprotection. The embedded and frozen brains were sectioned into 40-µm sections using a cryostat and then mounted onto positively charged slides. For FISH, all equipment was cleaned with 0.3 M sodium hydroxide and RNaseZap and all solutions were DEPC-treated and autoclaved.
FISH was carried out as previously described42 with some alterations. In brief, slides were fixed in 4% PFS (m/v) in 1× PBS for 15 min and then cell membranes were digested by incubation in 1 µg ml−1 proteinase K with 50 mM Tris pH 7.5 and 5 mM EDTA in 1× PBS for 15 min. After re-fixation in 4% PFA, the brain sections underwent acetylation with 0.27% acetic anhydride and 10% 1 M TEA (pH 8) in 1× PBS. The slides were then washed in 1× PBS, incubated in 0.1% Triton X-100 in PBS for 1 h and then quenched in 1% hydrogen peroxide in PBS for 30 min to eliminate endogenous peroxidase activity. Next, the slides were incubated in hybridization buffer (50% formamide, 5× saline sodium citrate (SSC)) for 2 h and incubated overnight under siliconized coverslips in heat-activated DIG-conjugated RNA probes diluted in hybridization buffer at 68°C. The next day, a 5× SSC wash was followed by two 0.2× SSC washes to remove the coverslips and to eliminate nonspecific probe binding. The slides were then washed with 0.3% Triton X-100 in PBS and incubated in blocking buffer (0.1% Triton X-100, 1% HISS in 1× PBS) for 1 h.
For detection of Lhx6+ neurons, immunohistochemistry for anti-eGFP was combined with the subsequent in situ hybridization steps. The slides were incubated overnight at 4°C in a blocking solution containing rabbit anti-GFP antibody (1:500, A-6455, Invitrogen) and anti-digoxigenin-POD antibody (1:1,000, 1207733, Roche). After washing the slides in 0.3% Triton X-100 multiple times on the third day, the probe signal was recovered by Cy3-tyramide amplification reagent (1:125, NEL752001KT, TSA Plus cyanine 3/cyanine 5 system, PerkinElmer) in 1× amplification diluent and monitored frequently by fluorescent microscopy for the timing of signal appearance. Slides were washed, quenched in 1% hydrogen peroxide and 0.3% Triton X-100 in PBS and blocked in blocking solution (0.2% Triton X-100, 1% horse serum, 0.1% BSA powder) for 1 h. Primary antibody signal was then detected by species-specific Alexa Fluor 488-conjugated donkey anti-rabbit (1:500; A21206, Invitrogen) incubated with blocking solution for 2 h. Slides were then washed and coverslipped in Vectashield. Fluorescence images were taken using a Zeiss Axioskop 2 Mot Plus Microscope or Zeiss Meta 510 LSM confocal microscope.
Statistics
The experiments were not randomized. No statistical methods were used to predetermine sample size. For Fos immunohistochemistry analysis, each group consisted of data obtained from four mice, a total of four bilateral sections containing the zona incerta was analysed for each mouse, which resulted in interdependence in each group. As a result, to analyse this data, we applied a linear mixed-effect model fit by REML, a non-parametric method, which can resolve issues of interdependence in the Fos data. A two-tailed, one-way ANOVA was used to evaluate the differences among multiple groups. A two-way ANOVA with Bonferonni correction was used to assess pharmacological manipulations in electrophysiological experiments. All sleep–wake data analysis was analysed by two-way ANOVA followed by Sidak’s post hoc test, and later confirmed by a non-parametric method, Wilcoxon/Mann–Whitney U-test. Statistical analysis was conducted using the statistical programming language R (R Foundation for Statistical Computing) and Excel (Microsoft).
Data availability
Source Data for all figures are provided with the online version of the paper.
Extended Data
Extended Data Figure 1. Distribution of diencephalic Lhx6+ neurons and immunohistochemical analysis of Lhx6-expressing neurons.
Continued from Fig. 1. a, Schematics showing the distribution of Lhx6+ neurons in diencephalon. Blue boxes indicate Lhx6+ neurons (green) in the zona incerta, dorsomedial hypothalamus and the posterior hypothalamus, with representative images shown in b–d. b–d, Co-expression of eGFP (green) and Lhx6 in Lhx6–eGFP line (red) in zona incerta (b), dorsomedial hypothalamic nucleus (c), and posterior hypothalamus (d). eGFP signal fills the cell cytoplasm, whereas Lhx6 immunostaining is nuclear. Insets show magnified images of b–d. Image in b is identical to main Fig. 1b and is included for comparison. Scale bar, 100 µm. e, The percentage Lhx6+ and eGFP-expressing neurons in the Lhx6–eGFP line over the number of Lhx6–eGFP+ neurons in the zona incerta. n = 5 mice, eight sections per group. Data are mean ± s.e.m. f–i, Representative images showing Vgat-Cre;Ai9 (f, red) and Lhx6+ neurons (g, green) in the zona incerta. Merged image is shown in h and magnification is shown in i. j–m, Representative images showing Pvalb+ neurons (j, red) and Lhx6–eGFP+ neurons (k, green) in the zona incerta. Merged image is shown in l and magnification is shown in m. n–q, Representative images showing somatostatin neurons from FISH (n, red) and Lhx6–eGFP neurons (o, green) in the zona incerta. Merged image is shown in p and magnification is shown in q. Scale bars, 100 µm (d, f–h, j–l, n–p) and 25 µm (i, m, q).
Extended Data Figure 2. Lhx6-Cre activity recapitulates endogenous Lhx6 expression pattern and immunohistochemical analysis of Lhx6-expressing neurons.
Continued from Extended Data Fig. 1. a–d, Representative images showing Lhx6+ neurons in the zona incerta (a, green), tdTomato expression in the Lhx6-cre;Ai9 line (b, red). tdTomato staining is also observed in endothelial cells, where Lhx6 expression is not detected in adult mouse brains. Merged image is shown in c and magnification is shown in d. Arrows indicate examples of colocalization of Lhx6 and tdTomato expression. e, The percentage Lhx6+tdTomato+ neurons relative to tdTomato+ neurons in the zona incerta in the Lhx6-cre;Ai9 line. n = 3 mice. Data are mean ± s.e.m. f–h, Representative images showing MCH+ neurons (f, red) in the lateral hypothalamus and Lhx6–eGFP neurons (g, green) in the zona incerta. Merged image is shown in h. i–k, Representative images showing Hcrt+ neurons (i, red) in the lateral hypothalamus and Lhx6–eGFP neurons (j, green) in the zona incerta. Merged image is shown in k. Scale bars, 100 µm (a–c, f–k) and 25 µm (d).
Extended Data Figure 3. Additional data showing mapping of neural projection sites of Lhx6-expressing neurons in the VZI, and projection sites of Slc32a1 and Pvalb-expressing cells in the zona incerta.
Continued from Fig. 1. a, Schematics showing neural projection sites of Lhx6+ neurons in the zona incerta across multiple brain regions after ChR2–eYFP virus injection into the zona incerta of the Lhx6-cre line. b, e, h, k, n, Representative images of eYFP+ axonal processes of Lhx6+ neurons of the VZI (green) in amygdala (b), substantia nigra (e), periaqueductal grey (h), ventral tegmental area (k) and dorsal raphe nucleus (n). TH (red) immunostaining was used to demarcate the amygdala, substantia nigra, periaqueductal grey and ventral tegmental area in b, e, h and k. TPH2 (red) immunostaining was used to demarcate the dorsal raphe nucleus in n. Scale bars, 100 µm. c, f, i, l, o, High-power images of the brain of a Slc32a1-cre mouse injected with DIO-rAAV–eGFP in the zona incerta, demonstrating infection in zona incerta (c), central thalamus (f, o), amygdala (i) and periaqueductal grey (l). White arrows indicate eGFP+ processes in i. Scale bars, 200 µm. d, g, j, m, p, High-power images of the brain of a Pvalb-cre mouse injected with DIO-rAAV–eGFP in zona incerta. eGFP+ processes are detected in the zona incerta (d) and central thalamus (g, m). No signal is detected in the amygdala (j) and very little signal is seen in the periaqueductal grey (m). Scale bars, 200 µm. c, d, f, g, i, j, l, m, o, p, Images were obtained from the Allen Brain Atlas Mouse Connectome Project. Experiment numbers 17106613 for Scl32a1-IRES-Cre (section 73 (c, f, i), section 58 (l) and section 44 (o)) and 301539438 for Pvalb-IRES-Cre (section 68 (d, g, j), section 60 (m) and section 45 (p)). Amyg, amygdala; CPu, caudate putamen; DR, dorsal raphe nucleus; ECIC, external cortex of the inferior colliculus; Hip, hippocampus; LH, lateral hypothalamus; MGP, medial globus pallidus; MM, mammillary nucleus; PAG, periaqueductal grey; PH, posterior hypothalamus; Pn, paranigral nucleus; SNpc, substantia nigra pars compact; VTA, ventral tegmental area.
Extended Data Figure 4. Presynaptic inputs to Lhx6+ zona incerta neurons.
Continued from Fig. 1. a, Schematic showing the distribution of presynaptic neurons (red dots) to Lhx6 zona incerta neurons and location of presynaptic neurons across the rostro-caudal gradient of the mouse brain. For mice injected with rabies + TVA (tumour virus A, the receptor for modified rabies virus), n = 4. For rabies only controls, n = 2. b–d, Distribution of presynaptic neurons to Lhx6+ zona incerta neurons located in the lateral hypothalamus (RABV, b, red). GABA immunostaining (c, grey) was used to label neurons in the lateral hypothalamus. Merged image is shown in d. e–g, Distribution of presynaptic neurons to Lhx6 zona incerta neurons located in the periaqueductal grey (RABV, e, red). GABA immunostaining (f, grey) was used to label neurons in the periaqueductal grey. Merged is shown in g. Arrows indicate neurons with RABV and GABA co-localization (b– g). Scale bar, 100 µm. AC, anterior commissural nucleus; AR, arcuate nucleus; Acb, nucleus accumbens; aPAG, anterior periaqueductal grey; APT, anterior pretectal nucleus; ATC, anteromedial thalamic nucleus; BNST, bed nucleus of the stria terminalis; CA1, hippocampus CA1; CA3, hippocampus CA3; CeA, central nucleus of the amygdala; Cg1/Cg2, cingulate cortex; Cl, Claustrum; CM, central medial nucleus of thalamus; CPu, striatum; DG, dentate gyrus; DMH, dorsomedial hypothalamus; DpG, motor-related nuclei of superior colliculus; DR, dorsal raphe nucleus; ECIC, external cortex of the inferior colliculus; Ent, entorhinal cortex; Gi, midline gigantocellular nucleus of the medulla; HDB/VDB, nucleus of the diagonal band; Ing, intermediate grey layer of superior colliculus; Lat, lateral/dentate cerebellar nucleus; LDTG, laterodorsal tegmental nucleus; LH, lateral hypothalamus; LHb, lateral habenula; LO, lateral orbital cortex; LPBE, lateral parabrachial nucleus of the pons; LPOA, lateral preoptic area; LS, lateral septum; LVE, lateral vestibular nucleus; M1/M2, frontal/secondary motor cortex; Med, fastigial nucleus; MePD, posterodorsal medial amygdaloid nucleus; MHb, medial habenula; MM, medial mammillary nucleus; MnPO, median preoptic nucleus; MnR, median raphe nucleus; MPB, medial parabrachial nucleus; MPOA, medial preoptic area; MS, medial septal nucleus; PH, posterior hypothalamus; Pir, piriform cortex; PnO, pontine reticular nucleus, oral part; PPTG, pedunculopontine tegmental nucleus; PVH, paraventricular nucleus of the hypothalamus; PVT, paraventricular nucleus of thalamus; RMG, nucleus raphe magnus; Rn, red nucleus; RS, retrosplenial area; RT, reticular nucleus; RtTg, midbrain reticular formation; S, subiculum; S1/S2, somatosensory cortex; S1BF, barrel cortex; SFO, subfornical organ; SNPC, substantia nigra pars compact; SNR, substantia nigra, reticular part; SPF, parafascicular thalamic nucleus; SuM, supramammillary nucleus; TeA, temporal association cortex; TMN, tuberomammillary nucleus; VLGN, ventrolateral geniculate nucleus; vlPAG, ventrolateral Periaqueductal grey; VMH, ventromedial hypothalamus; VO, ventral orbital cortex; VP, ventral pallidum; VTA, ventral tegmental area; ZI, zona incerta.
Extended Data Figure 5. Synaptic outputs of Lhx6 neurons in the zona incerta.
Continued from Fig. 2. a, Schematic showing injection of AAV9-DIO-ChR2–mCherry into the zona incerta of Lhx6-cre;Hcrt–eGFP mice. The red box shows the location of Hcrt-expressing neurons (green) in the lateral hypothalamus and the ventromedial portion of the zona incerta with ChR2-expressing Lhx6+ neurons (red) shown in the image on the right. Scale bar, 300 µm. b, Responses of two Hcrt neurons to brief (3 ms) photostimulation of ChR2-expressing Lhx6 axons. The average responses (left) and two representative responses (right) are shown for each neuron. The responses are depolarizing owing to the high chloride internal solution used. The amplitude of the average responses was smaller than for individual responses because of the failure rate to any individual photostimulation (24.0 ± 5.9%, range 65.8–0%; n = 15 cells). c, Average responses recorded from a Hcrt neuron to photostimulation of ChR2-expressing Lhx6 axons under control conditions (left), following bath application of the sodium channel blocker tetrodotoxin (TTX, middle) and following the addition of the potassium channel blocker 4-AP (right). Note that the cell shows a depolarizing response owing to the high chloride internal recording solution. d, Summary data showing the amplitude of the average response to the first photostimulation under control conditions, following bath application of TTX and TTX together with 4-AP. The responses recorded using a high chloride internal solution in TTX and 4-AP treatment indicate that ChR2-expressing Lhx6+ VZI neurons form monosynaptic connections onto the recorded Hcrt+ neurons (control, 4.85 ± 1.37 mV; TTX, 0.07 ± 0.04 mV; TTX + 4-AP, 6.65 ± 1.50 mV; two-way ANOVA with Bonferroni correction, control versus TTX, *P = 0.01498; TTX versus TTX + 4-AP, **P = 0.00178, control versus TTX + 4-AP, P = 0.61814; n = 6 cells from four mice). e–g, Expression of eGFP (e, green) in recorded Hcrt–eGFP neurons was confirmed by filling the recorded cells in the lateral hypothalamus with biocytin (f, blue). Arrows indicate colocalization of the two markers in the recorded neurons as seen in the merged image (g). Scale bar, 50 µm. h, Schematic showing injection of AAV9-DIO-ChR2–eYFP into the zona incerta of Lhx6-Cre;Gad2-NLS–mCherry mice (left). The red box shows the location of the image (right) showing Gad2-expressing neurons (red) in the lateral hypothalamus and Lhx6+ neurons (green) in the ventromedial portion of the zona incerta. Scale bar, 500 µm. i–k, Colocalization of mCherry (i, red) in Gad2-NLS–mCherry mice with biocytin (j, blue) in Gad2+ neurons recorded in the lateral hypothalamus. The arrow indicates colocalization of the two markers as seen in the merged image (k). Scale bar, 20 µm. l, Average responses recorded from a Gad2-expressing neuron to brief (3 ms) photostimulation of ChR2-expressing Lhx6 axons under control conditions (left), following bath application of the ionotropic glutamate receptor antagonists, CPP and NBQX (middle) and following the addition of the GABAA receptor antagonist, gabazine (right). Note that the response is depolarizing owing to the high concentration of chloride in the internal recording solution. Responses were eliminated in the presence of gabazine (control, 3.96 ± 1.55 mV; CPP + NBQX, 3.48 ± 2.16 mV; CPP + NBQX + gabazine: 0.01 ± 0.01 mV; n = 3 cells from two mice). m, Schematic showing injection of AAV9-DIO-ChR2–mCherry virus into the zona incerta of Lhx6-creERT2;Lhx6–eGFP mice (left). The red box indicates the location of a representative image from one mouse (right) showing mCherry-expressing (red) and eGFP-expressing (green) Lhx6+ neurons in the zona incerta. The red box indicates the location of higher magnification images in n–p. Scale bar, 100 µm. n–p, Expression of mCherry (n, red) and eGFP (o, green) in Lhx6-creERT2;Lhx6–eGFP mice injected with AAV9-DIO-ChR2–mCherry in the zona incerta. The merged image is shown in p. Arrows in p indicate a subset of Lhx6+ neurons that express both ChR2–mCherry and eGFP. Scale bar, 100 µm. q, Average response elicited by 500 ms photostimulation in a ChR2-expressing Lhx6+ VZI neuron recorded in whole-cell voltage-clamp mode (left) and a representative trace of action potentials elicited by brief 3-ms flashes of blue light (10 Hz) recorded in current-clamp in the same neuron (right). Note that the train of light pulses reliably elicits action potentials. Responses to 500-ms long light pulses recorded in voltage-clamp were used to distinguish ChR2-expressing from non-ChR2-expressing Lhx6+ VZI neurons. r, Representative average responses of two non-ChR2-expressing Lhx6+ neurons to photostimulation of axons of ChR2-expressing Lhx6+ neurons. The responses are depolarizing because of the high concentration of chloride in the internal recording solution. s, Representative responses from two Lhx6+ neurons in response to steps of depolarizing (+50 pA) current. Average responses to hyperpolarizing current steps (−25 pA) are also shown. t, The spike half-width (left; n = 17 cells) and sag amplitude (right; n = 14 cells) of recorded Lhx6+ neurons. The mean ± s.e.m. of the responses are shown in black. u, Plot of the inter-spike intervals for trains of action potentials elicited in Lhx6+ neurons by 1-s steps of depolarizing current. The mean ± s.e.m. of the responses are shown in black (n = 15 cells).
Extended Data Figure 6. Lhx6 expression is selectively deleted in the diencephalon, but preserved in the telencephalon of Lhx6-conditional knockout Foxd1-cre;Lhx6lox/lox (cKO) line, and Lhx6 cKO mice do not display obvious behavioural abnormalities other than changes in sleep patterns.
Continued from Fig. 3. a–l, Representative images of Lhx6 immunostaining (green) in the cortex (a–d), amygdala (e–h) and zona incerta (i–l) of control (a, b, e, f, i, j) and cKO (c, d, g, h, k, l) mice. Magnified images of a, c, e, g, i, k are shown in b, d, f, h, j, l, respectively. Note an absence of Lhx6 expression in the zona incerta of the cKO group. Scale bars, 100 µm. m, n, Sample EEG recordings for control (m) and cKO (n) mice with wake (yellow), REM sleep (red) and NREM sleep (purple) indicated, along with hypnogram (sleep stage), FFT-derived delta power (femtovolts2), EEG spectrum (frequency), EEG raw activity (amplitude) and EMG raw activity (amplitude) between ZT7 and ZT10. o, p, Bout length quantification (o) showing the duration of wake, NREM and REM episodes and bout count quantification (p) showing sleep–wake transitions in control (Foxd1-cre;Lhx6lox/+) and cKO (Foxd1-cre;Lhx6lox/lox) groups. Two-way ANOVA followed by Sidak’s post hoc test. n = 8 control and 8 cKO mice. q–v, Light–dark preference test (q), EPM (r, s), grip strength (t), open field test (u) and rotarod (v) were conducted in control (red) and Lhx6 cKO (blue) groups. *P < 0.05 for changes in sleep patterns (m–p); no significant difference (P > 0.1) was detected for all other behaviours (q–v) analysed; two-way ANOVA followed by Sidak’s post hoc test. Data are mean ± s.e.m. n = 8 control and 8 cKO mice.
Extended Data Figure 7. Distribution of AAV-DREADD infection sites in the zona incerta of Lhx6-cre mice and CNO activates Fos expression in AAV-DIO-hM3Dq-injected Lhx6-Cre mice, whereas CNO does not affect sleep in AAV-DIO–mCherry-injected Lhx6-Cre mice.
Continued from Fig. 4. a, Schematics showing distribution of DREADD-infected (hM3Dq or hM4Di mice) neurons (red) across the rostrocaudal extent of the zona incerta after AAV-DREADD was injected into the zona incerta of Lhx6-cre mice. Infection is specific to the zona incerta in 12 Lhx6-cre mice (red colour indicates infection site from all 12 mice). Yellow colour indicates additional infected areas seen in 4 out of 12 mice. b–d, Representative images showing co-expression of hM3Dq DREADD in the zona incerta of Lhx6-cre mice (b, red) with Lhx6 immunostaining (c, green). The merged image is shown in d, inset shows a magnified image of d. e–g, Representative images showing co-expression of AAV-hM4Di infection in the zona incerta of Lhx6-cre mice (e, red) with Lhx6 immunostaining (f, green). A merged image is shown in g; inset shows a magnified image of g. Scale bar, 100 µm. h–j, Representative images showing hM3Dq–mCherry expression (red) and Fos immunostaining in the zona incerta of Lhx6-cre mice after saline (h) or CNO (i) injection. A magnified image of i is shown in j. k, The percentage Fos+ neurons in hM3Dq–mCherry+ Lhx6-expressing neurons in the zona incerta in mice injected with saline or CNO. ***P < 0.001, two-tailed paired t-test; n = 4 mice, 8 sections for saline; n = 5 mice, 8 sections for CNO. l–n, Representative images showing hM4Di–mCherry expression (red) and Fos immunostaining (green) in the zona incerta of Lhx6-Cre mice after saline (l) or CNO (m) injection. A magnified image of l is shown in n. Scale bars, 100 µm. o, The percentage Fos+ neurons in hM4Di–mCherry+ Lhx6-expressing neurons in the zona incerta in mice injected with saline or CNO. *P < 0.05, two-tailed paired t-test; n = 3 mice, 8 sections for saline; n = 3 mice, 8 sections for CNO. Data are mean ± s.e.m. o–q, Saline- or CNO-injection at ZT5 in the AAV8-DIO–mCherry group shows that CNO injection does not affect sleep. EEG analysis showing amount of time spent across ZT in wake (o), REM sleep (p) and NREM sleep (q). P > 0.1 for all behavioural readouts, two-way ANOVA followed by Sidak’s post hoc test, n = 4 mice for saline, n = 4 mice for CNO.
Extended Data Figure 8. Additional data from Gq DREADD-injected Lhx6-cre mice.
Continued from Fig. 4. a, Schematics showing the construct of the AAV-DIO-hM3Dq–mCherry virus and the injection site of virus into the zona incerta of Lhx6-cre mice. b, EEG analysis showing the percentage of time in 2-h bins spent in wake (top), NREM sleep (middle) and REM sleep (bottom) after injection of saline or CNO at ZT17 in hM3Dq groups. c, Bout length quantification (top) showing durations for wake, NREM and REM episodes and bout count (bottom) showing sleep–wake transitions with saline or CNO injection in hM3Dq groups. d, FFT analysis of EEG power spectrum frequency of NREM stage of CNO-injected AAV-DIO-hM3Dq-infected mice (blue) compared to control (saline-injection, red). e, Grouped EEG frequency data obtained from spectrum band analysis of saline- (red) and CNO-injected (blue) hM3Dq mice. f, FFT analysis of EEG power spectrum frequency of the wake stage of CNO-injected AAV-DIO-hM3Dq-infected mice (blue) compared to control (saline-injection, red). g, Grouped EEG frequency data obtained from spectrum band analysis of saline- (red) and CNO-injected (blue) hM3Dq mice. Data are mean ± s.e.m. *P < 0.05, **P < 0.01; two-way ANOVA followed by Sidak’s post hoc test (b, c, e, g). n = 8 mice (b–g).
Extended Data Figure 9. The dual orexin receptor antagonist suvorexant can increase both NREM and REM sleep.
Continued from Fig. 4. a, Schematic showing sleep recording paradigm (EEG and EMG recording) for experiments with suvorexant. b, EEG analysis showing the percentage of time in 2-h bins spent in wake (left), NREM sleep (middle) and REM sleep (right) after injection of saline or suvorexant at ZT5. c, EEG analysis showing the percentage of time in 2-h bins. The data show that suvorexant does not show a clear additive effect in combination with CNO in regulating time spent in wake (left), NREM sleep (middle) and REM sleep (right) when co-administered to mice expressing Gq DREADDs in Lhx6+ neurons in the zona incerta in the first 2 h after administration. Data are mean ± s.e.m. *P < 0.05; two-way ANOVA followed by Sidak’s post hoc test, n = 10 mice.
Extended Data Figure 10. Additional data from AAV-DIO-hM4Di-injected Lhx6-cre mice.
Continued from Fig. 4. a, Schematics showing the construct of AAV-DIO-hM4Di–mCherry virus and the injection sites of virus into the zona incerta of Lhx6-cre mice. b, EEG analysis showing the percentage of time in 2-h bins spent in wake (top), NREM sleep (middle) and REM sleep (bottom) after injection of saline or CNO at ZT17 in hM4Di groups. c, Bout length quantification (top) showing duration of wake, NREM and REM episodes and bout count (bottom) showing sleep–wake transitions with saline or CNO injection in hM4Di groups. d, FFT analysis of EEG power spectrum frequency of NREM stage of CNO-injected AAV-DIO-hM4Di (blue) compared to control (saline-injection, red). e, Grouped EEG frequency data of spectrum band analysis between saline- (red) and CNO-injected (blue) hM4Di groups. f, FFT analysis of EEG power spectrum frequency of NREM stage of CNO-injected AAV-DIO-hM4Di (blue) compared to control (saline-injection, red). g, Grouped EEG frequency data of spectrum band analysis between saline- (red) and CNO-injected (blue) hM4Di groups. Data are mean ± s.e.m. *P < 0.05, **P < 0.01, ***P < 0.001; two-way ANOVA followed by Sidak’s post hoc test. n = 8 mice.
Acknowledgments
We thank L. de Lecea and A. Gittis for providing mice; M. Pletnikov for help with behavioural analysis; and M. Wu, V. Mongrain, R. Kuruvila, D. Lee, J. Bedont and W. Yap for comments on the manuscript. This work was supported by a Johns Hopkins Discovery Fund award to S.B. and S.H. S.P.B. is supported by a Klingenstein-Simons Foundation Fellowship in the Neurosciences.
Footnotes
Supplementary Information is available in the online version of the paper.
Author Contributions
K.L. and S.B. designed the study. K.L., D.W.K. and Y.S.Z. conducted immunostaining. C.L. conducted statistical analysis. J.K. and S.P.B. designed, conducted and analysed slice electrophysiology experiments. H.B., S.-A.L and J.S. performed rabies virus experiments. I.R.W. provided rabies virus. M.D. and V.P. generated Lhx6lox/lox mice. K.L. performed all other surgeries and behavioural analysis, with assistance from D.W.K. and E.K., under the guidance of S.H. K.L., D.W.K., J.K., S.H., S.P.B. and S.B. wrote the paper.
The authors declare no competing financial interests.
References
- 1.Weber F, Dan Y. Circuit-based interrogation of sleep control. Nature. 2016;538:51–59. doi: 10.1038/nature19773. [DOI] [PubMed] [Google Scholar]
- 2.Chemelli RM, et al. Narcolepsy in orexin knockout mice: molecular genetics of sleep regulation. Cell. 1999;98:437–451. doi: 10.1016/s0092-8674(00)81973-x. [DOI] [PubMed] [Google Scholar]
- 3.Saper CB, Fuller PM, Pedersen NP, Lu J, Scammell TE. Sleep state switching. Neuron. 2010;68:1023–1042. doi: 10.1016/j.neuron.2010.11.032. [DOI] [PMC free article] [PubMed] [Google Scholar]
- 4.Saito YC, et al. GABAergic neurons in the preoptic area send direct inhibitory projections to orexin neurons. Front. Neural Circuits. 2013;7:192. doi: 10.3389/fncir.2013.00192. [DOI] [PMC free article] [PubMed] [Google Scholar]
- 5.Mitrofanis J. Some certainty for the “zone of uncertainty”? Exploring the function of the zona incerta. Neuroscience. 2005;130:1–15. doi: 10.1016/j.neuroscience.2004.08.017. [DOI] [PubMed] [Google Scholar]
- 6.Liu J, et al. Frequency-selective control of cortical and subcortical networks by central thalamus. eLife. 2015;4:e09215. doi: 10.7554/eLife.09215. [DOI] [PMC free article] [PubMed] [Google Scholar]
- 7.Jurkowlaniec E, Trojniar W, Tokarski J. The EEG activity after lesions of the diencephalic part of the zona incerta in rats. Acta Physiol. Pol. 1990;41:85–97. [PubMed] [Google Scholar]
- 8.Shimogori T, et al. A genomic atlas of mouse hypothalamic development. Nat. Neurosci. 2010;13:767–775. doi: 10.1038/nn.2545. [DOI] [PMC free article] [PubMed] [Google Scholar]
- 9.Gong S, et al. A gene expression atlas of the central nervous system based on bacterial artificial chromosomes. Nature. 2003;425:917–925. doi: 10.1038/nature02033. [DOI] [PubMed] [Google Scholar]
- 10.Fogarty M, et al. Spatial genetic patterning of the embryonic neuroepithelium generates GABAergic interneuron diversity in the adult cortex. J. Neurosci. 2007;27:10935–10946. doi: 10.1523/JNEUROSCI.1629-07.2007. [DOI] [PMC free article] [PubMed] [Google Scholar]
- 11.Liodis P, et al. Lhx6 activity is required for the normal migration and specification of cortical interneuron subtypes. J. Neurosci. 2007;27:3078–3089. doi: 10.1523/JNEUROSCI.3055-06.2007. [DOI] [PMC free article] [PubMed] [Google Scholar]
- 12.Taniguchi H, et al. A resource of Cre driver lines for genetic targeting of GABAergic neurons in cerebral cortex. Neuron. 2011;71:995–1013. doi: 10.1016/j.neuron.2011.07.026. [DOI] [PMC free article] [PubMed] [Google Scholar]
- 13.Oh SW, et al. A mesoscale connectome of the mouse brain. Nature. 2014;508:207–214. doi: 10.1038/nature13186. [DOI] [PMC free article] [PubMed] [Google Scholar]
- 14.Wickersham IR, et al. Monosynaptic restriction of transsynaptic tracing from single, genetically targeted neurons. Neuron. 2007;53:639–647. doi: 10.1016/j.neuron.2007.01.033. [DOI] [PMC free article] [PubMed] [Google Scholar]
- 15.Venner A, Anaclet C, Broadhurst RY, Saper CB, Fuller PM. A novel population of wake-promoting GABAergic neurons in the ventral lateral hypothalamus. Curr. Biol. 2016;26:2137–2143. doi: 10.1016/j.cub.2016.05.078. [DOI] [PMC free article] [PubMed] [Google Scholar]
- 16.Veasey SC, Yeou-Jey H, Thayer P, Fenik P. Murine multiple sleep latency test: phenotyping sleep propensity in mice. Sleep. 2004;27:388–393. doi: 10.1093/sleep/27.3.388. [DOI] [PubMed] [Google Scholar]
- 17.Li Y, Gao XB, Sakurai T, van den Pol AN. Hypocretin/orexin excites hypocretin neurons via a local glutamate neuron-A potential mechanism for orchestrating the hypothalamic arousal system. Neuron. 2002;36:1169–1181. doi: 10.1016/s0896-6273(02)01132-7. [DOI] [PubMed] [Google Scholar]
- 18.Petreanu L, Mao T, Sternson SM, Svoboda K. The subcellular organization of neocortical excitatory connections. Nature. 2009;457:1142–1145. doi: 10.1038/nature07709. [DOI] [PMC free article] [PubMed] [Google Scholar]
- 19.Karnani MM, Szabó G, Erdélyi F, Burdakov D. Lateral hypothalamic GAD65 neurons are spontaneously firing and distinct from orexin- and melanin-concentrating hormone neurons. J. Physiol. 2013;591:933–953. doi: 10.1113/jphysiol.2012.243493. [DOI] [PMC free article] [PubMed] [Google Scholar]
- 20.Hu H, Ma Y, Agmon A. Submillisecond firing synchrony between different subtypes of cortical interneurons connected chemically but not electrically. J. Neurosci. 2011;31:3351–3361. doi: 10.1523/JNEUROSCI.4881-10.2011. [DOI] [PMC free article] [PubMed] [Google Scholar]
- 21.Skeldon AC, Dijk DJ, Derks G. Mathematical models for sleep–wake dynamics: comparison of the two-process model and a mutual inhibition neuronal model. PLoS ONE. 2014;9:e103877. doi: 10.1371/journal.pone.0103877. [DOI] [PMC free article] [PubMed] [Google Scholar]
- 22.Salvatierra J, et al. The LIM homeodomain factor Lhx2 is required for hypothalamic tanycyte specification and differentiation. J. Neurosci. 2014;34:16809–16820. doi: 10.1523/JNEUROSCI.1711-14.2014. [DOI] [PMC free article] [PubMed] [Google Scholar]
- 23.Armbruster BN, Li X, Pausch MH, Herlitze S, Roth BL. Evolving the lock to fit the key to create a family of G protein-coupled receptors potently activated by an inert ligand. Proc. Natl Acad. Sci. USA. 2007;104:5163–5168. doi: 10.1073/pnas.0700293104. [DOI] [PMC free article] [PubMed] [Google Scholar]
- 24.Hoyer D, et al. Distinct effects of IPSU and suvorexant on mouse sleep architecture. Front. Neurosci. 2013;7:235. doi: 10.3389/fnins.2013.00235. [DOI] [PMC free article] [PubMed] [Google Scholar]
- 25.Chung S, et al. Identification of preoptic sleep neurons using retrograde labelling and gene profiling. Nature. 2017;545:477–481. doi: 10.1038/nature22350. [DOI] [PMC free article] [PubMed] [Google Scholar]
- 26.Anaclet C, et al. The GABAergic parafacial zone is a medullary slow wave sleep-promoting center. Nat. Neurosci. 2014;17:1217–1224. doi: 10.1038/nn.3789. [DOI] [PMC free article] [PubMed] [Google Scholar]
- 27.Sherin JE, Shiromani PJ, McCarley RW, Saper CB. Activation of ventrolateral preoptic neurons during sleep. Science. 1996;271:216–219. doi: 10.1126/science.271.5246.216. [DOI] [PubMed] [Google Scholar]
- 28.Urbain N, Deschênes M. Motor cortex gates vibrissal responses in a thalamocortical projection pathway. Neuron. 2007;56:714–725. doi: 10.1016/j.neuron.2007.10.023. [DOI] [PubMed] [Google Scholar]
- 29.Humphreys BD, et al. Fate tracing reveals the pericyte and not epithelial origin of myofibroblasts in kidney fibrosis. Am. J. Pathol. 2010;176:85–97. doi: 10.2353/ajpath.2010.090517. [DOI] [PMC free article] [PubMed] [Google Scholar]
- 30.Peron SP, Freeman J, Iyer V, Guo C, Svoboda K. A cellular resolution map of barrel cortex activity during tactile behavior. Neuron. 2015;86:783–799. doi: 10.1016/j.neuron.2015.03.027. [DOI] [PubMed] [Google Scholar]
- 31.Rodríguez CI, et al. High-efficiency deleter mice show that FLPe is an alternative to Cre–loxP. Nat. Genet. 2000;25:139–140. doi: 10.1038/75973. [DOI] [PubMed] [Google Scholar]
- 32.Thompson CL, et al. Molecular and anatomical signatures of sleep deprivation in the mouse brain. Front. Neurosci. 2010;4:165. doi: 10.3389/fnins.2010.00165. [DOI] [PMC free article] [PubMed] [Google Scholar]
- 33.Lee JH, et al. Global and local fMRI signals driven by neurons defined optogenetically by type and wiring. Nature. 2010;465:788–792. doi: 10.1038/nature09108. [DOI] [PMC free article] [PubMed] [Google Scholar]
- 34.Paxinos GFK. The Mouse Brain in Sterotaxic Coordinates. 4. Academic; 2012. [Google Scholar]
- 35.Cox CD, et al. Discovery of the dual orexin receptor antagonist [(7R)-4-(5-chloro-1,3-benzoxazol-2-yl)-7-methyl-1,4-diazepan-1-yl][5-methyl-2-(2H-1,2,3-triazol-2-yl)phenyl]methanone (MK-4305) for the treatment of insomnia. J. Med. Chem. 2010;53:5320–5332. doi: 10.1021/jm100541c. [DOI] [PubMed] [Google Scholar]
- 36.Wickersham IR, Sullivan HA. Rabies viral vectors for monosynaptic tracing and targeted transgene expression in neurons. Cold Spring Harb. Protoc. 2015;2015:375–385. doi: 10.1101/pdb.prot072389. [DOI] [PubMed] [Google Scholar]
- 37.Wickersham IR, Sullivan HA, Seung HS. Production of glycoprotein-deleted rabies viruses for monosynaptic tracing and high-level gene expression in neurons. Nat. Protocols. 2010;5:595–606. doi: 10.1038/nprot.2009.248. [DOI] [PubMed] [Google Scholar]
- 38.Kohara K, et al. Cell type-specific genetic and optogenetic tools reveal hippocampal CA2 circuits. Nat. Neurosci. 2014;17:269–279. doi: 10.1038/nn.3614. [DOI] [PMC free article] [PubMed] [Google Scholar]
- 39.Miyamichi K, et al. Cortical representations of olfactory input by trans-synaptic tracing. Nature. 2011;472:191–196. doi: 10.1038/nature09714. [DOI] [PMC free article] [PubMed] [Google Scholar]
- 40.Subach FV, Piatkevich KD, Verkhusha VV. Directed molecular evolution to design advanced red fluorescent proteins. Nat. Methods. 2011;8:1019–1026. doi: 10.1038/nmeth.1776. [DOI] [PMC free article] [PubMed] [Google Scholar]
- 41.Kim J, Matney CJ, Blankenship A, Hestrin S, Brown SP. Layer 6 corticothalamic neurons activate a cortical output layer, layer 5a. J. Neurosci. 2014;34:9656–9664. doi: 10.1523/JNEUROSCI.1325-14.2014. [DOI] [PMC free article] [PubMed] [Google Scholar]
- 42.Blackshaw S, et al. Genomic analysis of mouse retinal development. PLoS Biol. 2004;2:E247. doi: 10.1371/journal.pbio.0020247. [DOI] [PMC free article] [PubMed] [Google Scholar]
Associated Data
This section collects any data citations, data availability statements, or supplementary materials included in this article.
Data Availability Statement
Source Data for all figures are provided with the online version of the paper.


