Abstract
Homeobox A1 (HOXA1) serves an oncogenic role in multiple cancer types. However, the role of HOXA1 in non-small cell lung cancer (NSCLC) remains unclear. In the present study, use of reverse transcription-quantitative polymerase chain reaction and the databases of The Cancer Genome Atlas (TCGA), Oncomine, Gene Expression Profiling Interactive Analysis and the Multi Experiment Matrix were combined to assess the expression of HOXA1 and its co-expressed genes in NSCLC. Bioinformatic analyses, such as Gene Ontology (GO), Kyoto Encyclopedia of Genes and Genomes (KEGG), and network and protein-protein interaction analyses, were used to investigate the underlying molecular mechanism effected by the co-expressed genes. Additionally, the potential miRNAs targeting HOXA1 were investigated. The results showed that HOXA1 was upregulated in NSCLC. The area under the curve of HOXA1 indicated a moderate diagnostic value of the HOXA1 level in NSCLC. According to GO and KEGG analyses, the co-expressed genes may be involved in 'dGTP metabolic processes', 'network-forming collagen trimers', 'centromeric DNA binding' and 'the p53 signaling pathway'. Three miRNAs (miR-181b-5p, miR-28-5p and miR-181d-5p) targeting HOXA1 were each predicted by 10 algorithms; miR-181b and miR-181d levels were downregulated in LUSC tissues compared with those in normal lung tissues based on data from the TCGA database, and inverse correlations were found between HOXA1 and miR-181b (r=−0.205, P<0.001) and miR-181d (r=−0.106, P=0.020). We speculate that HOXA1 may be the direct target of miR-181b-5p or miR-181d-5p in LUSC, and HOXA1 may serve a significant role in NSCLC by regulating various pathways, particularly the p53 signaling pathway. However, the detailed mechanism should be verified by functional experiments.
Keywords: homeobox A1, NSCLC, RT-qPCR, GO, KEGG, PPI
Introduction
According to the latest data, lung cancer is the most common cancer worldwide and a leading cause of tumor-related mortality (1,2). Lung cancer causes almost 1.4 million mortalities each year all over the world (3,4). According to histological type, lung cancer is divided into two categories: Small-cell lung cancer (SCLC) and non-SCLC (NSCLC). NSCLC makes up 80–85% of all lung cancer cases (5). The majority of the newly diagnosed NSCLC cases are at an advanced stage, with a low 5-year survival rate (6). Hence, it is worthwhile to investigate the possible molecular mechanisms involved in NSCLC tumorigenesis and progression.
HOXA1, also known as BSAS, HOX1 or HOX1F, serves vital roles in multiple cancer types, including cervical, breast and esophageal cancer (7–9). HOXA1 is involved in the proliferation, migration and invasion of different cancer types, including esophageal cancer (9), prostate cancer (10) and NSCLC (11). Zhan et al (11) found that HOXA1 could act as the direct target of let-7c in NSCLC, and let-7c could inhibit the proliferation and tumorigenesis of NSCLC cells via partial targeting of HOXA1. Li et al (9) found that the high expression of miR-30b could downregulate HOXA1 to inhibit the growth, migration and invasion of esophageal cancer cells. Several studies have shown the clinical role of HOXA1 in NSCLC. For example, Zha et al (12) found that HOXA1 was overexpressed in hepatocellular carcinoma (HCC), and high HOXA1 expression was positively associated with the T classification, N classification, distant metastasis and the clinical stage of HCC patients. Additionally, the overexpression of HOXA1 associated with a shorter overall survival time. Yuan et al (13) found that HOXA1 expression was positively associated with the development and clinical prognosis of gastric cancer. These findings suggest that HOXA1 could act as a novel prognostic biomarker in gastric cancer.
The present study sought to investigate the expression of HOXA1 in NSCLC and normal lung tissue based on reverse transcription-quantitative polymerase chain reaction (RT-qPCR). Furthermore, The Cancer Genome Atlas (TCGA), Oncomine, Gene Expression Profiling Interactive Analysis (GEPIA) and Multi Experiment Matrix (MEM) databases were used to assess the expression and the clinical role of HOXA1 in NSCLC. Bioinformatic analyses, including Gene Ontology (GO), Kyoto Encyclopedia of Genes and Genomes (KEGG), network and protein-protein interaction (PPI) analyses, were implemented to investigate the potential functions, pathways and networks of the co-expressed genes (14–16). Additionally, 12 miRNA target prediction algorithms were applied to predict the potential miRNAs targeting HOXA1.
Materials and methods
RT-qPCR
A total of 53 NSCLC patients, including 31 lung adenocarcinoma (LUAD) patients and 22 lung squamous cell carcinoma (LUSC) patients, were enrolled from the Department of Pathology, First Affiliated Hospital of Guangxi Medical University (Nanning, Guangxi, China). All 53 samples were randomly collected from patients undergoing surgical resection without treatment. All methods were applied according to the relevant guidelines. The Ethics Committee of the First Affiliated Hospital of Guangxi Medical University approved the experimental protocols, and all patients provided written informed consent forms for the use of their tissues in this study. Total RNA was extracted via TRIzol reagent (Thermo Fisher Scientific, Inc., Waltham, MA, USA), and a PCR amplification kit (Omega, Solarbio Biotechnologies, Inc., Shanghai, China) was used. The RNA was reverse-transcribed into cDNA using Roche cDNA Synthesis kit (Roche Diagnostics, Shanghai, China), based on the manufacturer's protocols. qPCR was performed using ABI 7500 prepstation (Applied Biosystems; Thermo Fisher Scientific, Inc.), and the SYBR®-Green PCR Master mix (GeneCore Biotechnologies, Inc., Shanghai, China). PCR was performed at 95°C for 15 sec, 60°C for 1 min, 95°C for 15 sec and 60°C for 1 min for 40 cycles. The specific primers were as follows: HOXA1 forward, 5′-CGGCTTCCTGTGCTAAGTCT-3′ and reverse, 5′-TAGCCCAGCCAAATACACGG-3′; and GAPDH (internal control) forward, 5-′TGCACCACCAACTGCTTA-3′ and reverse, 5′-GGATGCAGGGATGATGTTC-3′. The results were normalized to the GAPDH expression and calculated based on the 2−ΔΔCq method (17,18).
Validation of the expression of HOXA1 in NSCLC
TCGA (http://cancergenome.nih.gov/) has collected comprehensive molecular profiles, including gene expression, microRNA expression, protein expression and DNA methylation, for >30 types of human tumors (19–21). TCGA also has information about complex clinical parameters. In the present study, the RNA-Seq data for patients with NSCLC, which were from the Illumina HiSeq RNA-Seq platform (Illumina, Inc., San Diego, CA, USA), contained 535 LUAD cases and 502 LUSC cases up to July 1, 2017 (21). The expression data of HOXA1 are reported in reads per million, and the HOXA1 expression level was normalized by the R language package DESeq for further analysis. Student's t-test (SPSS Inc., Chicago, IL, USA) was used to compare differential expression of HOXA1 between NSCLC and normal lung tissues. Additionally, the potential associations between HOXA1 and the clinicopathological parameters in NSCLC were identified via the original TCGA database. The receiver operating characteristic (ROC) curve was derived to evaluate the diagnostic value of HOXA1. Oncomine (https://www.oncomine.org/) and GEPIA (http://gepia.cancer-pku.cn/) were applied to verify the HOXA1 expression in NSCLC (22,23).
Potential functions and pathways associated with HOXA1
To further investigate the genes co-expressed with HOXA1, MEM (http://biit.cs.ut.ee/mem/index.cgi), GEPIA and cBioPortal (http://www.cbioportal.org/) were used. The Venn diagrams (http://bioinformatics.psb.ugent.be/webtools/Venn/) were used to identify and compare the overlaps. Next, bioinformatic analyses, including GO, KEGG and network analyses, were utilized to investigate the potential functions, pathways and networks of these overlapping genes as previously described (24). In this process, the Database for Annotation, Visualization and Integrated Discovery (http://david.abcc.ncifcrf.gov/) was used for GO and KEGG analyses. Biological process, cellular component and molecular function were derived separately via GO analysis. A functional network was constructed through Cytoscape (version 2.8; http://cytoscape.org).
Construction of PPI network
The interaction pairs of the co-expressed genes were researched through the Search Tool for the Retrieval of Interacting Genes (STRING; version 9.0; http://string-db.org) (25). The STRING database aims to supply a global perspective for as many organisms as feasible. Known and predicted associations are integrated and scored. A combined score over 0.4 was chosen to construct the PPI network.
Prediction of targeting miRNAs
A total of 12 target prediction algorithms were used for predicting the potential miRNAs targeting HOXA1: miRWalk (http://zmf.umm.uni-heidelberg.de/apps/zmf/mirwalk2/), DIANA microT v4 (http://diana.imis.athena-innovation.gr/), miRanda (http://www.microrna.org), mirBridge (http://mirsystem.cgm.ntu.edu.tw/), miRDB (http://www.mirdb.org/), miRMap (http://mirmap.ezlab.org/), miRNAMap (http://mirnamap.mbc.nctu.edu.tw/), Pictar2 (https://www.mdc-berlin.de/), PITA (https://genie.weizmann.ac.il/), RNA22 (https://cm.jefferson.edu/) RNAhybrid (https://bibiserv.cebitec.uni-bielefeld.de/) and TargetScan (http://www.targetscan.org/). Candidate miRNAs were identified based on Venn diagrams.
Statistical analysis
All the original data from TCGA were log2-transformed. The mean ± standard deviation was calculated by SPSS 22.0 (IBM Corp., Armonk, NY, USA) to measure the HOXA1 expression level. Student's t-test was used to compare the differential expression of HOXA1 between NSCLC and normal lung tissues, as well as for the associations between HOXA1 expression and the clinicopathological parameters. One-way analysis of variance was applied to compare different subgroups. The Mann-Whitney U test or Kruskal-Wallis H test was utilized for non-normally distributed variables. The associations between HOXA1 expression and miRNA expression were assessed by Spearman's correlation. Mining for co-expressed genes across hundreds of datasets was performed through novel rank aggregation and visualization methods. Two-sided P-values of <0.05 were identified to indicate statistical significance.
Results
Clinical value of HOXA1 expression in NSCLC
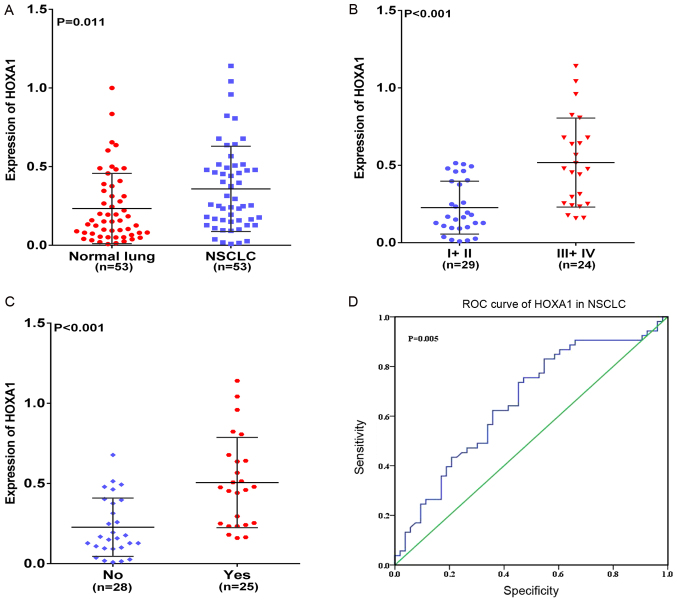
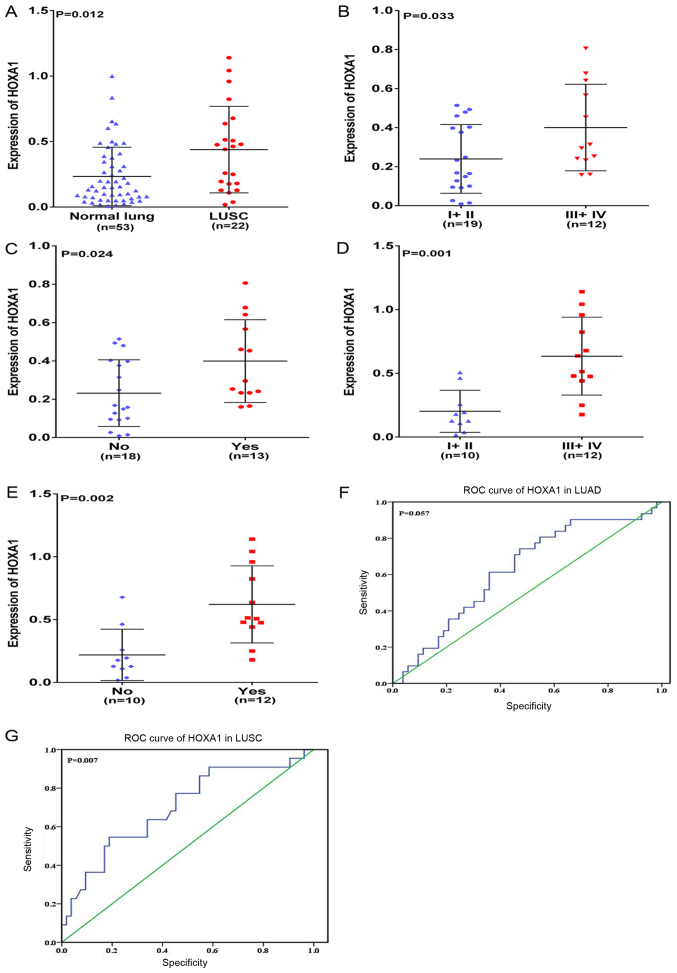
In the present study, HOXA1 mRNA was overexpressed in NSCLC compared with that in normal lung tissues (P=0.011; Fig. 1A). The associations between the expression of HOXA1 and different clinicopathological parameters were further investigated. HOXA1 expression was positively associated with advanced (stage III–IV) TNM, Tumor-Node-Metastasis (TNM) classification of malignant tumors (26) and presence of lymph node metastasis (LNM) (both P<0.001; Fig. 1B and C). No significant association was found between HOXA1 mRNA expression and any other clinicopathological parameter, including sex, tumor size and vascular invasion (Table I). In addition, the diagnostic value of the HOXA1 level in NSCLC was assessed by ROC curve, and the area under the curve (AUC) of HOXA1 was 0.656 [95% confidence interval (CI), 0.552–0.761; P=0.005; Fig. 1D). The expression of HOXA1 was also compared between LUAD and LUSC. The results were similar to those of NSCLC: HOXA1 was upregulated in LUSC (P=0.012; Fig. 2A), and HOXA1 expression was positively associated with the presence of LNM and an advanced TNM stage (III-IV, both P<0.05) in LUAD and LUSC (Fig. 2B–2E; Tables II and III). A moderate diagnostic value of the HOXA1 level was also found in LUAD (0.625; 95% CI, 0.502–0.748; P=0.057; Fig. 2F), although this was not significant, and in LUSC (0.700; 95% CI, 0.566–0.834; P=0.007; Fig. 2G). Comparison of HOXA1 expression between LUAD and LUSC tissues showed higher expression of HOXA1 in LUSC than LUAD.
Figure 1.
Clinical significance of HOXA1 in NSCLC based on reverse transcription-quantitative-polymerase chain reaction. Differential expression of HOXA1 in (A) NSCLC and non-cancerous lung tissue; (B) in NSCLC stage I+II vs. III+IV; and (C) in NSCLC with LNM vs. without LNM. (D) ROC curve of HOXA1 in NSCLC. HOXA1, homeobox A1; NSCLC, non-small cell lung cancer; ROC, receiver operating characteristic.
Table I.
Expression of HOXA1 and correlations with clinicopathological parameters in NSCLC based on reverse transcription-quantitative polymerase chain reaction.
| Clinicopathological-features | n | HOXA1 expression (2−∆∆Cq)
|
||
|---|---|---|---|---|
| Fold-change | T-value | P-value | ||
| Tissues | ||||
| Normal lung | 53 | 1.00 | 2.589 | 0.011 |
| NSCLC | 53 | 1.57 | ||
| Pathology | ||||
| LUAD | 31 | 1.30 | −1.714 | 0.096 |
| LUSC | 22 | 1.91 | ||
| Size, cm | ||||
| ≤3 | 15 | 1.22 | −1.679 | 0.100 |
| >3 | 38 | 1.70 | ||
| TNM | ||||
| I–II | 29 | 1 | −4.366 | <0.001 |
| III–IV | 24 | 2.26 | ||
| Sex | ||||
| Male | 40 | 1.57 | −0.154 | 0.878 |
| Female | 13 | 1.61 | ||
| Age, years | ||||
| <60 | 33 | 1.70 | 1.193 | 0.238 |
| ≥60 | 20 | 1.30 | ||
| Smoking | ||||
| No | 29 | 1.61 | 0.271 | 0.787 |
| Yes | 24 | 1.52 | ||
| Vascular invasion | ||||
| No | 48 | 1.52 | −0.620 | 0.538 |
| Yes | 5 | 1.87 | ||
| LNM | ||||
| No | 28 | 1 | −4.323 | <0.001 |
| Yes | 25 | 2.22 | ||
| Grade | ||||
| I | 5 | 1.43 | 0.154a | 0.858 |
| II | 38 | 1.60 | ||
| III | 10 | 1.39 | ||
F-value. NSCLC, non-small cell lung cancer; HOXA1, homeobox A1; LUAD, lung adenocarcinoma; LUSC, lung squamous cell carcinoma; TNM, TNM, Tumor-Node-Metastasis; LNM, lymph node metastasis.
Figure 2.
Clinical significance of HOXA1 in LUAD and LUSC based on reverse transcription-quantitative-polymerase chain reaction. Differential expression of HOXA1 (A) in LUSC and non-cancerous lung tissue; (B) in LUAD stage I+II vs. III+IV; (C) in LUAD with LNM vs. without LNM; (D) in LUSC stage I+II vs. III+IV; and (E) in LUSC with LNM vs. without LNM. (F) ROC curve of HOXA1 in LUAD. (G) ROC curve of HOXA1 in LUSC. LUAD, lung adenocarcinoma; LUSC, lung squamous cell carcinoma; HOXA1, homeobox A1; ROC, receiver operating characteristic.
Table II.
Expression of HOXA1 and associations with clinicopathological parameters in LUAD based on reverse transcription-quantitative polymerase chain reaction.
| Clinicopathological-features | n | HOXA1 expression (2−∆∆Cq)
|
||
|---|---|---|---|---|
| Fold-change | T-value | P-value | ||
| Tissues | ||||
| Normal lung | 53 | 1.00 | 1.387 | 0.169 |
| LUAD | 31 | 1.291 | ||
| Size, cm | ||||
| ≤3 | 9 | 1.090 | −0.795 | 0.433 |
| >3 | 22 | 1.372 | ||
| TNM | ||||
| I–II | 19 | 1.026 | −2.236 | 0.033 |
| III–IV | 12 | 1.709 | ||
| Sex | ||||
| Male | 23 | 1.214 | −0.812 | 0.423 |
| Female | 8 | 1.509 | ||
| Age, years | ||||
| <60 | 19 | 1.444 | 1.221 | 0.232 |
| ≥60 | 12 | 1.047 | ||
| Smoking | ||||
| No | 17 | 1.440 | 1.033 | 0.310 |
| Yes | 14 | 1.111 | ||
| Vascular invasion | ||||
| No | 29 | 1.300 | 0.176 | 0.861 |
| Yes | 2 | 1.184 | ||
| LNM | ||||
| No | 18 | 0.991 | 0.279 | 0.024 |
| Yes | 13 | 1.705 | ||
| Grade | ||||
| I | 5 | 1.406 | 0.318a | 0.730 |
| II | 23 | 1.316 | ||
| III | 3 | 0.906 | ||
F-value. HOXA1, homeobox A1; LUAD, lung adenocarcinoma; TNM, TNM, Tumor-Node-Metastasis; LNM, lymph node metastasis.
Table III.
Expression of HOXA1 and associations with clinicopathological parameters in LUSC based on reverse transcription-quantitative polymerase chain reaction.
| Clinicopathological-features | n | HOXA1 expression (2−∆∆Cq)
|
||
|---|---|---|---|---|
| Fold-change | T-value | P-value | ||
| Tissues | ||||
| Normal lung | 53 | 1.00 | −2.666 | 0.012 |
| LUSC | 22 | 1.872 | ||
| Size, cm | ||||
| ≤3 | 6 | 1.342 | −1.087 | 0.290 |
| >3 | 16 | 2.073 | ||
| TNM | ||||
| I–II | 10 | 0.863 | −4.009 | 0.001 |
| III–IV | 12 | 2.714 | ||
| Sex | ||||
| Male | 17 | 1.932 | 0.341 | 0.736 |
| Female | 5 | 1.679 | ||
| Age, years | ||||
| <60 | 14 | 2.000 | 0.547 | 0.591 |
| ≥60 | 8 | 1.654 | ||
| Smoking | ||||
| No | 12 | 1.761 | −0.404 | 0.690 |
| Yes | 10 | 2.009 | ||
| Vascular invasion | ||||
| No | 19 | 1.809 | −0.525 | 0.605 |
| Yes | 3 | 2.278 | ||
| LNM | ||||
| No | 10 | 0.936 | −3.535 | 0.002 |
| Yes | 12 | 2.654 | ||
| Grade | ||||
| I | 0 | – | 0.417 | 0.526 |
| II | 15 | 1.407 | ||
| III | 7 | 1.585 | ||
HOXA1, homeobox A1; LUSC, lung squamous cell carcinoma; TNM, TNM, Tumor-Node-Metastasis; LNM, lymph node metastasis.
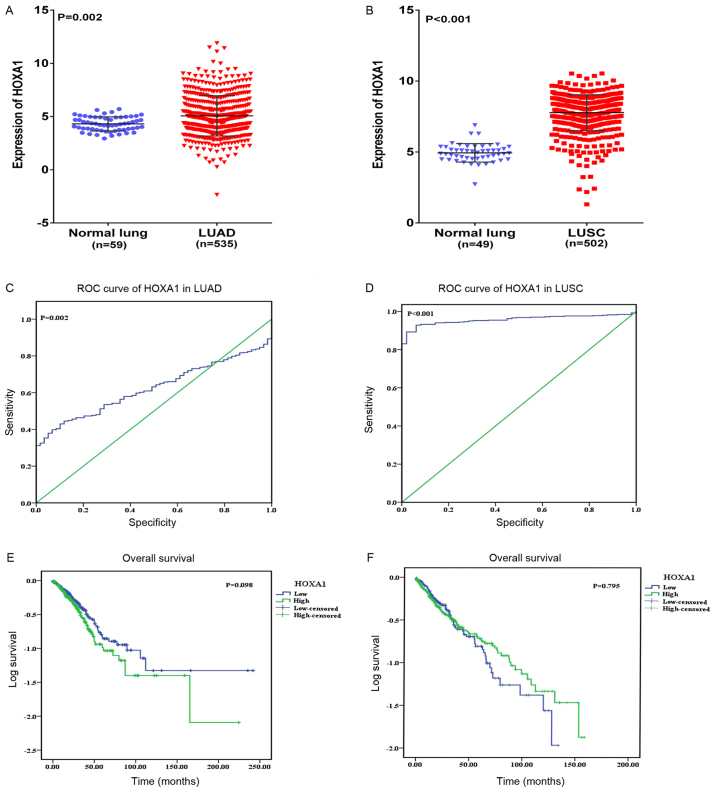
To further research the differential expression of HOXA1 between NSCLC and non-cancerous lung tissues, original patient data was obtained from TCGA. Two NSCLC cohorts, which comprised i) 535 LUAD cases and 59 normal lung cases, and ii) 502 LUSC cases and 49 normal lung cases, were extracted. As a result, increased expression of HOXA1 was observed in LUAD and LUSC compared with that in normal lung tissues (both P<0.05; Fig. 3A and B). Regarding the clinicopathological parameters, no statistical significance was reached based on the TCGA database (Tables IV and V). The AUC of HOXA1 was 0.548 (95% CI, 0.498–0.599; P=0.002) for LUAD and 0.957 (95% CI, 0.940–0.974; P<0.001) for LUSC based on TCGA, which indicated a high diagnostic value of the HOXA1 level in LUSC (Fig. 3C and D). With regard to overall survival, no statistical significance was determined; a trend was observed in which low HOXA1 expression was associated with an increased survival time (97.11±11.49 months) compared with high HOXA1 expression (75.15±9.68 months) (P=0.098; Fig. 3E) in LUAD, and the opposite trend was noted in LUSC (P=0.795; Fig. 3F), indicating that high HOXA1 expression may be associated with increased survival time of NSCLC patients.
Figure 3.
Clinical significance of HOXA1 in LUAD and LUSC based on The Cancer Genome Atlas database. Differential expression of HOXA1 in (A) LUAD and non-cancerous lung tissue; and (B) in LUSC and non-cancerous lung tissue. (C) ROC curve of HOXA1 in LUAD. (D) ROC curve of HOXA1 in LUSC. (E) Kaplan-Meier curves of HOXA1 expression in LUAD. Patients with high HOXA1 expression had a significantly poorer prognosis (75.15±9.68 months) compared with those with low expression (97.11±11.49 months). (F) Kaplan-Meier curves of HOXA1 expression in LUSC. Patients with high HOXA1 expression had a significantly better prognosis (71.05±4.81 months) compared with those with low expression (66.79±6.53 months). LUAD, lung adenocarcinoma; LUSC, lung squamous cell carcinoma; HOXA1, homeobox A1; ROC, receiver operating characteristic.
Table IV.
Expression of HOXA1 and associations with clinico-pathological parameters in LUAD based on The Cancer Genome Atlas.
| Clinicopathological features | na | HOXA1 expression
|
||
|---|---|---|---|---|
| Mean ± SD | T-value | P-value | ||
| Tissues | ||||
| Normal lung | 59 | 4.308±0.087 | 3.153 | 0.002 |
| LUAD | 535 | 5.079±0.081 | ||
| Age, years | ||||
| <60 | 136 | 5.268±1.922 | 1.037 | 0.300 |
| ≥60 | 357 | 4.52±2.419 | ||
| Sex | ||||
| Male | 236 | 5.092±1.951 | −0.326 | 0.745 |
| Female | 276 | 5.146±1.789 | ||
| Ethnicity | ||||
| White | 387 | 5.128±1.898 | 0.656b | 0.519 |
| Black | 52 | 5.011±1.963 | ||
| Asian | 7 | 4.341±1.475 | ||
| T | ||||
| T1+T2 | 444 | 5.118±1.842 | 0.036 | 0.971 |
| T3+T4 | 65 | 5.110±2.024 | ||
| N | ||||
| NX | 11 | 5.459±1.481 | 2.970b | 0.052 |
| N0–N1 | 425 | 5.034±1.809 | ||
| N2–N3 | 75 | 5.583±2.150 | ||
| M | ||||
| MX | 140 | 5.061±1.819 | 0.541b | 0.582 |
| M0 | 343 | 5.170±1.865 | ||
| M1 | 25 | 4.809±2.087 | ||
| Stage | ||||
| I+II | 395 | 5.053±1.791 | −1.765 | 0.078 |
| III+IV | 109 | 5.410±2.112 | ||
Total number of patients is not always 535, as the clinical data of certain subgroups was missing.
F-value. HOXA1, homeobox A1; LUAD, lung adenocarcinoma; T, umor; N, node; M, metastasis; SD, standard deviation.
Table V.
Expression of HOXA1 and associations with clinico-pathological parameters in LUSC based on The Cancer Genome Atlas.
| Clinicopathological features | na | HOXA1 expression
|
||
|---|---|---|---|---|
| Mean ± SD | T-value | P-value | ||
| Tissues | ||||
| Normal lung | 49 | 4.942±0.652 | −25.988 | <0.001 |
| LUSC | 502 | 7.774±1.268 | ||
| Ethnicity | ||||
| White | 349 | 7.776±1.289 | 1.751b | 0.175 |
| Asian | 9 | 7.120±1.692 | ||
| Black | 30 | 8.031±1.163 | ||
| Age, years | ||||
| ≥60 | 213 | 7.798±1.247 | 0.403 | 0.688 |
| <60 | 44 | 7.711±1.585 | ||
| Sex | ||||
| Male | 371 | 7.833±1.199 | 1.759 | 0.079 |
| Female | 130 | 7.606±1.438 | ||
| Stage | ||||
| I–II | 406 | 7.780±1.244 | 0.419 | 0.675 |
| III–IV | 91 | 7.718±1.392 | ||
| T | ||||
| T1–T2 | 407 | 7.817±1.211 | 1.593 | 0.112 |
| T3–T4 | 94 | 7.586±1.481 | ||
| N | ||||
| N0–N1 | 450 | 7.761±1.273 | 0.390b | 0.677 |
| N2–N3 | 45 | 7.925±1.155 | ||
| NX | 6 | 7.611±1.760 | ||
| M | ||||
| M0 | 411 | 7.765±1.237 | 0.013b | 0.986 |
| M1 | 5 | 7.837±1.034 | ||
| MX | 79 | 7.783±1.475 | ||
Total number of patients is not always 502, as the clinical data of certain subgroups was missing.
F-value. HOXA1, homeobox A1; LUSC, lung squamous cell carcinoma; T, tumor; N, node; M, metastasis; SD, standard deviation.
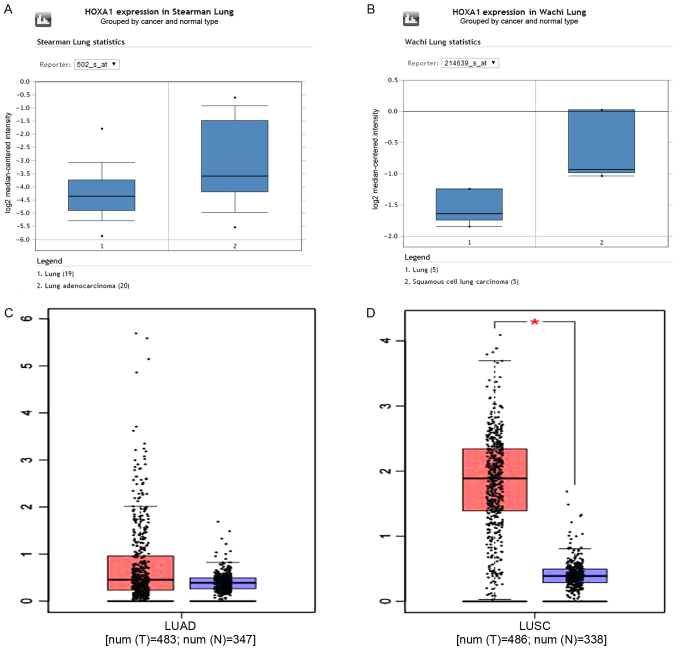
A total of 11 datasets [Hou Lung, Wachi Lung, Beer Lung, Stearman Lung, Garber Lung, Landi Lung, Bhattacharjee Lung, Su Lung, Talbot Lung, Selamat Lung and Okayama Lung (22)] in Oncomine were used to validate the HOXA1 expression. Bhattacharjee Lung showed an opposite trend to all other datasets, as HOXA1 expression was downregulated compared with that in the normal lung. The results from the other 10 datasets were consistent with the present RT-qPCR and TCGA findings (Fig. 4A and B). GEPIA was used to further confirm the high expression of HOXA1 in LUAD and LUSC compared with that in the non-cancerous lung tissues (Fig. 4C and D).
Figure 4.
Validation of HOXA1 expression based on the Oncomine and GEPIA databases for representative examples. (A) Normal lung tissues (n=19) and LUAD tissues (n=20) were included in the cohort of Stearman Lung based on the Oncomine database. (B) Normal lung tissues (n=5) and LUSC tissues (n=5) were included in the cohort of Wachi Lung based on the Oncomine database. (C) Normal lung tissues (n=347) and LUAD tissues (n=483) were included based on the GEPIA database. (D) Normal lung tissues (n=338) and LUSC tissues (n=486) were included based on the GEPIA database. LUAD, lung adenocarcinoma; LUSC, lung squamous cell carcinoma; HOXA1, homeobox A1; GEPIA, Gene Expression Profiling Interactive Analysis; T, tumor tissues; N, normal lung tissues.
Potential pathways associated with HOXA1
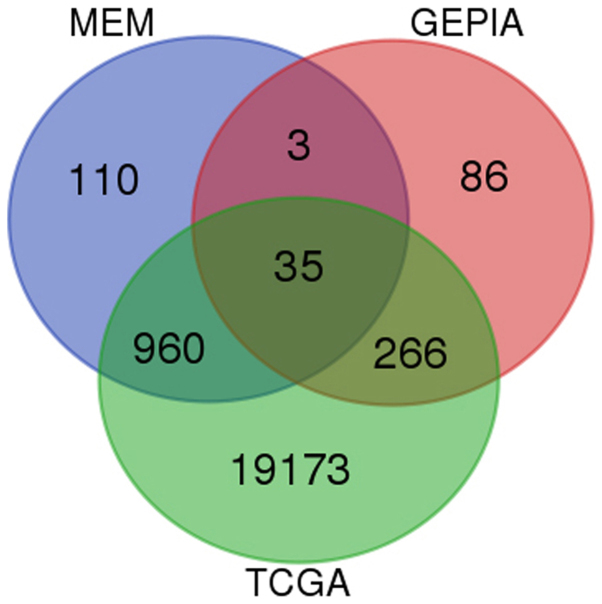
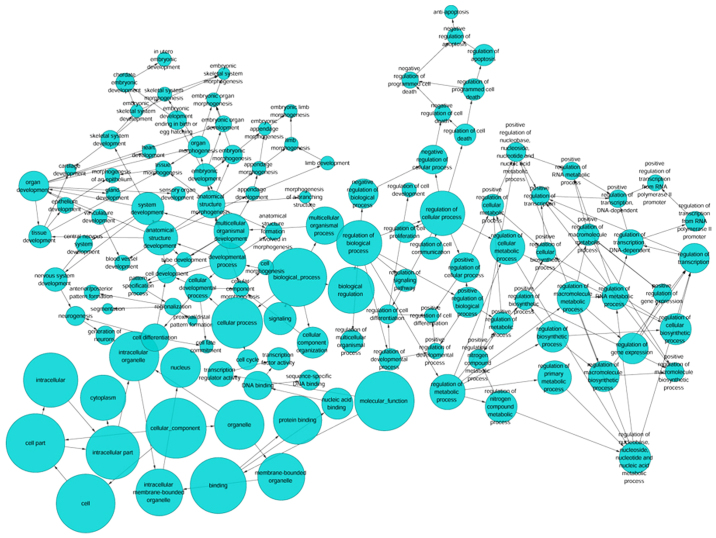
Based on GEPIA, TCGA and MEM, 1,264 overlapping co-expressed genes were selected (Fig. 5) for GO and KEGG pathway analyses. The strongly enriched GO functional terms were 'dGTP metabolic process', 'network-forming collagen trimer' and 'centromeric DNA binding' (Fig. 6; Table VI). The KEGG pathway most strongly associated with the HOXA1 co-expressed genes was 'the p53 signaling pathway' (Table VII). Altogether, the GO and KEGG pathway analyses indicated that HOXA1 may be associated with the biological mechanism of NSCLC.
Figure 5.
Venn diagrams for the genes co-expressed with homeobox A1. Based on GEPIA, TCGA and MEM databases, 1,264 co-expressed genes were found. GEPIA, Gene Expression Profiling Interactive Analysis; TGCA, The Cancer Genome Atlas; MEM, Multi Experiment Matrix.
Figure 6.
A functional network of GO terms for the genes co-expressed with homeobox A1 in non-small cell lung cancer. GO analysis was performed using the overlapping genes, and a functional network was constructed to further reflect the functions of these genes. GO, Gene Ontology.
Table VI.
Top 10 enriched GO terms (BP, CC, and MF) of the genes co-expressed with homeobox A1.
| GO ID | Term | Ontology | Count | Fold enrichment | P-value |
|---|---|---|---|---|---|
| GO:0002159 | Desmosome assembly | BP | 3 | 11.270307 | 0.024213 |
| GO:0046070 | dGTP metabolic process | BP | 3 | 11.270307 | 0.024213 |
| GO:0015014 | Heparan sulfate proteoglycan biosynthetic process, polysaccharide chain biosynthetic process | BP | 3 | 11.270307 | 0.024213 |
| GO:0002934 | Desmosome organization | BP | 7 | 10.518953 | 0.000014 |
| GO:0002138 | Retinoic acid biosynthetic process | BP | 4 | 10.018050 | 0.005034 |
| GO:0003150 | Muscular septum morphogenesis | BP | 4 | 10.018050 | 0.005034 |
| GO:0046602 | Regulation of mitotic centrosome separation | BP | 3 | 9.016245 | 0.038591 |
| GO:0009217 | Purine deoxyribonucleoside triphosphate catabolic process | BP | 3 | 9.016245 | 0.038591 |
| GO:1901490 | Regulation of lymphangiogenesis | BP | 3 | 9.016245 | 0.038591 |
| GO:0002568 | Somatic diversification of T cell receptor genes | BP | 3 | 9.016245 | 0.038591 |
| GO:0000942 | Condensed nuclear chromosome outer kinetochore | CC | 3 | 10.830268 | 0.026117 |
| GO:0035985 | Senescence-associated heterochromatin focus | CC | 3 | 10.830268 | 0.026117 |
| GO:0005587 | Collagen type IV trimer | CC | 4 | 9.626905 | 0.005634 |
| GO:0098642 | Network-forming collagen trimer | CC | 4 | 8.251633 | 0.009355 |
| GO:0098645 | Collagen network | CC | 4 | 8.251633 | 0.009355 |
| GO:0098651 | Basement membrane collagen trimer | CC | 4 | 7.220179 | 0.014205 |
| GO:0031616 | Spindle pole centrosome | CC | 4 | 5.776143 | 0.027431 |
| GO:0000778 | Condensed nuclear chromosome kinetochore | CC | 4 | 5.251039 | 0.035817 |
| GO:0000940 | Condensed chromosome outer kinetochore | CC | 4 | 4.813453 | 0.045359 |
| GO:0030057 | Desmosome | CC | 8 | 4.620915 | 0.001182 |
| GO:0019834 | Phospholipase A2 inhibitor activity | MF | 3 | 11.38088 | 0.023761 |
| GO:0019237 | Centromeric DNA binding | MF | 4 | 8.671148 | 0.008147 |
| GO:0004859 | Phospholipase inhibitor activity | MF | 7 | 8.17089 | 0.000092 |
| GO:0086083 | Cell adhesive protein binding involved in bundle of His cell-Purkinje myocyte communication | MF | 3 | 7.587255 | 0.054384 |
| GO:0004064 | Arylesterase activity | MF | 3 | 7.587255 | 0.054384 |
| GO:0017002 | Activin-activated receptor activity | MF | 3 | 6.503361 | 0.072879 |
| GO:0003696 | Satellite DNA binding | MF | 3 | 6.503361 | 0.072879 |
| GO:0045294 | α-catenin binding | MF | 4 | 6.069804 | 0.024071 |
| GO:0016595 | Glutamate binding | MF | 4 | 6.069804 | 0.024071 |
| GO:0055102 | Lipase inhibitor activity | MF | 7 | 5.901198 | 0.000749 |
GO, Gene Ontology; BP, biological process; CC, cellular component; MF, molecular function.
Table VII.
Top 10 KEGG pathway enrichment results of the genes co-expressed with homeobox A1.
| KEGG ID | KEGG term | Count | Fold enrichment | P-value |
|---|---|---|---|---|
| hsa04115 | p53 signaling pathway | 17 | 3.803218 | 0.000005 |
| hsa04520 | Adherens junction | 16 | 3.377838 | 0.000051 |
| hsa04512 | ECM-receptor interaction | 19 | 3.273493 | 0.000012 |
| hsa03430 | Mismatch repair | 5 | 3.258512 | 0.062662 |
| hsa05222 | Small cell lung cancer | 17 | 2.997831 | 0.000125 |
| hsa04666 | FcγR-mediated phagocytosis | 16 | 2.855077 | 0.000369 |
| hsa04110 | Cell cycle | 22 | 2.659366 | 0.000059 |
| hsa04350 | TGF-β signaling pathway | 14 | 2.498192 | 0.003421 |
| hsa04330 | Notch signaling pathway | 8 | 2.498192 | 0.038016 |
| hsa05217 | Basal cell carcinoma | 9 | 2.452771 | 0.027883 |
KEGG, Kyoto Encyclopedia of Genes and Genomes.
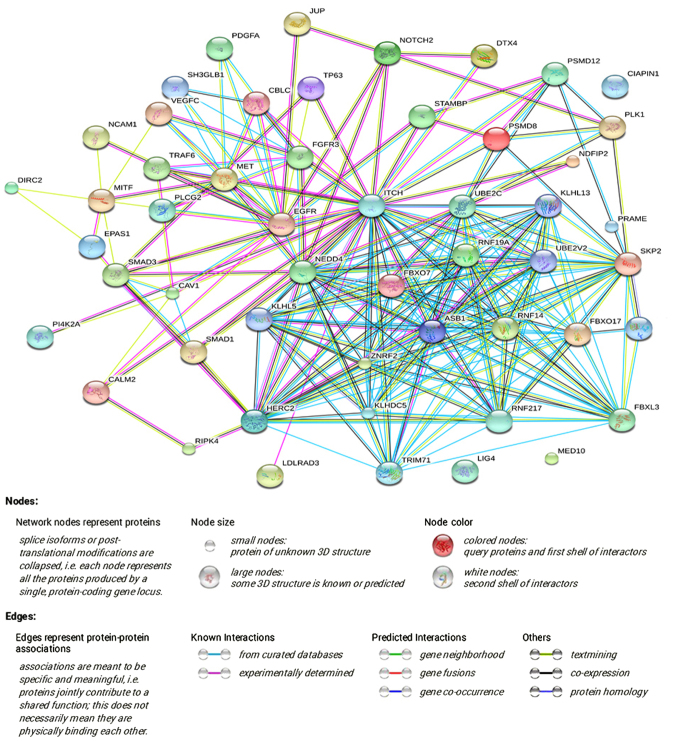
A PPI network was constructed via STRING online, and a total of 3,250 PPI pairs with a combined score of >0.4 were noted. The map of the PPI network that involved 908 PPI pairs was chosen for further analysis, and its connectivity degree was >30 (Fig. 7). Trifunctional purine biosynthetic protein adenosine-3 (GART; degree=71) had the highest degree and most interactions, according to the PPI network.
Figure 7.
PPI network of the co-expressed genes. The PPI network was constructed via the Search Tool for the Retrieval of Interacting Genes online, and 908 PPI pairs with a connectivity degree of >30 were chosen for further analysis. PPI, protein-protein interaction.
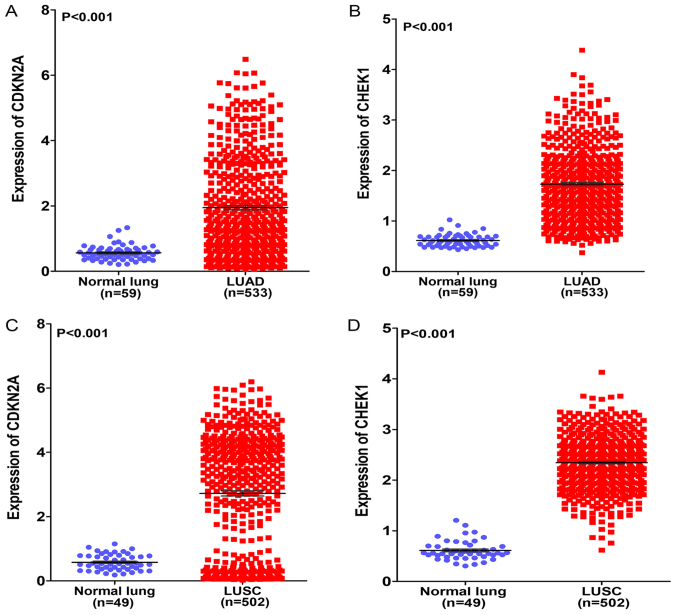
A total of 17 genes (ZMAT3, CYCS, CHEK1, CDK6, SFN, SESN3, CCNB1, CCNE1, TP53I3, CDKN2A, CCNB2, CCND2, SERPINB5, DDB2, PERP, IGFBP3 and GADD45A) associated with the p53 signaling pathway were flagged by KEGG pathway analysis, and 4 genes (CDKN2A, RAD51, CHEK1 and GART) had a degree of connectivity of >50 in the PPI network. The genes shared in common by these two lists were cyclin-dependent kinase inhibitor 2A (CDKN2A) and checkpoint kinase 1 (CHEK1). The expression of the two genes in the original TCGA data was investigated and it was found that each was highly expressed in LUAD and LUSC compared with that in normal lung tissues (both P<0.001; Fig. 8A–D). Based on these results, we hypothesized that HOXA1 serves a vital role in NSCLC by co-expressing with CDKN2A and CHEK1.
Figure 8.
Differential expression of CDKN2A and CHEK1 in LUAD and LUSC based on The Cancer Genome Atlas database. (A) Differential expression of CDKN2A between LUAD and normal lung tissue. (B) Differential expression of CHEK1 between LUAD and normal lung tissue. (C) Differential expression of CDKN2A between LUSC and normal lung tissue. (D) Differential expression of CHEK1 between LUSC and normal lung tissue. CDKN2A, cyclin-dependent kinase inhibitor 2A; CHEK1, checkpoint kinase 1; LUAD, lung adenocarcinoma; LUSC, lung squamous cell carcinoma.
Prediction of target miRNAs
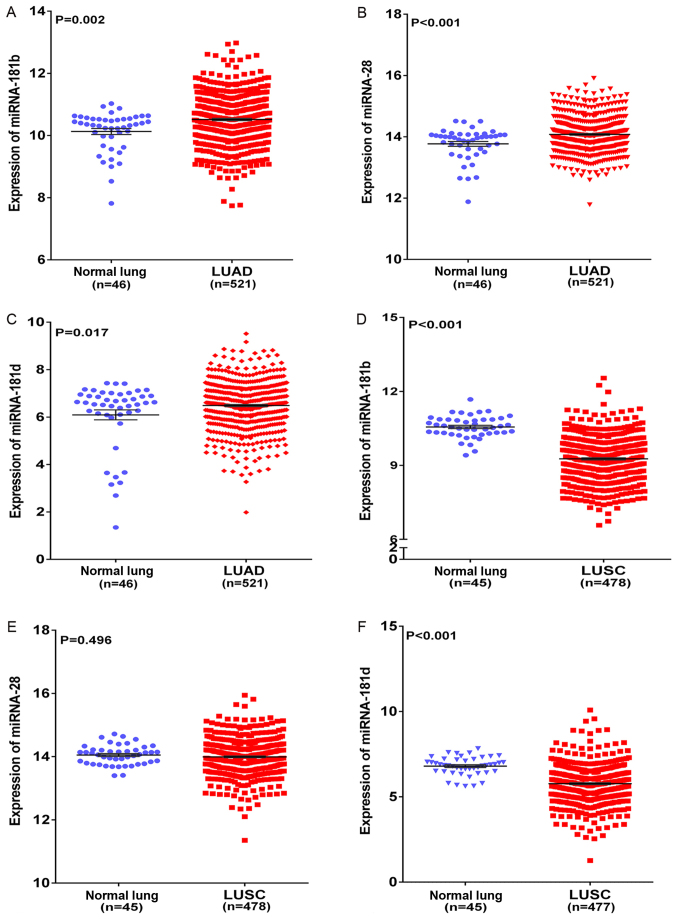
In the present study, 12 target prediction algorithms were used to predict the potential miRNAs that targeted HOXA1. The miRNAs predicted by >10 algorithms were selected as the final candidate miRNAs. A total of 3 miRNAs (miR-181b-5p, miR-28-5p, miR-181d-5p) targeting HOXA1 were predicted by the 10 algorithms. Based on TCGA, miR-181b, miR-28 and miR-181d levels were found to be significantly upregulated in LUAD compared with those in non-cancerous lung tissues (all P<0.05; Fig. 9A–C). miR-181b and miR-181d levels were found to be significantly downregulated in LUSC, whereas miR-28 level was found to exhibit no significant difference in LUSC and normal lung tissues (Fig. 9D–F). Furthermore, the correlation between HOXA1 and these three miRNAs in NSCLC was compared using Spearman-test based on TCGA, and it was found that HOXA1 mRNA level was inversely correlated with miR-181b and miR-181d in both LUAD and LUSC (both P<0.05; Table VIII). However, miR-28 level was inversely correlated with HOXA1 mRNA level in LUAD (r=−0.010, P=0.827) and positively correlated in LUSC (r=0.057, P=0.216) (Table VIII). Since miR-181b and miR-181d expression was downregulated in LUSC tissues and inversely correlated with HOXA1 expression, we speculate that HOXA1 may be the direct target of miR-181b-5p or miR-181d-5p in LUSC, and may serve a significant role in NSCLC by regulating various pathways, particularly the p53 signaling pathway. However, the detailed mechanism should be verified by functional experiments.
Figure 9.
Differential expression of miRNAs in LUAD and LUSC based on The Cancer Genome Atlas database. (A) Differential expression of miR-181b between LUAD and non-cancerous lung tissue. (B) Differential expression of miR-28 between LUAD and non-cancerous lung tissue. (C) Differential expression of miR-181d between LUAD and non-cancerous lung tissue. (D) Differential expression of miR-181b between LUSC and non-cancerous lung tissue. (E) Differential expression of miR-28 between LUSC and non-cancerous lung tissue. (F) Differential expression of miR-181d between LUSC and non-cancerous lung tissue. LUAD, lung adenocarcinoma; LUSC, lung squamous cell carcinoma; miR/miRNA, microRNA.
Table VIII.
Correlations between homeobox A1 and three miRNAs (miR-181b, miR-28 and miR-181d) in non-small cell lung cancer based on The Cancer Genome Atlas.
| Cancer type | r | P-value |
|---|---|---|
| LUAD | ||
| miR-181b | −0.104 | 0.018 |
| miR-28 | −0.010 | 0.827 |
| miR-181d | −0.158 | <0.001 |
| LUSC | ||
| miR-181b | −0.205 | <0.001 |
| miR-28 | 0.057 | 0.216 |
| miR-181d | −0.106 | 0.020 |
LUAD, lung adenocarcinoma; LUSC, lung squamous cell carcinoma; miR/miRNA, microRNA.
Discussion
In the present study, RT-qPCR, TCGA, MEM, Oncomine and GEPIA were used to investigate the expression, clinical significance and possible functions or pathways of HOXA1 in NSCLC. It was found that HOXA1 was overexpressed in NSCLC based on the RT-qPCR, TCGA and GEPIA data. The ROC curve was utilized to evaluate the association between HOXA1 expression and diagnostic value, and the AUC of HOXA1 confirmed the moderate diagnostic value of HOXA1 in NSCLC. HOXA1 was confirmed as a tumorigenic gene, and high HOXA1 expression was associated with TNM stage and LNM. According to GO and KEGG analyses, the strongly enriched GO functional terms were 'dGTP metabolic process', 'network-forming collagen trimer' and 'centromeric DNA binding', and the HOXA1 co-expressed genes were significantly associated with 'the p53 signaling pathway'.
Several studies have investigated the effect of HOXA1 in NSCLC. Abe et al (27) detected the expression levels of 39 HOX genes in 41 human NSCLC and normal lung tissues by RT-qPCR, and found that HOXA1 was highly expressed in NSCLC tissues and was upregulated in LUSC compared with that in LUAD. Similarly, the present study quantified the HOXA1 expression level in 53 NSCLC tissues and 53 normal lung tissues and found similar results on HOXA1 expression. Additionally, these expression findings were verified via other databases and the molecular mechanisms of HOXA1 action were predicted by GO and KEGG analyses. Abe et al (27) hypothesized that HOX genes are involved in the histologically aberrant diversity, which would explain the different HOXA1 expression in LUAD and LUSC. Zhan et al (11) found that HOXA1 could act as the direct target of let-7c in NSCLC, and that let-7c could inhibit the proliferation and tumorigenesis of NSCLC cells via partial targeting of HOXA1. The present study found that miR-181b and miR-181d were downregulated in LUSC tissues and that HOXA1 mRNA expression was inversely correlated with miR-181b and miR-181d levels based on TCGA. We speculate that HOXA1 may be the direct target of miR-181b-5p or miR-181d-5p in LUSC and that it may serve a significant role in NSCLC in combination with these miRNAs. However, the detailed mechanism of its activity should be verified by functional experiments.
Based on KEGG analysis, the p53 signaling pathway was the most strongly enriched pathway term. The p53 signaling pathway could serve a vital role in NSCLC, but no studies on HOXA1 and p53 signaling could be found in the global literature. Liu et al (28) found that p53 was the most commonly mutated gene in NSCLC, being mutated in 45–70% of LUAD samples and 60–80% of LUSC samples. Normally, p53 is located in the cytoplasm, but it translocates to the nucleus following phosphorylation by various kinases upon cellular stress (29). Phosphorylated nuclear p53 binds to different proteins to stimulate apoptosis (30–32). In addition to its effect on apoptosis, several studies have demonstrated the effect of p53 signaling on proliferation, migration, invasion and prognosis (33–35). We hypothesized that HOXA1 serves a significant role in NSCLC via the p53 signaling pathway, but the detailed mechanism of HOXA1 in NSCLC requires determining. To test this hypothesis, we plan to apply a variety of approaches, including cell proliferation, migration, invasion and apoptosis assays, and animal models, in future studies. The clinical significance and the molecular mechanism of HOXA1 in the biological function of NSCLC will be investigated at the molecular, cellular, tissue and animal levels. The findings of the present study with regard to HOXA1 provide a novel biomarker or therapeutic target for NSCLC.
Acknowledgments
Not applicable.
Abbreviations
- NSCLC
non-small-cell lung cancer
- RT-qPCR
reverse transcription-quantitative polymerase chain reaction
- TCGA
The Cancer Genome Atlas
- MEM
Multi Experiment Matrix
- GO
Gene Ontology
- KEGG
Kyoto Encyclopedia of Genes and Genomes
- PPI
protein-protein interaction
- LUAD
lung adenocarcinoma
- LUSC
lung squamous cell carcinoma
- AUC
area under the curve
- ROC
receiver operating characteristic
- STRING
Search Tool for the Retrieval of Interacting Genes
- TNM
Tumor-Node-Metastasis
- LNM
lymph node metastasis
- HCC
hepatocellular carcinoma
- GEPIA
Gene Expression Profiling Interactive Analysis
Funding
The present study was supported by the National Natural Science Foundation of China (grant nos. NSFC81560469 and NSFC81360327), the Natural Science Foundation of Guangxi, China (grant nos. 2015GXNSFCA139009 and 2017GXNSFAA198016), the Guangxi Medical University Training Program for Distinguished Young Scholars (no. 2017) and the Medical Excellence Award funded by the Creative Research Development Grant from the First Affiliated Hospital of Guangxi Medical University.
Availability of data and materials
Data used in this study are available on request to the corresponding author.
Authors' contributions
YZ and XL contributed equally as co-first authors, and DL and GC contributed equally as co-corresponding authors of this paper. YZ, XL and XW contributed to the design of the study, data collection, analysis and drafting of the manuscript. TZ, YQ, DL and GC contributed to the design of the study, interpretation of the data and drafting the manuscript. All authors read and approved the final manuscript.
Ethics approval and consent to participate
The Ethics Committee of the First Affiliated Hospital of Guangxi Medical University approved the experimental protocols, and all patients provided written informed consent forms for the use of their tissues in this study.
Consent for publication
Consent for publication of non-identifiable data was waived by the Clinical Safety and Quality Unit of the First Affiliated Hospital of Guangxi Medical University.
Competing interests
The authors declare that they have no competing interests.
References
- 1.Navaranjan G, Berriault C, Do M, Villeneuve PJ, Demers PA. Cancer incidence and mortality from exposure to radon progeny among Ontario uranium miners. Occup Environ Med. 2016;73:838–845. doi: 10.1136/oemed-2016-103836. [DOI] [PubMed] [Google Scholar]
- 2.Xu G, Chen J, Pan Q, Huang K, Pan J, Zhang W, Chen J, Yu F, Zhou T, Wang Y. Long noncoding RNA expression profiles of lung adenocarcinoma ascertained by microarray analysis. PLoS One. 2014;9:e104044. doi: 10.1371/journal.pone.0104044. [DOI] [PMC free article] [PubMed] [Google Scholar]
- 3.Hu X, Shi S, Wang H, Yu X, Wang Q, Jiang S, Ju D, Ye L, Feng M. Blocking autophagy improves the anti-tumor activity of afatinib in lung adenocarcinoma with activating EGFR mutations in vitro and in vivo. Sci Rep. 2017;7:4559. doi: 10.1038/s41598-017-04258-8. [DOI] [PMC free article] [PubMed] [Google Scholar]
- 4.Kordiak J, Czarnecka KH, Pastuszak-Lewandoska D, Antczak A, Migdalska-Sęk M, Nawrot E, Domańska-Senderowska D, Kiszałkiewicz J, Brzeziańska-Lasota E. Small suitability of the DLEC1, MLH1 and TUSC4 mRNA expression analysis as potential prognostic or differentiating markers for NSCLC patients in the Polish population. J Genet. 2017;96:227–234. doi: 10.1007/s12041-017-0770-2. [DOI] [PubMed] [Google Scholar]
- 5.Jemal A, Siegel R, Ward E, Hao Y, Xu J, Thun MJ. Cancer statistics, 2009. CA Cancer J Clin. 2009;59:225–249. doi: 10.3322/caac.20006. [DOI] [PubMed] [Google Scholar]
- 6.Chen G, Umelo IA, Lv S, Teugels E, Fostier K, Kronenberger P, Dewaele A, Sadones J, Geers C, De Grève J. miR-146a inhibits cell growth, cell migration and induces apoptosis in non-small cell lung cancer cells. PLoS One. 2013;8:e60317. doi: 10.1371/journal.pone.0060317. [DOI] [PMC free article] [PubMed] [Google Scholar]
- 7.Wang X, Li Y, Qi W, Zhang N, Sun M, Huo Q, Cai C, Lv S, Yang Q. MicroRNA-99a inhibits tumor aggressive phenotypes through regulating HOXA1 in breast cancer cells. Oncotarget. 2015;6:32737–32747. doi: 10.18632/oncotarget.5355. [DOI] [PMC free article] [PubMed] [Google Scholar]
- 8.López-Romero R, Marrero-Rodríguez D, Romero-Morelos P, Villegas V, Valdivia A, Arreola H, Huerta-Padilla V, Salcedo M. The role of developmental HOX genes in cervical cancer. Rev Med Inst Mex Seguro Soc. 2015;53(Suppl 2):S188–S193. In Spanish. [PubMed] [Google Scholar]
- 9.Li Q, Zhang X, Li N, Liu Q, Chen D. miR-30b inhibits cancer cell growth, migration, and invasion by targeting homeobox A1 in esophageal cancer. Biochem Biophys Res Commun. 2017;485:506–512. doi: 10.1016/j.bbrc.2017.02.016. [DOI] [PubMed] [Google Scholar]
- 10.Wang H, Liu G, Shen D, Ye H, Huang J, Jiao L, Sun Y. HOXA1 enhances the cell proliferation, invasion and metastasis of prostate cancer cells. Oncol Rep. 2015;34:1203–1210. doi: 10.3892/or.2015.4085. [DOI] [PubMed] [Google Scholar]
- 11.Zhan M, Qu Q, Wang G, Liu YZ, Tan SL, Lou XY, Yu J, Zhou HH. Let-7c inhibits NSCLC cell proliferation by targeting HOXA1. Asian Pac J Cancer Prev. 2013;14:387–392. doi: 10.7314/APJCP.2013.14.1.387. [DOI] [PubMed] [Google Scholar]
- 12.Zha TZ, Hu BS, Yu HF, Tan YF, Zhang Y, Zhang K. Overexpression of HOXA1 correlates with poor prognosis in patients with hepatocellular carcinoma. Tumour Biol. 2012;33:2125–2134. doi: 10.1007/s13277-012-0472-6. [DOI] [PubMed] [Google Scholar]
- 13.Yuan C, Zhu X, Han Y, Song C, Liu C, Lu S6, Zhang M, Yu F, Peng Z, Zhou C. Elevated HOXA1 expression correlates with accelerated tumor cell proliferation and poor prognosis in gastric cancer partly via cyclin D1. J Exp Clin Cancer Res. 2016;35:15. doi: 10.1186/s13046-016-0294-2. [DOI] [PMC free article] [PubMed] [Google Scholar]
- 14.Xu X, Wang X, Fu B, Meng L, Lang B. Differentially expressed genes and microRNAs in bladder carcinoma cell line 5637 and T24 detected by RNA sequencing. Int J Clin Exp Pathol. 2015;8:12678–12687. [PMC free article] [PubMed] [Google Scholar]
- 15.Subramanian Y, Kaliyappan K, Ramakrishnan KS. Facile hydrothermal synthesis and characterization of Co2GeO4/r-GO@C ternary nanocomposite as negative electrode for Li-ion batteries. J Colloid Interface Sci. 2017;498:76–84. doi: 10.1016/j.jcis.2017.03.005. [DOI] [PubMed] [Google Scholar]
- 16.Fu L, Xu Y, Hou Y, Qi X, Zhou L, Liu H, Luan Y, Jing L, Miao Y, Zhao S, et al. Proteomic analysis indicates that mitochondrial energy metabolism in skeletal muscle tissue is negatively correlated with feed efficiency in pigs. Sci Rep. 2017;7:45291. doi: 10.1038/srep45291. [DOI] [PMC free article] [PubMed] [Google Scholar]
- 17.Dai J, Wu H, Zhang Y, Gao K, Hu G, Guo Y, Lin C, Li X. Negative feedback between TAp63 and MiR-133b mediates colorectal cancer suppression. Oncotarget. 2016;7:87147–87160. doi: 10.18632/oncotarget.13515. [DOI] [PMC free article] [PubMed] [Google Scholar]
- 18.Wu H, Zhou J, Zeng C, Wu D, Mu Z, Chen B, Xie Y, Ye Y, Liu J. Curcumin increases exosomal TCF21 thus suppressing exosome-induced lung cancer. Oncotarget. 2016;7:87081–87090. doi: 10.18632/oncotarget.13499. [DOI] [PMC free article] [PubMed] [Google Scholar]
- 19.Bornstein S, Schmidt M, Choonoo G, Levin T, Gray J, Thomas CR, Jr, Wong M, McWeeney S. IL-10 and integrin signaling pathways are associated with head and neck cancer progression. BMC Genomics. 2016;17:38. doi: 10.1186/s12864-015-2359-6. [DOI] [PMC free article] [PubMed] [Google Scholar]
- 20.Li Y, Kang K, Krahn JM, Croutwater N, Lee K, Umbach DM, Li L. A comprehensive genomic pan-cancer classification using The Cancer Genome Atlas gene expression data. BMC Genomics. 2017;18:508. doi: 10.1186/s12864-017-3906-0. [DOI] [PMC free article] [PubMed] [Google Scholar]
- 21.Zeng JH, Xiong DD, Pang YY, Zhang Y, Tang RX, Luo DZ, Chen G. Identification of molecular targets for esophageal carcinoma diagnosis using miRNA-seq and RNA-seq data from The Cancer Genome Atlas: A study of 187 cases. Oncotarget. 2017;8:35681–35699. doi: 10.18632/oncotarget.16051. [DOI] [PMC free article] [PubMed] [Google Scholar]
- 22.Rhodes DR, Kalyana-Sundaram S, Mahavisno V, Varambally R, Yu J, Briggs BB, Barrette TR, Anstet MJ, Kincead-Beal C, Kulkarni P, et al. Oncomine 3.0: Genes, pathways, and networks in a collection of 18,000 cancer gene expression profiles. Neoplasia. 2007;9:166–180. doi: 10.1593/neo.07112. [DOI] [PMC free article] [PubMed] [Google Scholar]
- 23.Tang Z, Li C, Kang B, Gao G, Li C, Zhang Z. GEPIA: A web server for cancer and normal gene expression profiling and interactive analyses. Nucleic Acids Res. 2017;45(W1):W98–W102. doi: 10.1093/nar/gkx247. [DOI] [PMC free article] [PubMed] [Google Scholar]
- 24.Colombo T, Farina L, Macino G, Paci P. PVT1: A rising star among oncogenic long noncoding RNAs. BioMed Res Int. 2015;2015:304208. doi: 10.1155/2015/304208. [DOI] [PMC free article] [PubMed] [Google Scholar]
- 25.Franceschini A, Szklarczyk D, Frankild S, Kuhn M, Simonovic M, Roth A, Lin J, Minguez P, Bork P, von Mering C, et al. STRING v9.1: Protein-protein interaction networks, with increased coverage and integration. Nucleic Acids Res. 2013;41(D1):D808–D815. doi: 10.1093/nar/gks1094. [DOI] [PMC free article] [PubMed] [Google Scholar]
- 26.Liu J, Zheng X, Deng H, Xu B, Chen L, Wang Q, Zhou Q, Zhang D, Wu C, Jiang J. Expression of CCR6 in esophageal squamous cell carcinoma and its effects on epithelial-to-mesenchymal transition. Oncotarget. 2017;8:115244–115253. doi: 10.18632/oncotarget.23318. [DOI] [PMC free article] [PubMed] [Google Scholar]
- 27.Abe M, Hamada J, Takahashi O, Takahashi Y, Tada M, Miyamoto M, Morikawa T, Kondo S, Moriuchi T. Disordered expression of HOX genes in human non-small cell lung cancer. Oncol Rep. 2006;15:797–802. [PubMed] [Google Scholar]
- 28.Liu G, Pei F, Yang F, Li L, Amin AD, Liu S, Buchan JR, Cho WC. Role of autophagy and apoptosis in non-small-cell lung cancer. Int J Mol Sci. 2017;18:18. doi: 10.3390/ijms18020367. [DOI] [PMC free article] [PubMed] [Google Scholar]
- 29.Kruse JP, Gu W. Modes of p53 regulation. Cell. 2009;137:609–622. doi: 10.1016/j.cell.2009.04.050. [DOI] [PMC free article] [PubMed] [Google Scholar]
- 30.Vousden KH, Lane DP. p53 in health and disease. Nat Rev Mol Cell Biol. 2007;8:275–283. doi: 10.1038/nrm2147. [DOI] [PubMed] [Google Scholar]
- 31.Green DR, Kroemer G. Cytoplasmic functions of the tumour suppressor p53. Nature. 2009;458:1127–1130. doi: 10.1038/nature07986. [DOI] [PMC free article] [PubMed] [Google Scholar]
- 32.Vaseva AV, Marchenko ND, Ji K, Tsirka SE, Holzmann S, Moll UM. p53 opens the mitochondrial permeability transition pore to trigger necrosis. Cell. 2012;149:1536–1548. doi: 10.1016/j.cell.2012.05.014. [DOI] [PMC free article] [PubMed] [Google Scholar]
- 33.Zhang HY, Yang W, Lu JB. Knockdown of GluA2 induces apoptosis in non-small-cell lung cancer A549 cells through the p 53 signaling pathway. Oncol Lett. 2017;14:1005–1010. doi: 10.3892/ol.2017.6234. [DOI] [PMC free article] [PubMed] [Google Scholar]
- 34.Li XJ, Li ZF, Wang JJ, Han Z, Liu Z, Liu BG. Effects of microRNA-374 on proliferation, migration, invasion, and apoptosis of human SCC cells by targeting Gadd45a through P53 signaling pathway. Biosci Rep. 2017;37:BSR20170710. doi: 10.1042/BSR20170710. [DOI] [PMC free article] [PubMed] [Google Scholar] [Retracted]
- 35.Fan M, Shen J, Liu H, Wen Z, Yang J, Yang P, Liu K, Chang Y, Duan J, Lu K. Downregulation of PRRX1 via the p53-dependent signaling pathway predicts poor prognosis in hepatocellular carcinoma. Oncol Rep. 2017;38:1083–1090. doi: 10.3892/or.2017.5785. [DOI] [PubMed] [Google Scholar]
Associated Data
This section collects any data citations, data availability statements, or supplementary materials included in this article.
Data Availability Statement
Data used in this study are available on request to the corresponding author.


