Abstract
The present study aimed to understand the roles of hepcidin and iron metabolism in the onset of prostate cancer. The prostate cancer LNCap, PC3 and DU145 cell lines were transfected with small interfering RNA (siRNA) targeting hepcidin to knockdown hepcidin expression in LNCap, PC3 and DU145 cells. The expression levels of hepcidin in prostate cancer and normal prostate RWPE-1cells were detected by western blot analysis. Exogenous hepcidin was added into the hepcidin-silenced cell lines. Intracellular iron levels were detected using a fluorescence assay, and the proliferative and migratory capacities of cells were detected using the MTT and wound-healing assays, respectively. The apoptotic rate was measured using flow cytometry, and changes in the expression of the iron-export protein ferroportin on the cell membrane were detected by western blot analysis. Hepcidin expression in prostate cancer cells was significantly higher than that of normal prostate cells (P<0.05). Furthermore, the iron levels of hepcidin-silenced cells (hepcidin−ve groups) were significantly lower than those in the cells treated with exogenous hepcidin (hepcidin+ve groups) (P<0.05). The proliferative capacity of the hepcidin+ve cells significantly exceeded those of the hepcidin−ve groups (P<0.05) and increased over time. In the wound-healing assay, the number of hepcidin+ve cells present within the scratch sites increased compared with hepcidin−ve cells, indicating a higher migration rate. Additionally, the expression of ferroportin in the hepcidin−ve groups significantly exceeded that in the hepcidin+ve groups (P<0.05). Hepcidin is involved in the onset of prostate cancer, most likely by reducing ferroportin expression and increasing intracellular iron levels to enhance the proliferation, migration and anti-apoptotic capacities of cancer cells.
Keywords: hepcidin, iron, metabolism, prostate cancer
Introduction
Prostate cancer is a common male malignancy, and the second-leading cause of all cancer mortalities in men (1,2). Iron metabolism serves an important role in the growth, angiogenesis and metastasis of prostate cancer (3,4). Iron is trace element necessary for that is extensively involved in the growth and metabolism of the human body, as well as facilitating oxygen transport, exchange and tissue respiration (5,6). Iron has been widely considered to be the basic substance for the maintenance of tumor cell growth and development (7). Tumor progression can be affected by regulating the iron metabolism and reducing intracellular iron utilization, which may be a suitable strategy for anticancer therapy (8,9).
Hepcidin is a hormone-regulating molecule that is synthesized and secreted by liver cells and serves a vital role in maintaining the in vivo iron metabolic balance (10,11). Hepcidin exerts core regulatory effects on iron metabolism by reducing the release of intracellular free iron in the reticuloendothelial system and negatively regulating the metabolic balance of iron by decreasing its absorption in the duodenum (12). The mechanism of action of hepcidin has been investigated using animal models and patients with abnormal iron metabolism. Hepcidin-knockdown mice undergo iron overload, and mice and patients overexpressing hepcidin exhibit iron deficiency (13). Hepcidin expression in patients with cancer, and its role in iron metabolism, has attracted considerable attention (14,15). Hepcidin, which is regulated by its receptor ferroportin, transports intracellular free iron into the extracellular fluid (16). With low ferroportin expression, tumor cells produce additional free iron, making them more invasive (17).
The mechanism by which hepcidin is involved in prostate cancer remains unclear. In the present study, the roles of hepcidin and iron metabolism in the onset of prostate cancer were evaluated in vitro, aiming to provide valuable evidence for concerning hepcidin and its potential as a novel therapy target.
Materials and methods
Cell lines and reagents
The prostate cancer LNCap, PC3 and DU145 cell lines were purchased from the Type Culture Collection of the Chinese Academy of Sciences (Shanghai, China). The prostate cell line RWPE-1 was purchased from JRDUN Biotechnology Co., Ltd. (Shanghai, China). Minimum essential medium (MEM) and fetal bovine serum (FBS) were obtained from Hyclone; GE Healthcare Life Sciences (Logan, UT, USA). Penicillin and streptomycin were obtained from North China Pharmaceutical Co., Ltd. (Shijiazhuang, China). Trypsin and dimethyl sulfoxide were provided by Sigma-Aldrich; Merck KGaA (Darmstadt, Germany). The ELISA kit, hepcidin protein and ferroportin antibodies were purchased from Newgen Biotech USA Inc. (Dallas, TX, USA). Lipofectamine® 2000 reagent was obtained from Invitrogen; Thermo Fischer Scientific, Inc. (Waltham, MA, USA).
Cell culture
LNCap, PC3 and DU145 cells were cultured in MEM containing 10% FBS, 1% penicillin and 1% streptomycin, placed in an incubator at 37°C with 5% CO2 and saturated humidity, and passaged when ~85% confluence was reached.
Cell transfection
LNCap, PC3 and DU145 cells were digested, counted, inoculated into 6-well plates at a density of 2.5×10⁵ cells/well and incubated at 37°C with 5% CO2 and saturated humidity until 80–90% confluence was reached. Next, the cells were transfected with small interfering RNA (siRNA) using Lipofectamine® 2000 transfection reagent. siRNAs were synthesized by Invitrogen (Thermo Fisher Scientific, Inc.); siRNA2 was synthesized to knock down hepcidin expression and siRNA1 was injected as the negative control. The sequences of the siRNA were as follows: SiRNA2 sense, 5′-UGGUAUUUCCUAGGGUACAdTdT-3′ and antisense, 5′-UGUACCCUAGGAAAUACUAdTdT-3′; siRNA1 sense, 5′-CUUACGCUGAGUACUUCGAdTdT-3′ and antisense, 5′-UCGAAGUACUCAGCGUAAGdTdT-3′, with a final siRNA concentration of 20 µl transfected. The culture medium was replaced with complete medium following incubation of the transfected cells for 4 h, and prostate cancer cell lines in which hepcidin gene was silenced were obtained through screening and passage. After 48 h, protein was extracted for western blot analysis.
Western blot analysis
Cells were lysed using radioimmunoprecipitation assay buffer [50 mM (pH 7.5) Tris-HCl, 150 mM NaCl, 1% NP-40, 0.5% sodium deoxycholate, 0.1% SDS], ultrasonicated and centrifuged at 12,000 × g and 4°C for 10 min. Protein concentration was determined with the bicinchoninic acid assay. Each sample (50 µg/lane) was resolved by 10% SDS-PAGE, followed by transfer onto a nitrocellulose membrane. Next, the membrane was blocked with 5% skimmed milk at room temperature for 1 h. Membranes were incubated with hepcidin-25 (1:500; Abcam, Cambridge, MA, USA) and β-actin (1:5,000; Sigma-Aldrich; Merck KGaA) primary antibodies overnight at 4°C, followed by horseradish peroxidase-conjugated goat anti-rabbit IgG secondary antibody (1:1,000; Origene Technologies, Inc., Beijing, China) at 37°C for 1 h. Membranes were scanned following development with an enhanced chemiluminescence substrate kit (Shanghai Yeasen Biotechnology Co., Ltd., Shanghai, China). The relative expression of protein was analyzed by densitometry analysis using Quanity-One 1-D analysis software (version 4.6.9; Bio-Rad Laboratories, Inc., Hercules, CA, USA) following internal reference calibration.
Detection of intracellular iron levels by fluorescence assay
siRNA targeted at hepcidin (si-hepcidin)-transfected LNCap, PC3 and DU145 cells were digested with trypsin and collected following centrifugation at 12,000 × g and 4°C for 10 min, with the concentrations adjusted to 1×10⁶/ml. Subsequently, the cells were divided into the hepcidin+ve (which contained and addition of 500 nM exogenous hepcidin; Newgen Biotech USA Inc., TX, USA) and hepcidin−ve groups. Viable cells were fluorescently detected with Calcein-AM (Shanghai Yeasen Biotechnology Co., Ltd.). Calcein-AM was added to the cells and incubated at 37°C for 5 min, washed with 20 mM HEPES buffer containing 1 mg/ml bovine serum albumin (Shanghai Yeasen Biotechnology Co., Ltd.) and resuspended with Hank's balanced salt solution buffer (Shanghai Yeasen Biotechnology Co., Ltd.). Fluorescence (X) was measured with a microplate reader. The iron chelator 2,2-bipyridyl (100 mM; Shanghai Yeasen Biotechnology Co., Ltd.) was added to the cell suspension and incubated at 37°C for 30 min to measure the resulting fluorescence (Y). The iron level in the cuvette was the difference between the two fluorescence values (Y-X).
Detection of cell proliferation by the MTT assay
si-hepcidin-transfected LNCap, PC3 and DU145 cells were digested and counted, with the concentrations adjusted to 1.5×10⁵/ml. Next, the cells were divided into exogenous hepcidin-treated (hepcidin+ve) and hepcidin-knockdown (hepcidin−ve) groups, inoculated into 6-well plates, incubated for 24 h, digested, centrifuged and inoculated into 96-well plates following adjustment of the final concentrations to 1×10⁵ cells/ml (100 µl each well). MTT assay was performed on days 1, 2, 3 and 4 respectively. Briefly, 5 mg/ml MTT solution was added to the plates (20 µl/well) for 4 h. The supernatant was subsequently discarded and DMSO (150 µl/well) was added to dissolve the purple formazan. Absorbance (A) value was measured at 460 nm with a microplate reader. The survival rate was calculated as follows:
Survival rate (%)=A460 of experimental group/A460 of control group × 100.
Detection of in vitro cell migration by the scratch method
si-hepcidin-transfected LNCap, PC3 and DU145 cells were divided into the hepcidin+ve and hepcidin−ve groups. Following incubation for 24 h, the cells were digested with trypsin, pipetted and dispersed into single-cell suspensions, with the densities adjusted to 4×10⁵ cells/ml. The cells were then seeded into 6-well plates (2 ml each well). When cells reached 80–90% confluence, a straight line was scratched uniformly on the 6-well plate with a 10-µl pipette tip. Afterwards, the detached cells were washed off with PBS and cultured in a medium (Minimum Essential Media) containing 1% FBS. Images of the fixed scratch sites were captured using a light microscope (magnification, ×200) at 0 and 24 h to record the cell confluence. The experiment was repeated three times.
Detection of cell apoptosis
si-hepcidin-transfected and LNCap, PC3 and DU145 cells were digested, counted, seeded into 6-well plates (1.5×10⁵/ml) and divided into the hepcidin+ve and hepcidin−ve groups. Following culture for 48 h at 37°C, the culture medium was discarded, and the cells were washed with and resuspended in PBS following trypsin digestion. According to the protocol of the Annexin V-fluorescein isothiocyanate/propidium iodide (FITC/PI) apoptosis detection kit (Shanghai Qianchen Biotechnology Co., Ltd., Shanghai, China), 500 µl binding buffer was added to each tube to suspend the cells. Subsequently, the cells were mixed with 5 µl Annexin V-FITC and 5 µl PI and incubated at room temperature in the dark for 15 min prior to detection of apoptosis with the BD FACSAria II flow cytometer (BD Biosciences, Franklin Lakes, NJ, USA).
Statistical analysis
All experiments were performed in triplicate. All data were analyzed by SPSS 22.0 (IBM Corp., Armonk, NY, USA) and expressed as the mean ± standard deviation. Two groups were compared using Student's t-test, and multiple comparisons were conducted by one-way analysis of variance (ANOVA). In the case of homogeneity of variance, overall comparisons were performed with using ANOVA and multiple comparisons were conducted using the Bonferroni method. P<0.05 was considered to indicate a statistically significant difference.
Results
Hepcidin gene-silenced prostate cancer cell lines are constructed
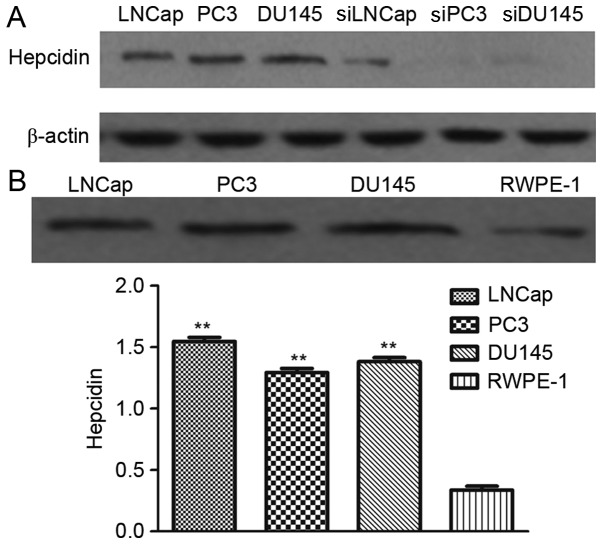
Western blot analysis revealed that the prostate cancer cell lines transfected with si-hepcidin had weak protein bands, whereas the untransfected cells had strong bands (Fig. 1A). Therefore, hepcidin gene-silenced prostate cancer cell lines were successfully established.
Figure 1.
Construction of hepcidin-silenced prostate cancer cells and detection of hepcidin expression. (A) Western blotting results for untransfected and transfected prostate cancer cells. Transfected prostate cancer cells had weak protein bands but untransfected ones had strong bands. (B) Hepcidin protein expression detected by western blotting. Hepcidin expression in prostate cancer cells was significantly higher than that in normal prostate cells, but different prostate cancer cells had similar expression levels. **P<0.01 compared with the normal prostate cells. si, cell lines transfected with small interfering RNAs targeting hepcidin.
Hepcidin expression in prostate cancer cells exceeds that in normal prostate cells
Hepcidin expression in prostate cancer LNCap, PC3 and DU145 cells and that in the normal prostate cells RWPE-1 after 48 h of culture as detected by western blot analysis. The relative hepcidin protein expression in LNCap, PC3, DU145 and RWPE-1 cells (relative to β-actin) was 1.51±0.12, 1.33±0.11, 1.46±0.15 and 0.39±0.03, respectively (Fig. 1B), indicating that the expression in prostate cancer cells was significantly higher than that in normal prostate cells (P<0.05). However, the expression levels of hepcidin in different prostate cancer cell lines were not significantly different (P>0.05).
Addition of exogenous hepcidin following gene silencing increases the intracellular iron levels
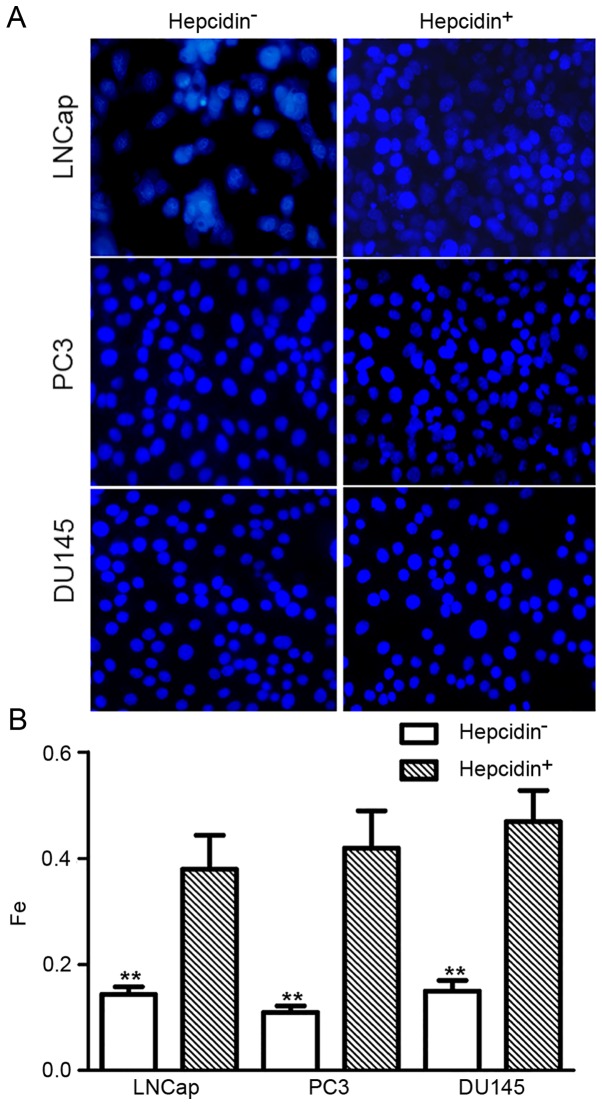
The fluorescence assay revealed that the relative fluorescence intensity in si-hepcidin-transfected LNCap, PC3 and DU145 cells was 0.12±0.05, 0.13±0.06 and 0.11±0.04, respectively. Following the addition of exogenous hepcidin (500 nM), these values increased 0.38±0.08, 0.42±0.07 and 0.47±0.08, respectively (Fig. 2). This result indicated that the relative intracellular iron level significantly increased following the addition of hepcidin, indicating that hepcidin promoted intracellular iron transfer.
Figure 2.
Relative intracellular iron levels as determined by fluorescence intensity. Fluorescence intensity in the hepcidin+ve groups was significantly increased. (A) Fluorescence assay images and (B) data analysis results. **P<0.01 compared with the hepcidin+ve groups. Hepcidin+ve, cells treated with exogenous hepcidin.
Addition of exogenous hepcidin following gene silencing accelerates cell proliferation
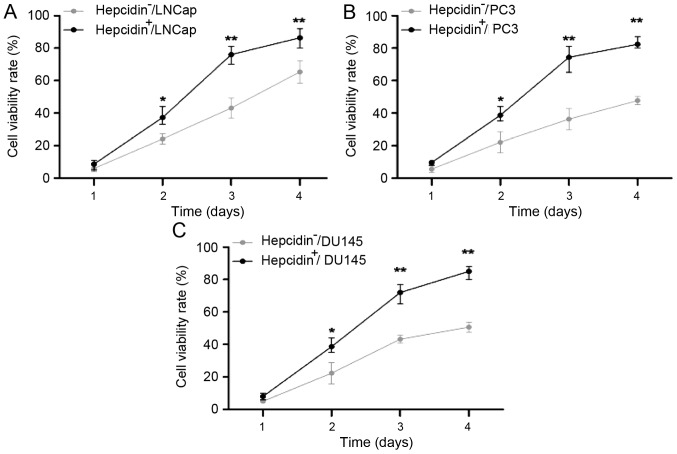
As detected by the MTT assay, the proliferation capacities of the si-hepcidin-transfected LNCap, PC3 and DU145 cells, which were similar to those of the hepcidin−ve groups on day 1 (P>0.05), significantly increased over time (P<0.05; Fig. 3). Thus, hepcidin facilitated the proliferation of prostate cancer cells.
Figure 3.
Viability rates of (A) LNCap, (B) PC3 and (C) DU145 cells detected using an MTT assay. The proliferation capacities of the hepcidin+ve groups, which were similar to those of the hepcidin−ve groups on the first day, became significantly higher with extended time. *P<0.05. **P<0.01 compared with the hepcidin+ve groups. Hepcidin+ve, cells treated with exogenous hepcidin; hepcidin−ve, hepcidin-silenced cells.
Addition of exogenous hepcidin following gene silencing accelerates cell migration
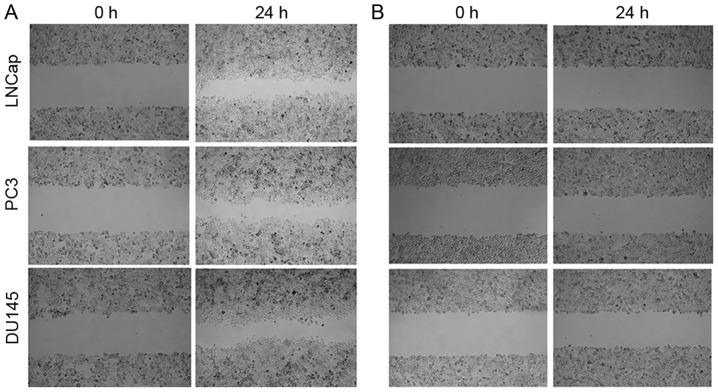
The migration capacities of si-hepcidin-transfected LNCap, PC3 and DU145 cells prior to and 24 h after culture with exogenous hepcidin (500 nM) were determined by the scratch method. In the hepcidin+ve groups, the number of cells at the scratch sites was higher than that of the hepcidin−ve groups, indicating higher migration rates. In the meantime, the distance between the boundaries of the scratch sites was markedly reduced (Fig. 4). Accordingly, the presence of hepcidin was conducive to the increased migration of prostate cancer cells.
Figure 4.
Cell migration. In the hepcidin+ve groups, the numbers of cells at the scratch sites increased more than those of the hepcidin−ve groups. The gap between the cells was markedly reduced in (A) hepcidin+ve cells after incubation for 24 h compared with (B) hepcidin−ve cells. Hepcidin+ve, cells treated with exogenous hepcidin; hepcidin−ve, hepcidin-silenced cells.
Addition of exogenous hepcidin following gene silencing decelerates cell apoptosis
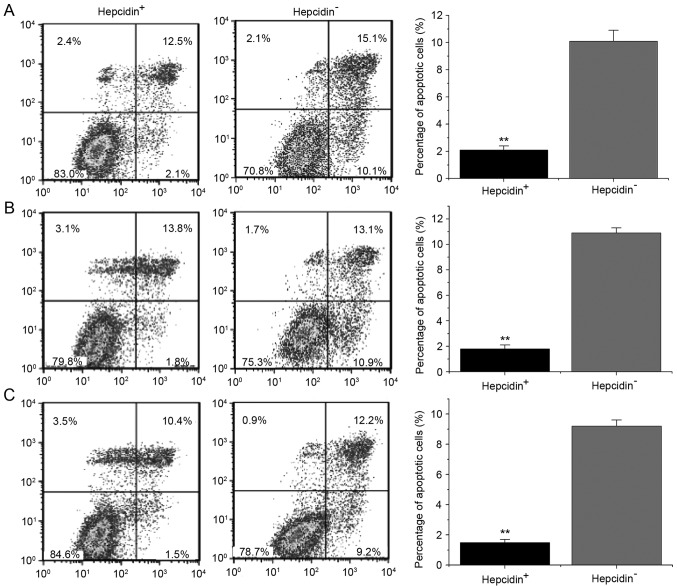
Flow cytometry revealed that after 48 h of culture with exogenous hepcidin, the average apoptotic rates of si-hepcidin-treated LNCap, PC3 and DU145 cells in the hepcidin+ve groups were 2.1±0.3, 1.8±0.3 and 1.3±0.2%, respectively, while those of the hepcidin−ve groups were 10.1±0.8, 10.9±0.4 and 9.2±0.4% (Fig. 5). Markedly, the apoptotic rates of the hepcidin+ve groups were significantly lower than those of hepcidin−ve groups, revealing that hepcidin inhibited the apoptosis of prostate cancer cells.
Figure 5.
Cell apoptosis detected by flow cytometry. The apoptotic rates of the hepcidin+ve groups were significantly lower than those of the hepcidin−ve groups. (A) Si-hepcidin LNCap; (B) Si-hepcidin PC3 and (C) Si-hepcidin DU145 cells. **P<0.01 compared with the hepcidin+ve groups. Hepcidin+ve, cells treated with exogenous hepcidin; hepcidin−ve, hepcidin-silenced cells.
Addition of exogenous hepcidin following gene silencing decreased ferroportin protein expression
The ferroportin expression in the hepcidin−ve cells prior to and following addition of exogenous hepcidin were detected by western blot analysis (Fig. 6). The expression of ferroportin in the hepcidin−ve groups was significantly higher than that in the hepcidin+ve groups (P<0.05), indicating that hepcidin regulated the decrease of ferroportin expression.
Figure 6.
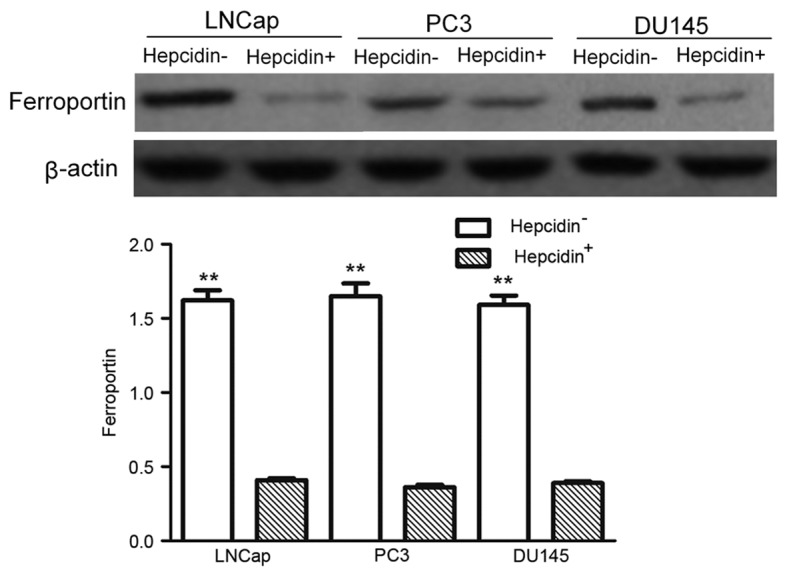
Ferroportin protein expression detected by western blotting. The expression of ferroportin in the hepcidin−ve groups were significantly higher than those of the hepcidin+ve groups. **P<0.01 compared with the hepcidin+ve groups. Hepcidin+ve, cells treated with exogenous hepcidin; hepcidin−ve, hepcidin-silenced cells.
Discussion
As a regulator of iron metabolism, hepcidin predominantly affects the growth of tumor cells following in vivo alterations (18). The onset of many types of tumors is accompanied by an increase in iron consumption; therefore reducing iron metabolism is often an aim of antitumor studies. Nicolas et al (19) reported that mice deficient in hepcidin mRNA expression had high levels of iron in tissues, verifying that hepcidin was a signaling molecule involved in iron transport. In mice deficient in the ceruloplasmin gene, hepcidin expression was positively associated with serum transferrin saturation, but negatively associated with iron levels in liver tissues (20). Upon high iron levels, more hepcidin is secreted by the liver, which then enters the bloodstream and decreases iron absorption in the duodenum and free iron release in monocytes/macrophages (21). Therefore, hepcidin serves a central role in iron metabolism regulation, storage and cycling, a process for which ferroportin is the main receptor (22,23).
The present study assessed the roles of hepcidin and iron metabolism in the onset of prostate cancer. Hepcidin was highly expressed in prostate cancer cells compared with normal prostate epithelial cells. LNCap, PC3 and DU145 cells in which hepcidin gene expression was silenced were established. Provided that the hepcidin+ve groups had significantly elevated iron levels, hepcidin promoted intracellular iron transfer by regulating ferroportin. After 48 h of culture with hepcidin, the proliferative capacity of the hepcidin+ve group became significantly different from that of the hepcidin−ve group, with exogenous hepcidin facilitating the proliferation and growth of tumor cells. Malignant tumors are typified by invasion and metastasis. In the wound-healing assay, since significantly more cells in the hepcidin+ve groups migrated into the scratch sites than the hepcidin−ve groups did, the migration of prostate cancer cells was boosted by the addition of exogenous hepcidin. Additionally, the hepcidin+ve groups had significantly lower apoptotic rates than those of the hepcidin−ve groups, indicating that hepcidin facilitated resistance to apoptosis in prostate cancer cells, and interfering with hepcidin expression exerted the opposite effect. Significantly lower levels ferroportin was expressed in the hepcidin+ve groups than in hepcidin− groups, with significantly higher intracellular iron levels.
In summary, exogenous hepcidin treatment led to a decrease in ferroportin expression, increasing the intracellular iron level and enhancing the proliferation and migration of prostate cancer cells while decreasing levels of apoptosis, thereby affecting cancer progression. Therefore, the use of hepcidin as a novel molecular therapy target may aid the advance of prostate cancer treatment.
Acknowledgements
Not applicable.
Funding
The present study was financially supported by the Applied and Basic Research Foundation of Yunnan Provincial Science and Technology Department (grant no. 2014FB068).
Availability of data and materials
The datasets generated and analyzed in the present study are included in this published article.
Authors' contributions
BZ, RL and QW designed this study and prepared this manuscript; GC, ZL, ZZ, JL, GZ, CB, CH, LY, YL performed the experiments and analyzed experimental data.
Ethics approval and consent to participate
Not applicable.
Consent for publication
The study participants provided consent for the data to be published.
Competing interests
The authors declare that they have no competing interests.
References
- 1.Ye L, Kynaston HG, Jiang WG. Bone metastasis in prostate cancer: Molecular and cellular mechanisms (Review) Int J Mol Med. 2007;20:103–111. [PubMed] [Google Scholar]
- 2.Moyer VA. U.S. Preventive Services Task Force: Screening for prostate cancer: U.S. Preventive Services Task Force recommendation statement. Ann Intern Med. 2012;157:120–134. doi: 10.7326/0003-4819-157-2-201207170-00459. [DOI] [PubMed] [Google Scholar]
- 3.Msaouel P, Pissimissis N, Halapas A, Koutsilieris M. Mechanisms of bone metastasis in prostate cancer: Clinical implications. Best Pract Res Clin Endocrinol Metab. 2008;22:341–355. doi: 10.1016/j.beem.2008.01.011. [DOI] [PubMed] [Google Scholar]
- 4.Torti SV, Torti FM. Iron and cancer: More ore to be mined. Nat Rev Cancer. 2013;13:342–355. doi: 10.1038/nrc3495. [DOI] [PMC free article] [PubMed] [Google Scholar]
- 5.Johnson M, Autzen P, Robson C, Hoedenmaaker R, Hamdy F. Prognostic value of bone morphogenetic protein 6 expression in clinically organ confined prostate cancer. Eur Urol. 1999;35:512. [Google Scholar]
- 6.Abbaspour N, Hurrell R, Kelishadi R. Review on iron and its importance for human health. J Res Med Sci. 2014;19:164–174. [PMC free article] [PubMed] [Google Scholar]
- 7.Chen D, Xu Y. Relation of iron and cervical cancer. World J Cancer Res. 2014;4:1–3. doi: 10.12677/WJCR.2014.41001. [DOI] [Google Scholar]
- 8.Nemeth E, Ganz T. Regulation of iron metabolism by hepcidin. Annu Rev Nutr. 2006;26:323–342. doi: 10.1146/annurev.nutr.26.061505.111303. [DOI] [PubMed] [Google Scholar]
- 9.Legendre C, Garcion E. Iron metabolism: A double-edged sword in the resistance of glioblastoma to therapies. Trends Endocrinol Metab. 2015;26:322–331. doi: 10.1016/j.tem.2015.03.008. [DOI] [PubMed] [Google Scholar]
- 10.Nemeth E, Rivera S, Gabayan V, Keller C, Taudorf S, Pedersen BK, Ganz T. IL-6 mediates hypoferremia of inflammation by inducing the synthesis of the iron regulatory hormone hepcidin. J Clin Invest. 2004;113:1271–1276. doi: 10.1172/JCI200420945. [DOI] [PMC free article] [PubMed] [Google Scholar]
- 11.Lane DJ, Huang ML, Richardson DR. Hepcidin, show some self-control! How the hormone of iron metabolism regulates its own expression. Biochem J. 2013;452:e3–e5. doi: 10.1042/BJ20130358. [DOI] [PubMed] [Google Scholar]
- 12.Anderson GJ, Frazer DM. Iron metabolism meets signal transduction. Nat Genet. 2006;38:503–504. doi: 10.1038/ng0506-503. [DOI] [PubMed] [Google Scholar]
- 13.Autzen P, Robson CN, Bjartell A, Malcolm AJ, Johnson MI, Neal DE, Hamdy FC. Bone morphogenetic protein 6 in skeletal metastases from prostate cancer and other common human malignancies. Br J Cancer. 1998;78:1219–1223. doi: 10.1038/bjc.1998.658. [DOI] [PMC free article] [PubMed] [Google Scholar]
- 14.Malyszko J, Mysliwiec M. Hepcidin in anemia and inflammation in chronic kidney disease. Kidney Blood Press Res. 2007;30:15–30. doi: 10.1159/000098522. [DOI] [PubMed] [Google Scholar]
- 15.Ludwig H, Evstatiev R, Kornek G, Aapro M, Bauernhofer T, Buxhofer-Ausch V, Fridrik M, Geissler D, Geissler K, Gisslinger H, et al. Iron metabolism and iron supplementation in cancer patients. Wien Klin Wochenschr. 2015;127:907–919. doi: 10.1007/s00508-015-0842-3. [DOI] [PMC free article] [PubMed] [Google Scholar]
- 16.Citelli M, Bittencourt LL, Da Silva SV, Pierucci AP, Pedrosa C. Vitamin A modulates the expression of genes involved in iron bioavailability. Biol Trace Elem Res. 2012;149:64–70. doi: 10.1007/s12011-012-9397-6. [DOI] [PubMed] [Google Scholar]
- 17.Tanno T, Rabel A, Alleyne M, Lee YT, Dahut WL, Gulley JL, Miller JL. Hepcidin, anaemia, and prostate cancer. BJU Int. 2011;107:678–679. doi: 10.1111/j.1464-410X.2011.10108.x. [DOI] [PMC free article] [PubMed] [Google Scholar]
- 18.Bobinac D, Marić I, Zoricić S, Spanjol J, Dordević G, Mustać E, Fuckar Z. Expression of bone morphogenetic proteins in human metastatic prostate and breast cancer. Croat Med J. 2005;46:389–396. [PubMed] [Google Scholar]
- 19.Nicolas G, Bennoun M, Devaux I, Beaumont C, Grandchamp B, Kahn A, Vaulont S. Lack of hepcidin gene expression and severe tissue iron overload in upstream stimulatory factor 2 (USF2) knockout mice. Proc Natl Acad Sci USA. 2001;98:8780–8785. doi: 10.1073/pnas.151179498. [DOI] [PMC free article] [PubMed] [Google Scholar]
- 20.Wrighting DM, Andrews NC. Interleukin-6 induces hepcidin expression through STAT3. Blood. 2006;108:3204–3209. doi: 10.1182/blood-2006-06-027631. [DOI] [PMC free article] [PubMed] [Google Scholar]
- 21.Ganz T, Nemeth E. Hepcidin and disorders of iron metabolism. Annu Rev Med. 2011;62:347–360. doi: 10.1146/annurev-med-050109-142444. [DOI] [PubMed] [Google Scholar]
- 22.De Domenico I, Ward DM, Kaplan J. Hepcidin regulation: Ironing out the details. J Clin Invest. 2007;117:1755–1758. doi: 10.1172/JCI32701. [DOI] [PMC free article] [PubMed] [Google Scholar]
- 23.Tesfay L, Clausen KA, Kim JW, Hegde P, Wang X, Miller LD, Deng Z, Blanchette N, Arvedson T, Miranti CK, et al. Hepcidin regulation in prostate and its disruption in prostate cancer. Cancer Res. 2015;75:2254–2263. doi: 10.1158/0008-5472.CAN-14-2465. [DOI] [PMC free article] [PubMed] [Google Scholar]
Associated Data
This section collects any data citations, data availability statements, or supplementary materials included in this article.
Data Availability Statement
The datasets generated and analyzed in the present study are included in this published article.


