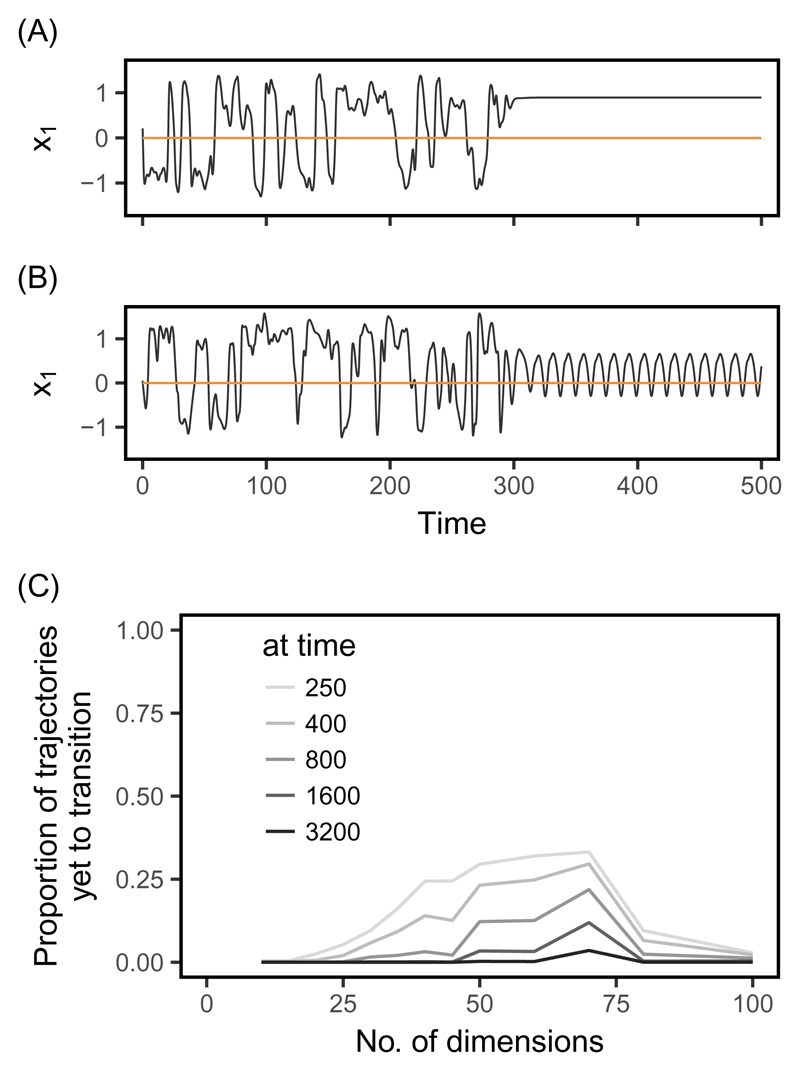
Fig. 1.
Transients in a constant environment. Transient trajectories present chaos-like behavior for some time, before transitioning to either (A) fixed equilibrium phenotypes or (B) periodic cycles. Two representative trajectories for a single trait are shown, simulated as described in the Methods, with d = 45 and a constant optimum (orange line). (C) The expected proportion of evolutionary trajectories (among all those for a given dimensionality d) that will eventually transition to non-chaotic dynamics, but would still be categorized as chaotic at a given time, are shown for different times. These proportions were estimated from a statistical model of exponential decrease with time of the proportion of apparently chaotic dynamics (model fits in Supplementary Fig. S2). For each dimensionality d, 250 trajectories were run up to t = 1200 and classified based on their estimated Lyapunov exponents λ, as described in the Methods.

