

Abstract
Biofilms alter their metabolism in response to environmental stress. This study explores the effect of a hyperosmotic agent–antibiotic treatment on the metabolism of Staphylococcus aureus biofilms through the use of nuclear magnetic resonance (NMR) techniques. To determine the metabolic activity of S. aureus, we quantified the concentrations of metabolites in spent medium using high-resolution NMR spectroscopy. Biofilm porosity, thickness, biovolume, and relative diffusion coefficient depth profiles were obtained using NMR microimaging. Dissolved oxygen concentration was measured to determine the availability of oxygen within the biofilm. Under vancomycin-only treatment, the biofilm communities switched to fermentation under anaerobic condition, as evidenced by high concentrations of formate (7.4 ± 2.7 mM), acetate (13.1 ± 0.9 mM), and lactate (3.0 ± 0.8 mM), and there was no detectable dissolved oxygen in the biofilm. In addition, we observed the highest consumption of pyruvate (0.19 mM remaining from an initial 40 mM concentration), the sole carbon source, under the vancomycin-only treatment. On the other hand, relative effective diffusion coefficients increased from 0.73 ± 0.08 to 0.88 ± 0.08 under vancomycin-only treatment but decreased from 0.71 ± 0.04 to 0.60 ± 0.07 under maltodextrin-only and from 0.73 ± 0.06 to 0.56 ± 0.08 under combined treatments. There was an increase in biovolume, from 2.5 ± 1 mm3 to 7 ± 1 mm3, under the vancomycin-only treatment, while the maltodextrin-only and combined treatments showed no significant change in biovolume over time. This indicated that physical biofilm growth was halted during maltodextrin-only and combined treatments.
Keywords: biofilm, diffusion coefficient, hyperosmotic agent, metabolites, porosity, Staphylococcus aureus
1 | INTRODUCTION
Chronic wounds affect over 7.5 million people in the United States and cost billions of dollars in US health care (Sousa & Pereira, 2014). The presence of biofilms prevent wounds from healing, leading to debilitating chronic infections (James et al., 2008; Sousa & Pereira, 2014). Staphylococcus aureus is a common biofilm-forming pathogen that cause recalcitrant infections especially in wounds (Hampton, 2015; Walker, Metcalf, Parsons, & Bowler, 2015). The standard method of biofilm removal is physical removal, or debridement (Barry & Kanematsu, 2015; Wolcott, Kennedy, & Dowd, 2009). However, this can be painful for the patients and does not provide desired results consistently. Thus, it is commonly administered with other methods such as antibiotics and antiseptics (Attinger et al., 2006; van Baal, 2004). Nevertheless, antibiotics alone are often not as effective as desired against biofilms. To improve their efficiency, they are combined with osmotic compounds (Kiamco et al., 2015; Liu et al., 2015; Raad et al., 2007; Yang et al., 2016). For example, honey has been employed as an osmotic treatment in combination with antibiotics (Al-Jabri, Al-Hosni, Nzeako, Al-Mahrooqi, & Nsanze, 2005; Jenkins & Cooper, 2012a, 2012b).
In this study, we combined maltodextrin, a hyperosmotic compound, and vancomycin, a glycopeptide antibiotic (Kohanski, Dwyer, & Collins, 2010). Unlike honey, which is a complex substance, maltodextrin is mainly composed of polysaccharides. Recently, we showed that maltodextrin enhanced the efficacy of vancomycin against S. aureus biofilms by reducing viable cell number and affecting biofilm structure (Kiamco et al., 2015). However, in previous work, we did not determine biofilm structural parameters with both spatial and temporal resolution, and metabolite changes when biofilms were challenged with a hyperosmotic agent and antibiotic. These critical data can be obtained using nuclear magnetic resonance (NMR). In the literature, NMR-generated metabolomics of S. aureus are studied in terms of comparing the metabolisms of planktonic and biofilm forms (Junka et al., 2013; Stipetic et al., 2016), and of aerobic and anaerobic growth (Ledala, Zhang, Seravalli, Powers, & Somerville, 2014; Sun, Zhang, Chen, & Han, 2012). Our goal was to determine the effects of maltodextrin and vancomycin treatment on the metabolism and structure of S. aureus biofilms (both spatial and temporal resolution) through the use of NMR imaging and high-resolution NMR spectroscopy, respectively. It is essential to understand the changes in metabolism and structure due to maltodextrin–antibiotic treatment against S. aureus biofilms and to generate new hypotheses regarding potential mechanisms of action for multi-treatment approaches.
Bacteria alter their metabolism in the presence of environmental stress. For example, fermentation processes can be initiated when the local environment becomes anaerobic (Fuchs, Pane-Farre, Kohler, Hecker, & Engelmann, 2007). This switch from aerobic respiration to anaerobic fermentation is relevant to antibiotic resistance (Martínez & Rojo, 2011), the transcription of virulence genes (Fuchs et al., 2007), as well as the expression of extracellular polysaccharides involved in cell-to-cell adhesion and biofilm formation (Cramton, Gerke, Schnell, Nichols, & Gotz, 1999; Cramton, Ulrich, Gotz, & Doring, 2001). In addition, oxygen can be scarce near the bottom of biofilms (Cotter, O’Cara, & Casey, 2009), which may indicate dormancy of cells near the bottom layer, proximate to the substratum, and a fermentative metabolism (Chihara, Matsumoto, Kagawa, & Tsuneda, 2015). These processes can be determined if a specific metabolite is present in the biofilm. For example, lactate is a common metabolite produced in cells undergoing fermentation in anaerobic conditions, whereas conversion from lactate to acetate is favorable in an oxygenated environment (Ferreira, Manso, Gaspar, Pinho, & Neves, 2013; Sun et al., 2012). Since we know that maltodextrin subjects cells to osmotic stress, we hypothesized that maltodextrin treatment would alter the metabolic activity of S. aureus biofilms and lead to increased antibiotic efficacy.
The effects of vancomycin-only, maltodextrin-only, and a combination of the two on the porosity, relative diffusion coefficients, thickness, and biovolume of the biofilm and on the metabolite concentrations in the bulk medium above the biofilm were determined. Structural and depth-resolved measurements were obtained using magnetic resonance micro-imaging (μMRI) (Renslow, Marshall, Tucker, Chrisler, & Yu, 2017). The concentrations of metabolites in biofilms were quantified using high-resolution NMR spectroscopy. Finally, the dissolved oxygen (DO) concentration was measured using microelectrodes to determine the oxygen availability within the biofilms.
2 | MATERIALS AND METHODS
2.1 | Inoculum preparation
The ALC1743 strain of S. aureus was used in this study; this was kindly provided by Niles Donegan of the Geisel School of Medicine at Dartmouth College (Nayduch, Cho, & Joyner, 2013; Peterson et al., 2008). An overnight culture was prepared by adding 5 ml of tryptic soy broth (TSB) (Fisher Scientific, Palatine, IL, catalog #DF0370-17-3), 5 μl (from a 10-mg/ml solution) of chloramphenicol (Sigma Aldrich, St. Louis, MO, catalog #C1919-25G), and 60 μl of S. aureus culture from a −20 °C freezer. The culture was incubated at 37 °C on a rotary shaker (Lab Line L. E. D. Orbital Shaker Model 3518, 90 rpm) for 18 hr.
2.2 | Defined medium
A defined medium (“M1”) which is compatible with NMR was used in the study. The following chemicals were dissolved in a 1-L total volume of nano-pure water: 0.91 g/L 1,4-Piperazinediethanesulfonic acid (PIPES), 0.3 g/L NaOH, 1.5 g/L ammonia chloride, 0.1/L g potassium chloride, 0.6 g/L sodium phosphate (monobasic, monohydrate), 4.4016 g/L sodium pyruvate (40 mM), 1.75 g/L NaCl) and 10 ml of vitamin, mineral, and amino acid supplements [prepared by following Speers and Reguera (2012)]. The medium was sterilized using an autoclave (121 °C, 15-min exposure).
2.3 | Growing biofilms and treatment
NMR tubes (528-PP-7, Wilmad-LabGlass, Vineland, NJ) with 5-mm diameter were autoclaved and filled with autoclaved M1 agar (1/3 of the height). The tubes containing agar were cooled and stored inside the fridge. An overnight bacterial culture was diluted to 0.8 OD600, in TSB media, and ∼10 μl of it was used to inoculate the M1-agar-containing NMR tubes. Cells were given 3 hr to attach to the agar surface, after which the exposed portion of each NMR tube was washed three times with 100 μl of TSB. TSB (100 μl) was added, and biofilms were allowed to grow for 3 days in TSB. The medium was replaced every day with fresh M1 medium (100 μl) after 3 days in TSB. After 3rd day of the growth and medium replacement, the biofilms in NMR tube was placed inside the NMR instrument (Figure 1), where tubes rested at 37 °C. An additional 400 μl of M1 medium was then added to each tube before the continuous NMR data collection. Biofilm was spiked with 200 μl of vancomycin to give a total concentration of 0.8 mM on the 6th day of the experiment (5-day-old biofilm at that point). In the results section, we assign “day zero” as the day when we replaced the medium, not the day we inoculate. NMR scans were performed constantly while the biofilm was inside the NMR machine. The procedure was repeated for biofilms treated with 10 mM maltodextrin-only and for biofilms treated with 10 mM maltodextrin combined with 0.8 mM vancomycin. For each treatment type, NMR scans were collected over a course of 10 days. The μMRI scans included quantitative 2-dimensional (2D) relative diffusion coefficient maps, quantitative 2D porosity maps, biofilm thickness, and biovolume maps. High-resolution NMR spectroscopy was used for the identification of metabolites and their corresponding concentrations after the course of treatments. Maltodextrin and vancomycin were both purchased from Sigma Aldrich (catalog #419672 and #861987, respectively).
FIGURE 1.
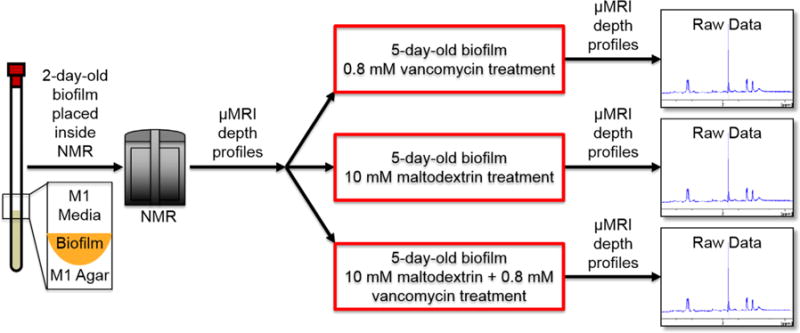
Schematic of experimental plan and timeline
2.4 | Nuclear magnetic resonance imaging measurements
All pulsed-field gradient nuclear magnetic resonance (PFG-NMR) measurements were performed at 500.40 MHz for proton (1H) detection using an 89-mm widebore 11.7-T magnet with a Bruker Avance III digital NMR spectrometer and ParaVision 5.1 imaging software (Bruker Instruments, Billerica, MA), similar to that described by Renslow et al. (Lone et al., 2015; Renslow, Babauta, Majors, & Beyenal, 2013; Renslow et al., 2010). Briefly, NMR was used to determine 2D maps and 1D profiles of diffusion coefficients and porosity, and to measure organic acid and other metabolite concentrations by location relative to the biofilm. Experiments performed included diffusion tensor imaging (DtiStandard), localized magnetic resonance spectroscopy (PRESS), and chemical shift selective imaging (mic_chess).
Metabolite analysis of spent medium was performed using high-resolution NMR spectroscopy at 600 MHz for proton (1H) detection with an Agilent Varian NMR System (VNMRS) spectrometer equipped with a cryogenically cooled 1H/13C/15N (HCN) triple resonance probe, similar to that described by Ha et al. (2015). One-dimensional NOESY spectra were baseline corrected, apodized (0.5 Hz line broadening), and fourier transformed using nmrPipe (Delaglio et al., 1995), and NMR spectra were profiled by two independent operators using Chenomx NMR Suite (Chenomx, Inc., Edmonton, AB, Canada).
2.5 | Dissolved oxygen concentration measurements
The DO microelectrode was constructed following previously described protocols (Lewandowski & Beyenal, 2014). The micro-electrodes had tip diameters of <20 μm. DO microelectrodes were polarized to −800 mVAg/AgCl and calibrated using two-point calibration: in the air (oxygen saturation) and in a solution of 0.1 M sodium ascorbate and 0.1 M NaOH (without oxygen). The detection limit was 0.0032 mg/L (Lewandowski & Beyenal, 2014). A Keithley 6517A Electrometer/High Resistance Meter was used to operate both DO microelectrodes. The DO microelectrode was initially placed ∼100 μm from the top of the air/medium interface. The surface of the biofilm sample was determined using a Zeiss Stemi 2000 stereomicroscope (Carl Zeiss Microscopy, Thornwood, NY). After the microelectrode tip was located above the medium surface, the microelectrode was moved down in 10-μm increments. A computer-controlled stepper motor (Physik Instrumente, Auburn, MA, PI M-230.10S, part no. M23010SX) controlled with a custom-built micro-profiling system was used to manipulate microelectrode movements. An analog/digital converter (Measurement Computing, Norton, MA, ADC; USB-1608FS) was used to record the collected data.
2.6 | Data analysis
NMR measurements provided 2D maps of the diffusion coefficients and porosity. The NMR maps include the parameters measured within the agar, the biofilm, and the bulk medium. The diffusion coefficient map was used to isolate the biofilm domain because it provided the maximum contrast between the biofilm and its surroundings. The biofilm domain is “isolated” by converting a diffusion map to a binary image using a constant threshold. The biofilm domain (above the constant threshold) is assigned a value of 1, while the surroundings (below the constant threshold) are assigned a value of zero. The constant threshold is selected such that the image heterogeneity is minimized while the biofilm area is maximized. The use of image heterogeneity and object area in image analysis and segmentation methods is discussed in detail elsewhere (Lewandowski & Beyenal, 2014). Briefly, the image heterogeneity correlates negatively with the number of objects within a binary image. The constant threshold is varied between 0% and 100% of the maximum scale, in increments of 0.1%. The constant threshold (p) is selected based on the objective function shown in Objective function (image heterogeneity × (1 area)) Equation 1. The objective function has two characteristic peaks, a positive peak signaling the initial increase in image heterogeneity with increasing threshold value, followed by a negative peak signaling the decrease in heterogeneity and the isolation of the biofilm domain as the p value increases. The threshold value is selected such that the objective function exceeds 3% of the minimum value following the negative peak.
| (1) |
The porosity and relative diffusion coefficient profiles are reported as the average values across the middle 1.02-mm region of the biofilm domain. The standard deviation is calculated to represent heterogeneity within the biofilms (Lewandowski & Beyenal, 2014). The profiles are calculated in the middle region to avoid edge artifacts resulting from the growth of the biofilm on the agar meniscus. The depth profiles have a step size of 40 μm, which is determined by the resolution of the NMR maps. All porosity and relative diffusion coefficients are normalized to the average value prior to treatment of the bulk growth medium above the biofilm.
The biofilm thickness is defined as the vertical distance between the top and the bottom of the biofilm. The biofilm thickness is averaged throughout the width of the biofilm. The biovolume is calculated by rotating the biofilm domain around the vertical axis passing through the center of the biofilm meniscus, which was assigned to the bottom pixel at the center of the biofilm domain. The biovolume calculation is sensitive to the location of the bottom of the mensiscus. To estimate the error resulting from converting the biofilm image to a binary map, the biovolume calculation was repeated while adjusting the bottom of meniscus to the four neighboring pixels. The reported biovolume measurement is the average of all measurements. Error bars for both biofilm thickness and biovolume are reported as standard deviation. Data analysis is performed using custom-written scripts in MATLAB® R2015b (Mathworks, Natick, MA).
2.7 | Statistical analysis
A one-way ANOVA with Tukey’s post hoc test was performed to determine significant differences for all possible pairwise comparisons among treatments for final spent medium metabolite concentrations. Two replicates per treatment were assessed by two independent operators.
3 | RESULTS AND DISCUSSION
3.1 | Maltodextrin-only and vancomycin-only treated biofilms undergo fermentation in anaerobic conditions
For biofilms treated with vancomycin-only, the bulk liquid above the biofilm contained high concentrations of acetate and formate (Table 1); these concentrations differed significantly from those found for maltodextrin and combined treatments (p < 0.05). S. aureus is capable of switching to anaerobic respiration for survival (as expected from a facultative anaerobe) (Fuchs et al., 2007). The biofilm under antibiotic stress in the vancomycin-only treatment had higher metabolic activity (with the highest consumption of pyruvate, the carbon source, from 40 mM to 0.19 ± 0.01 mM; p < 0.05), as revealed by the metabolomics analysis. This suggests anaerobic condition, which is also an indication of antimicrobial resistance (Fuchs et al., 2007; Hemsley et al., 2014). The switch to fermentation pathways under anaerobic conditions indicates insufficient oxygen avaibility in the biofilm (Baron, 1996). In addition, vancomycin-only treated biofilm contained the lowest concentration of pyruvate (0.19 ± 0.01 mM; p < 0.05) among the treatments. The biofilm in this case had an active metabolism due to the lower concentration of pyruvate (carbon source added in the medium), which is consistent with cells combating the antibiotic stress. Furthermore, there is a trend of increasing pyruvate concentration from vancomycin-only treatment to combined treatments (0.19 ± 0.01 mM for vancomycin-only and 11.21 ± 0.58 mM for combined treatment). This shows that under combined treatments biofilm consumes less pyruvate, an indication that either the metabolism is not as active as those of biofilms under vancomycin-only treatment or an alternative carbon source is utilized by biofilms under maltodextrin-only and combined treatments. Acetate can be utilized as a carbon source for cells; it is known that acetate consumption is aerobic in nature (Sun et al., 2012). The concentration of acetate is lower in the bulk over the biofilm treated with combined maltodextrin and vancomycin (7.1 ± 2.1 mM) and the pyruvate concentration is higher under the combined treatment than under the rest of the treatments. This implies that either biofilm under this treatment contains large numbers of dead cells with no metabolic activity or biofilm metabolism is inhibited. In our previous work, it was found the combined treatments of maltodextrin and vancomycin reduced cell viability by 2 logs whereas the individual treatments were not significantly different from the control (Kiamco et al., 2015). Furthermore, maltodextrin-treated biofilms had significantly less amino acids (leucine, phenylalanine, proline, tyrosine, and valine) in the bulk.
TABLE 1.
Metabolite concentrations present in the bulk solution of the biofilm after 6 day-treatments of vancomycin-only, maltodextrin-only, and combined treatment
| Compound | Sig | 0.8 mM vancomycin only | 10 mM maltodextrin only | 10 mM maltodextrin + 0.8 mM vancomycin |
|---|---|---|---|---|
| 2-Hydroxyisovalerate | ↓ | 0.0279 ± 0.0010 | 0.0069 ± 0.0010 | 0.0041 ± 0.0002 |
| Acetate | ↓ | 13.1 ± 0.90 | 9.8 ± 1.7 | 7.1 ± 2.1 |
| Acetoin | ↑ | 0.091 ± 0.005 | 1.742 ± 0.097 | 0.694 ± 0.073 |
| Butyrate | ↓ | 0.011 ± 0.003 | 0.007 ± 0.001 | 0.006 ± 0.002 |
| Ethanol | 0.839 ± 0.041 | 0.726 ± 0.005 | 0.853 ± 0.029 | |
| Formate | ↓ | 7.4 ± 2.7 | 1.5 ± 0.5 | 1.2 ± 0.7 |
| Fumarate | 0.161 ± 0.115 | 0.003 ± 0.001 | 0.351 ± 0.385 | |
| Glucose | 0.00 | 0.83 | 0.49 | |
| Isobutyrate | 0.007 ± 0.002 | 0.009 ± 0.001 | 0.004 ± 0.001 | |
| Isoleucine | 0.047 | 0.032 | 0.035 | |
| Isopropanol | 0.009 ± 0.002 | 0.011 ± 0.001 | 0.007 ± 0.003 | |
| Isovalerate | 0.058 ± 0.005 | 0.065 ± 0.005 | 0.068 ± 0.011 | |
| Lactate | 3.0 ± 0.8 | 3.2 ± 0.8 | 2.3 ± 0.8 | |
| Leucine | ↓ | 0.195 ± 0.012 | 0.104 ± 0.008 | 0.106 ± 0.009 |
| Lysine | 0.25 ± 0.10 | 0.09 ± 0.01 | 0.13 ± 0.09 | |
| Methanol | 0.024 | 0.043 | 0.039 | |
| Phenylalanine | ↓ | 0.11 ± 0.01 | 0.09 ± 0.01 | 0.09 ± 0.01 |
| Proline | ↓ | 0.19 ± 0.02 | 0.07 ± 0.03 | 0.06 ± 0.01 |
| Propionate | 0.014 ± 0.002 | 0.012 ± 0.002 | 0.009 ± 0.003 | |
| Pyroglutamate | ↓ | 0.14 ± 0.01 | 0.08 ± 0.01 | 0.07 ± 0.02 |
| Pyruvate | ↑ | 0.19 ± 0.01 | 9.38 ± 0.13 | 11.21 ± 0.580 |
| Tryptophan | 0.027 ± 0.007 | 0.019 ± 0.003 | 0.029 ± 0.003 | |
| Tyrosine | ↓ | 0.043 ± 0.003 | 0.027 ± 0.001 | 0.024 ± 0.004 |
| Uracil | 0.027 | 0.0039 | 0.001 | |
| Valine | ↓ | 0.175 ± 0.006 | 0.087 ± 0.004 | 0.080 ± 0.002 |
The concentration unit is millimolar (mM). Plus/minus values represent standard deviations. Acetate, formate, and lactate peaks were susceptible to peak broadening and have higher variance than other compounds. Down arrows (↓) indicate a statistically significantly (p < 0.05) lower concentration in both maltodextrin—treated samples compared to the vancomycin-only treatment, and up arrows (↑) indicate significantly higher concentrations.
Cells take in osmolytes from the environment as well as produce them to combat hyperosmotic stress. Known osmolytes in the literature are proline, glycine, betaine, glutamate, trehalose, carnitine, and ectoine (Burg & Ferraris, 2008; Schwan, Lehmann, & McCormick, 2006). We found that there is a trend (vancomycin-only>maltodextrin-only>combined treatments) in the bulk proline concentration among the treatments. Since cells take up proline as an osmoprotectant when under osmotic stress, in effect we see a significantly smaller concentration (p < 0.05) of proline in the bulk under the combined treatment than under vancomycin-only treatment. The proline concentration for the combined treatment is comparable to that for the maltodextrin-only treatment; both have low concentration (0.06 ± 0.01 mM and 0.07 ± 0.03 mM, respectively) of proline compared to vancomycin-only treatment (0.19 ± 0.02 mM). This is consistent with S. aureus biofilms under maltodextrin-only and combined treatments being under osmotic stress.
3.2 | Oxygen was present within the biofilm treated with maltodextrin and vancomycin in combination
Dissolved oxygen profiles were measured inside the biofilms to determine the availability of oxygen deep within the biofilms. Based on Figure 2, untreated biofilms and biofilms under vancomycin-only or maltodextrin-only treatment showed DO below the detection limit (0.0032 mg/L) from the medium/biofilm interface through the deeper locations within the biofilm. Very low DO concentration near the bottom suggests that the biofilms grew anaerobically or switched to fermentation in the sense that an alternative electron acceptor was utilized rather than oxygen or electrons were stored in organic compounds such as lactic acid (fermentation in anaerobic conditions), respectively. The data in Table 1 also support the idea that biofilm underwent fermentation: high contents of fermentative products— such as lactate, acetate, and formate—are evident for biofilms treated with vancomycin-only and maltodextrin-only. In contrast, biofilm under the combined treatment showed DO concentrations of 3.05 ± 0.36 mg/L at the medium/biofilm interface and 1.34 ± 0.33 mg/L near the bottom of the biofilm. The presence of oxygen through the deeper part of the biofilm implies that the cells near the top were either not respiring, had a slower rate of respiration, or lysed. Being a facultative pathogen, S. aureus respires aerobically when oxygen is present and can switch to anaerobic respiration when oxygen is absent if another electron acceptor is available. In the combined treatment, DO concentration change was detectable from the top to near the bottom of the biofilm. Thus, it is concluded that the cells in the biofilm were respiring.
FIGURE 2.
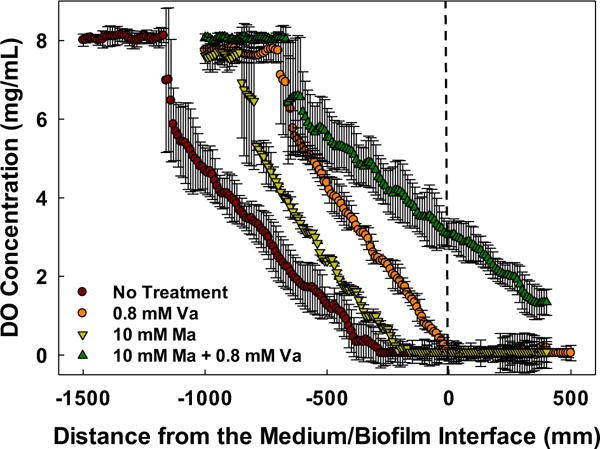
Dissolved oxygen profiles inside S. aureus biofilms. The dashed lined (distance 0 mm) on the x-axis depicts the approximate surface of the biofilm. Like the control, biofilms treated with vancomycin (Va) or maltodextrin (Ma) showed DO concentrations below the detection limit (0.0032 mg/L). Data are means and error bars are standard deviation of at least two biological replicates
3.3 | Changes in biofilm porosity, diffusivity, thickness, and volume with maltodextrin and/or vancomycin treatment
The porosity did not change after vancomycin-only treatment: 0.79 ± 0.04 before and 0.80 ± 0.09 after treatment (Figure 3a). Porosity showed no significant change during treatment with either maltodextrin-only (0.81 ± 0.03 before and 0.80 ± 0.09 after maltodextrin-only treatment) or with combined treatment (0.82 ± 0.06 before and 0.83 ± 0.11 after combined treatment). The relative diffusion coefficient profile of biofilm treated with vancomycin-only increased over time (Figure 3b), from 0.73 ± 0.08 to 0.88 ± 0.08, whereas the relative diffusion coefficient profile decreased when biofilm was treated with maltodextrin-only (from 0.71 ± 0.04 to 0.60 ± 0.07), as expected because of the higher viscosity of the maltodextrin solution. A similar trend was observed in the relative diffusion coefficient profile of biofilm under the combined treatment. In both cases where maltodextrin was applied, the free diffusion of molecules in water is low. It is observed that a drop in relative diffusion coefficient is evident at the time maltodextrin is administered to the biofilm. This may reduce nutrient transport to the point that the biofilm is nutrient-limited, which can lead to starvation of the cells.
FIGURE 3.
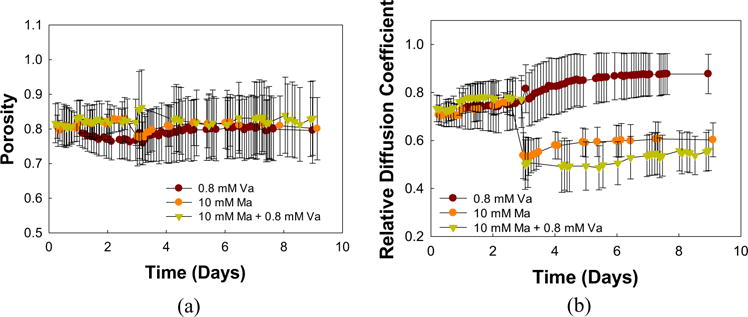
(a) Porosity and (b) relative diffusion coefficient profiles of S. aureus biofilms relative to growth medium treated with vancomycin-only (Va), maltodextrin-only (Ma), or a combination of the two. Time in days indicates the age of the biofilm; treatments were administered after 5 days of growth. Porosity was not affected by the treatments, whereas maltodextrin caused a decrease in the relative diffusion coefficient. Data are means and error bars are standard deviation which represents heterogeneity within the biofilm domain
Vancomycin-only treated biofilm showed an increase in average biofilm thickness (Figure 4a) from 0.36 ± 0.12 mm to 0.63 ± 0.23 mm after 7 days. In contrast, there was no increase in thickness under combined treatments (from 0.23 ± 0.09 mm to 0.20 ± 0.07 mm after 7 days). Maltodextrin-only treatment caused an increase of about 0.1 mm in biofilm thickness. The large standard deviation of biofilm thickness measurements is attributed to the difference in biofilm thicknesses at the edge compared to the center of the biofilm. There was an increase in biovolume, from 2.5 ± 1 mm3 to 7 ± 1 mm3, under the vancomycin-only treatment, while the maltodextrin-only and combined treatments showed no significant increase in biovolume over time.
FIGURE 4.
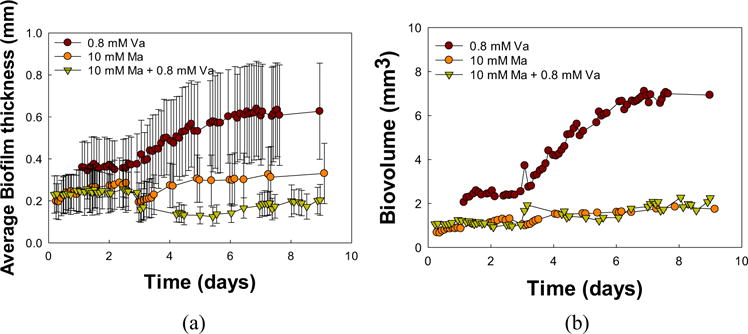
(a) Biofilm thickness and (b) biovolume of S. aureus biofilms treated with vancomycin-only (Va), maltodextrin-only (Ma), or a combination of the two. Time in days indicates the age of the biofilm; treatments were administered after 5 days of growth. The biofilm thickness is averaged throughout the biofilm domain while the biovolume is averaged from five estimates. Error bars represent the standard deviation and some cases they are smaller than the symbols and not visiable
Figure 5 shows the depth profile of porosity through the biofilm. There was a gradual decrease over time in the porosity of biofilm treated with vancomycin-only; at depth 0.2 mm from the bottom of the biofilm, the porosity went to ∼0.65 on day 7 from being ∼0.8 on day 3. Biofilm treated with maltodextrin-only also showed a gradual decrease in porosity with depth of the biofilm over time but not the same magnitude as the vancomycin-only treated biofilm (from ∼0.8 on day 3 to ∼0.75 on day 7). However, the biofilm showed an increase in porosity with depth after the combined treatment; a porosity of about 0.9 was achieved after 7 days at depths 0.72 ± 0.04 mm (vancomycin-only), 0.44 ± 0.04 mm (maltodextrin-only), and 0.20 ± 0.04 mm (combined treatment) from the bottom of the biofilm (0-mm mark).
FIGURE 5.
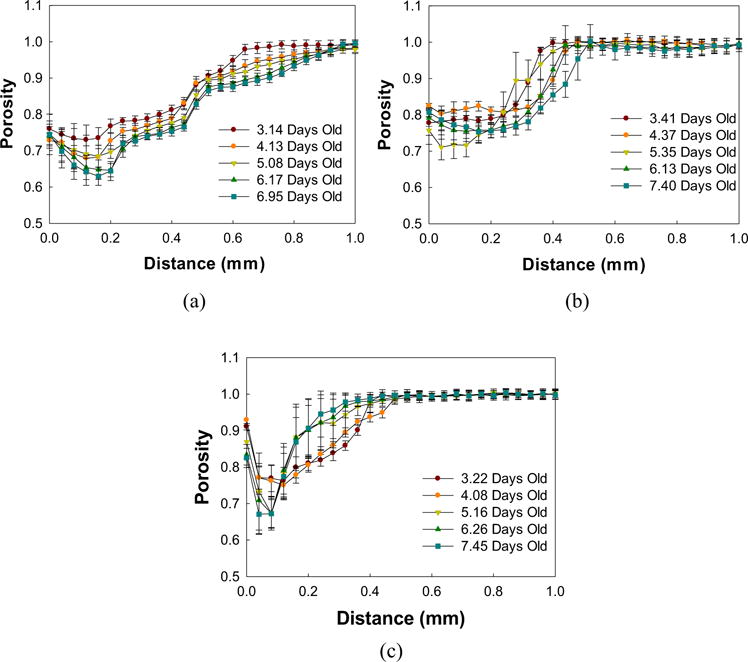
Porosity depth profiles of S. aureus biofilms treated with (a) vancomycin, (b) maltodextrin, or (c) a combination of the two. Treatments were administered after 5 days of biofilm growth. Data are means and error bars are standard deviation which represents heterogeneity at each depth within each layer of the biofilm
Figure 6 shows the depth profiles of biofilms before and after treatment. Therelative diffusion coefficientdepth profilesdid not change over the course of days of vancomycin-only treatment. In contrast, the depth profiles for biofilm under maltodextrin-only treatment showed a drastic shift in profile during treatment. This change indicates a decrease (from ∼0.75 to ∼0.60) in relative diffusion coefficients, which is also shown in Figure 3b. A similar observation can be made for biofilm treated with a combination of maltodextrin and vancomycin. The presence of maltodextrin in the solution caused a decrease in the free diffusion of molecules such as nutrients within the biofilm.
FIGURE 6.
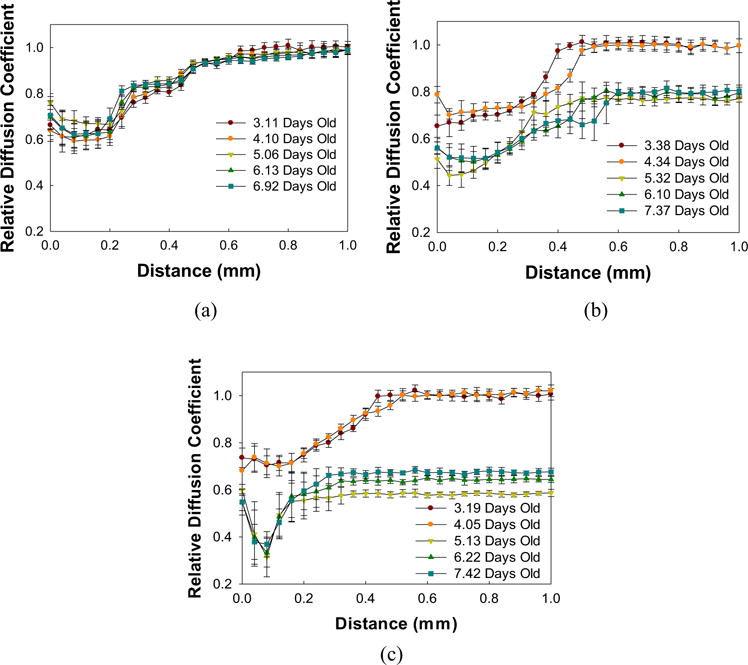
Relative diffusion coefficient depth profiles of S. aureus biofilms treated with (a) vancomycin, (b) maltodextrin, or (c) a combination of the two. Treatments were administered after 5 days of biofilm growth. Data are means and error bars are standard deviation which represents heterogeneity at each depth within each layer of the biofilm
3.4 | Possible mechanisms for individual and combined effects of maltodextrin and vancomycin
Most antibiotic resistance mechanisms involve a fitness cost which translates to reduced bacterial growth (Dan & Diarmaid, 2010; Foucault, Courvalin, & Grillot-Courvalin, 2009; Martínez & Rojo, 2011). In addition, biofilms are known to counteract antibiotic treatments by enhancing metabolic processes that lead to resistance or a stress response (Händel, Schuurmans, Brul, & ter Kuile, 2013). Since most of the pyruvate was consumed under vancomycin-only treatment, it may indicate that the cells actively utilized the substrate for metabolic reactions leading to the production of energy. The high concentrations of fermentation products and the absence of oxygen in the biofilm under vancomycin-only treatment show that the biofilm was producing energy through fermentation under anaerobic condition. In return, this energy could be used for metabolic processes that produce antibiotic resistance or a stress response. The biovolume of the biofilm treated with vancomycin-only increased throughout treatment, indicating that the biofilm was also actively growing.
The presence of lower proline concentrations in the bulk solutions of biofilms under maltodextrin-only (0.07 ± 0.03 mM) and combined treatments (0.06 ± 0.01 mM) indicates that the biofilms regulated the osmotic stress from maltodextrin. This confirms the capability of bacteria to counter osmotic stress by taking up osmolytes. However, cell death can still occur under high osmotic stress as key metabolic reactions in the cell are affected; Houssin, Eynard, Shechter, and Ghazi (1991) found that the inhibition of E. coli by NaCl and sucrose was due to the inhibition of electron transfer and sugar transport. The biovolume of the biofilm under maltodextrin-only treatment did not increase during the treatment. Aside from osmotic stress, the presence of maltodextrin affected the diffusivity of free molecules such as nutrients within the biofilm. Although one might expect that maltodextrin would affect the diffusion of vancomycin within the biofilm, the biovolume data show no further growth for biofilms under combined treatments.
Biofilm under maltodextrin-only treatment showed DO concentrations below the detection limit near the top of the biofilm, similar to biofilm under vancomycin-only treatment. The metabolite data for maltodextrin-only treatment also showed evidence of anaerobic fermentation. This may indicate that the biofilm under maltodextrin-only treatment was in the same condition as the biofilm under vancomycin-only treatment. Oxygen limitation has been shown to be correlated to antibiotic tolerance (Borriello et al., 2004; Walters, Roe, Bugnicourt, Franklin, & Stewart, 2003). Interestingly, biovolume increased (from ∼2.5 ± 1 mm3 to ∼7 ± 1 mm3 in a span of 5 days) for the biofilm treated with vancomycin-only while the biovolume of biofilm under maltodextrin-only treatment did not change. On the other hand, the availability of oxygen within the biofilm under combined treatments indicates that the oxygen was not consumed as much at the top layer and thus, through the concentration gradient, penetrated further into the biofilm. The presence of oxygen at deeper locations can stimulate the aerobic respiration of dormant cells, making them susceptible to antibiotic attack. Antibiotics are effective when cells are metabolically active and utilizing oxygen as an electron acceptor; aminoglycosides are oxygen transport dependent, while beta-lactams and vancomycin inhibit actively dividing cell walls (Bryan, Kowand, & Van Den Elzen, 1979; Mascio, Alder, & Silverman, 2007; Tuomanen, Cozens, Tosch, Zak, & Tomasz, 1986).
4 | CONCLUSIONS
In conclusion, the indication of anaerobic respiration, fermentation and lack of DO availability within biofilm under vancomycin-only treatment indicates that the biofilm has possibly developed tolerance as well as potentialresistance to vancomycin. This is reflected through high biofilm biovolume under vancomycin-only treatment. In contrast, the combined treatments showed that DO was available at deeper locations in the biofilm, possibly triggering the metabolic activity of dormant cells at the bottom location and improved antibiotic efficacy. Porosity did not change when biofilms were challenged with vancomycin-only and maltodextrin-only treatments. However, the porosity within the biofilm was high near the top when it was treated with combined maltodextrin and vancomycin. On the other hand, the relative effective diffusion coefficient increased under vancomycin-only treatment, while a decrease was evident under maltodextrin treatment. A decrease in both biofilm thickness and biovolume for biofilms treated with the combination of maltodextrin and vancomycin was observed. This indicates that the biofilm did not grow during treatment. The opposite was observed in biofilms treated with vancomycin-only.
Acknowledgments
This research was supported in part by a grant from the US Department of Defense (DM110308) and by the Agricultural Animal Health Program at Washington State University (DM110308). All NMR experiments were performed at the Environmental Molecular Sciences Laboratory (EMSL), a national scientific user facility sponsored by the Department of Energy’s Office of Biological and Environmental Research and located at Pacific Northwest National Laboratory. Mia Mae Kiamco was supported by NIH training grant T32 GM008336.
Funding information
US Department of Defense, Grant number: DM110308; National Institutes of Health, Grant number: T32 GM008336; Agricultural Animal Health Program WSU, Grant number: DM110308
Footnotes
ORCID
Ryan S. Renslow http://orcid.org/0000-0002-3969-5570
References
- Al-Jabri AA, Al-Hosni SA, Nzeako BC, Al-Mahrooqi ZH, Nsanze H. Antibacterial activity of Omani honey alone and in combination with gentamicin. Saudi Medical Journal. 2005;26(5):767. [PubMed] [Google Scholar]
- Attinger CE, Janis JE, Steinberg J, Schwartz J, Al-Attar A, Couch K. Clinical approach to wounds: Débridement and wound bed preparation including the use of dressings and wound-healing adjuvants. Plastic and Reconstructive Surgery. 2006;117(7 Suppl):72S. doi: 10.1097/01.prs.0000225470.42514.8f. [DOI] [PubMed] [Google Scholar]
- Barry DM, Kanematsu H. Physical removal of biofilm. In: Kanematsu H, Barry DM, editors. Biofilm and materials science. Cham: Springer International Publishing; 2015. pp. 163–167. [Google Scholar]
- Borriello G, Werner E, Roe F, Kim AM, Ehrlich GD, Stewart PS. Oxygen limitation contributes to antibiotic tolerance of Pseudomonas aeruginosa in biofilms. Antimicrobial Agents and Chemotherapy. 2004;48(7):2659–2664. doi: 10.1128/AAC.48.7.2659-2664.2004. [DOI] [PMC free article] [PubMed] [Google Scholar]
- Bryan LE, Kowand SK, Van Den Elzen HM. Mechanism of aminoglycoside antibiotic resistance in anaerobic bacteria: Clostridium perfringens and bacteroides fragilis. Antimicrobial Agents and Chemotherapy. 1979;15(1):7. doi: 10.1128/aac.15.1.7. [DOI] [PMC free article] [PubMed] [Google Scholar]
- Burg MB, Ferraris JD. Intracellular organic osmolytes: Function and regulation. Journal of Biological Chemistry. 2008;283(12):7309–7313. doi: 10.1074/jbc.R700042200. [DOI] [PMC free article] [PubMed] [Google Scholar]
- Chihara K, Matsumoto S, Kagawa Y, Tsuneda S. Mathematical modeling of dormant cell formation in growing biofilm. Frontiers in Microbiology. 2015;6:534. doi: 10.3389/fmicb.2015.00534. [DOI] [PMC free article] [PubMed] [Google Scholar]
- Cotter JJ, O’Cara JP, Casey E. Rapid depletion of dissolved oxygen in 96-well microtiter plate staphylococcus epidermidis biofilm assays promotes biofilm development and is influenced by inoculum cell concentration. Biotechnology and Bioengineering. 2009;103(5):1042–1047. doi: 10.1002/bit.22335. [DOI] [PubMed] [Google Scholar]
- Cramton SE, Gerke C, Schnell NF, Nichols WW, Gotz F. The intercellular adhesion (ica) locus is present in Staphylococcus aureus and is required for biofilm formation. Infection and Immunity. 1999;67(10):5427–5433. doi: 10.1128/iai.67.10.5427-5433.1999. [DOI] [PMC free article] [PubMed] [Google Scholar]
- Cramton SE, Ulrich M, Gotz F, Doring G. Anaerobic conditions induce expression of polysaccharide intercellular adhesin in Staphylococcus aureus and Staphylococcus epidermidis. Infection and Immunity. 2001;69(6):4079–4085. doi: 10.1128/IAI.69.6.4079-4085.2001. [DOI] [PMC free article] [PubMed] [Google Scholar]
- Dan IA, Diarmaid H. Antibiotic resistance and its cost: Is it possible to reverse resistance? Nature Reviews Microbiology. 2010;8(4):260. doi: 10.1038/nrmicro2319. [DOI] [PubMed] [Google Scholar]
- Delaglio F, Grzesiek S, Vuister GW, Zhu G, Pfeifer J, Bax A. Nmrpipe—a multidimensional spectral processing system based on unix pipes. Journal of Biomolecular Nmr. 1995;6(3):277–293. doi: 10.1007/BF00197809. [DOI] [PubMed] [Google Scholar]
- Ferreira MT, Manso AS, Gaspar P, Pinho MG, Neves AR. Effect of oxygen on glucose metabolism: Utilization of lactate in staphylococcus aureus as revealed by In vivo NMR studies. PLoS ONE. 2013;8(3):12. doi: 10.1371/journal.pone.0058277. [DOI] [PMC free article] [PubMed] [Google Scholar]
- Foucault ML, Courvalin P, Grillot-Courvalin C. Fitness cost of vanA-type vancomycin resistance in methicillin-Resistant staphylococcus aureus. Antimicrobial Agents and Chemotherapy. 2009;53(6):2354. doi: 10.1128/AAC.01702-08. [DOI] [PMC free article] [PubMed] [Google Scholar]
- Fuchs S, Pane-Farre J, Kohler C, Hecker M, Engelmann S. Anaerobic gene expression in Staphylococcus aureus. Journal of Bacteriology. 2007;189(11):4275–4289. doi: 10.1128/JB.00081-07. [DOI] [PMC free article] [PubMed] [Google Scholar]
- Ha PT, Renslow RS, Atci E, Reardon PN, Lindemann SR, Fredrickson JK, Beyenal H. Regulation of electron transfer processes affects phototrophic mat structure and activity. Frontiers in Microbiology. 2015;6:909. doi: 10.3389/fmicb.2015.00909. [DOI] [PMC free article] [PubMed] [Google Scholar]
- Hampton S. Managing biofilm by using dressings. British Journal of Community Nursing. 2015;20(Suppl 6):S10–S12. doi: 10.12968/bjcn.2015.20.Sup6.S10. [DOI] [PubMed] [Google Scholar]
- Hemsley CM, Luo JX, Andreae CA, Butler CS, Soyer OS, Titball RW. Bacterial drug tolerance under clinical conditions is governed by anaerobic adaptation but not anaerobic respiration. Antimicrobial Agents and Chemotherapy. 2014;58(10):5775–5783. doi: 10.1128/AAC.02793-14. [DOI] [PMC free article] [PubMed] [Google Scholar]
- Houssin C, Eynard N, Shechter E, Ghazi A. Effect of osmotic-pressure on membrane energy-linked functions in Escherichia-Coli. Biochimica Et Biophysica Acta. 1991;1056(1):76–84. doi: 10.1016/s0005-2728(05)80075-1. [DOI] [PubMed] [Google Scholar]
- James GA, Swogger E, Wolcott R, Ed P, Secor P, Sestrich J, Stewart PS. Biofilms in chronic wounds. Wound Repair and Regeneration. 2008;16(1):37–44. doi: 10.1111/j.1524-475X.2007.00321.x. [DOI] [PubMed] [Google Scholar]
- Jenkins R, Cooper R. Improving antibiotic activity against wound pathogens with manuka honey in vitro. PLoS ONE. 2012a;7(9) doi: 10.1371/journal.pone.0045600. [DOI] [PMC free article] [PubMed] [Google Scholar]
- Jenkins RE, Cooper R. Synergy between oxacillin and manuka honey sensitizes methicillin-resistant to oxacillin. Journal of Antimicrobial Chemotherapy. 2012b;67(6):1405–1407. doi: 10.1093/jac/dks071. [DOI] [PubMed] [Google Scholar]
- Junka AF, Deja S, Smutnicka D, Szymczyk P, Ziolkowski G, Bartoszewicz M, Mlynarz P. Differences in metabolite profiles of planktonic and biofilm cells in Staphylococcus aureus—H-1 Nucleic Magnetic Resonance search for candidate biomarkers. Acta Biochimica Polonica. 2013;60(4):701–706. [PubMed] [Google Scholar]
- Kiamco MM, Atci E, Khan QF, Mohamed A, Renslow RS, Abu-Lail N, Beyenal H. Vancomycin and maltodextrin affect structure and activity of Staphylococcus aureus biofilms. Biotechnology and Bioengineering. 2015;112(12):2562–2570. doi: 10.1002/bit.25681. [DOI] [PMC free article] [PubMed] [Google Scholar]
- Kohanski MA, Dwyer DJ, Collins JJ. How antibiotics kill bacteria: From targets to networks. Nature Reviews Microbiology. 2010;8(6):423–435. doi: 10.1038/nrmicro2333. [DOI] [PMC free article] [PubMed] [Google Scholar]
- Ledala N, Zhang B, Seravalli J, Powers R, Somerville GA. Influence of iron and aeration on staphylococcus aureus growth, metabolism, and transcription. Journal of Bacteriology. 2014;196(12):2178–2189. doi: 10.1128/JB.01475-14. [DOI] [PMC free article] [PubMed] [Google Scholar]
- Lewandowski Z, Beyenal H. Fundamentals of biofilm research. Boca Raton, FL: CRC Press; 2014. [Google Scholar]
- Liu M, Lu J, Muller P, Turnbull L, Burke CM, Schlothauer RC, Harry EJ. Antibiotic-specific differences in the response of Staphylococcus aureus to treatment with antimicrobials combined with manuka honey. Frontiers in Microbiology. 2015;5:9. doi: 10.3389/fmicb.2014.00779. [DOI] [PMC free article] [PubMed] [Google Scholar]
- Lone AG, Atci E, Renslow R, Beyenal H, Noh S, Fransson B, Call DR. Colonization of epidermal tissue by staphylococcus aureus produces localized hypoxia and stimulates secretion of antioxidant and caspase-14 proteins. Infection and Immunity. 2015;83(8):3026–3034. doi: 10.1128/IAI.00175-15. [DOI] [PMC free article] [PubMed] [Google Scholar]
- Martínez JL, Rojo F. Metabolic regulation of antibiotic resistance. FEMS Microbiology Reviews. 2011;35(5):768–789. doi: 10.1111/j.1574-6976.2011.00282.x. [DOI] [PubMed] [Google Scholar]
- Mascio C, Alder JD, Silverman J. Bactericidal action of daptomycin against stationary-phase and nondividing Staphylococcus aureus cells. Antimicrobial Agents And Chemotherapy. 2007;51(12):4255–4260. doi: 10.1128/AAC.00824-07. [DOI] [PMC free article] [PubMed] [Google Scholar]
- Nayduch D, Cho H, Joyner C. Staphylococcus aureus in the house fly: Temporospatial fate of bacteria and expression of the antimicrobial peptide defensin. Journal of Medical Entomology. 2013;50(1):171–178. doi: 10.1603/me12189. [DOI] [PMC free article] [PubMed] [Google Scholar]
- Peterson MM, Mack JL, Hall PR, Alsup AA, Alexander SM, Sully EK, Gresham HD. Apolipoprotein B is an innate barrier against invasive staphylococcus aureus infection. Cell Host & Microbe. 2008;4(6):555–566. doi: 10.1016/j.chom.2008.10.001. [DOI] [PMC free article] [PubMed] [Google Scholar]
- Raad I, Hanna H, Jiang Y, Dvorak T, Reitzel R, Chaiban G, Hachem R. Comparative activities of daptomycin, linezolid, and tigecycline against catheter-related methicillin-resistant staphylococcus bacteremic isolates embedded in biofilm. Antimicrobial Agents and Chemotherapy. 2007;51(5):1656. doi: 10.1128/AAC.00350-06. [DOI] [PMC free article] [PubMed] [Google Scholar]
- Renslow RS, Babauta JT, Majors PD, Beyenal H. Diffusion in biofilms respiring on electrodes. Energy & Environmental Science. 2013;6(2):595–607. doi: 10.1039/C2EE23394K. [DOI] [PMC free article] [PubMed] [Google Scholar]
- Renslow RS, Majors PD, McLean JS, Fredrickson JK, Ahmed B, Beyenal H. In situ effective diffusion coefficient profiles in live biofilms using pulsed-field gradient nuclear magnetic resonance. Biotechnology and Bioengineering. 2010;106(6):928–937. doi: 10.1002/bit.22755. [DOI] [PMC free article] [PubMed] [Google Scholar]
- Renslow RS, Marshall MJ, Tucker AE, Chrisler WB, Yu XY. In situ nuclear magnetic resonance microimaging of live biofilms in a microchannel. Analyst. 2017;142(13):2363–2371. doi: 10.1039/c7an00078b. [DOI] [PubMed] [Google Scholar]
- Schwan WR, Lehmann L, McCormick J. Transcriptional activation of the staphylococcus aureus putP gene by low-proline-high osmotic conditions and during infection of murine and human tissues. Infection and Immunity. 2006;74(1):399. doi: 10.1128/IAI.74.1.399-409.2006. [DOI] [PMC free article] [PubMed] [Google Scholar]
- Sousa AM, Pereira MO. Pseudomonas aeruginosa diversification during infection development in cystic fibrosis lungs-A review. Pathogens (Basel, Switzerland) 2014;3(3):680. doi: 10.3390/pathogens3030680. [DOI] [PMC free article] [PubMed] [Google Scholar]
- Speers AM, Reguera G. Electron donors supporting growth and electroactivity of Geobacter sulfurreducens anode biofilms. Applied and Environmental Microbiology. 2012;78(2):437. doi: 10.1128/AEM.06782-11. [DOI] [PMC free article] [PubMed] [Google Scholar]
- Stipetic LH, Dalby MJ, Davies RL, Morton FR, Ramage G, Burgess KEV. A novel metabolomic approach used for the comparison of Staphylococcus aureus planktonic cells and biofilm samples. Metabolomics. 2016;12(4):11. doi: 10.1007/s11306-016-1002-0. [DOI] [PMC free article] [PubMed] [Google Scholar]
- Sun JL, Zhang SK, Chen JY, Han BZ. Metabolic profiling of Staphylococcus aureus cultivated under aerobic and anaerobic conditions with H-1 NMR-based nontargeted analysis. Canadian Journal of Microbiology. 2012;58(6):709–718. doi: 10.1139/w2012-046. [DOI] [PubMed] [Google Scholar]
- Tuomanen E, Cozens R, Tosch W, Zak O, Tomasz A. The rate of killing of Escherichia-coli by beta-Lactam antibiotics is strictly proportional to the rate of bacterial-Growth. Journal of General Microbiology. 1986;132:1297–1304. doi: 10.1099/00221287-132-5-1297. [DOI] [PubMed] [Google Scholar]
- van Baal JG. Surgical treatment of the infected diabetic foot. Clinical Infectious Diseases. 2004;39(Supplement_2):S123–S128. doi: 10.1086/383273. [DOI] [PubMed] [Google Scholar]
- Walker M, Metcalf D, Parsons D, Bowler P. A real-life clinical evaluation of a next-generation antimicrobial dressing on acute and chronic wounds. Journal of Wound Care. 2015;24(1):11–22. doi: 10.12968/jowc.2015.24.1.11. [DOI] [PubMed] [Google Scholar]
- Walters MC, Roe F, Bugnicourt A, Franklin MJ, Stewart PS. Contributions of antibiotic penetration, oxygen limitation, and low metabolic activity to tolerance of Pseudomonas aeruginosa biofilms to ciprofloxacin and tobramycin. Antimicrobial Agents and Chemotherapy. 2003;47(1):317–323. doi: 10.1128/AAC.47.1.317-323.2003. [DOI] [PMC free article] [PubMed] [Google Scholar]
- Wolcott RD, Kennedy JP, Dowd SE. Regular debridement is the main tool for maintaining a healthy wound bed in most chronic wounds. Journal of Wound Care. 2009;18(2):54–56. doi: 10.12968/jowc.2009.18.2.38743. [DOI] [PubMed] [Google Scholar]
- Samuel B, editor. Medical microbiology. 4th. Galveston TX: University of Texas Medical Branch at Galveston; 1996. [PubMed] [Google Scholar]
- Händel N, Schuurmans JM, Brul S, ter Kuile BH. Compensation of the metabolic costs of antibiotic resistance by physiological adaptation in escherichia coli. Antimicrobial Agents and Chemotherapy. 2013;57(8):3752. doi: 10.1128/AAC.02096-12. [DOI] [PMC free article] [PubMed] [Google Scholar]
- Yang HF, Lv N, Hu LF, Liu YY, Cheng J, Ye Y, Li JB. In vivo activity of vancomycin combined with colistin against multidrug-resistant strains of Acinetobacter baumannii in a Galleria mellonella model. Infectious Diseases. 2016;48(3):189–194. doi: 10.3109/23744235.2015.1103894. [DOI] [PubMed] [Google Scholar]