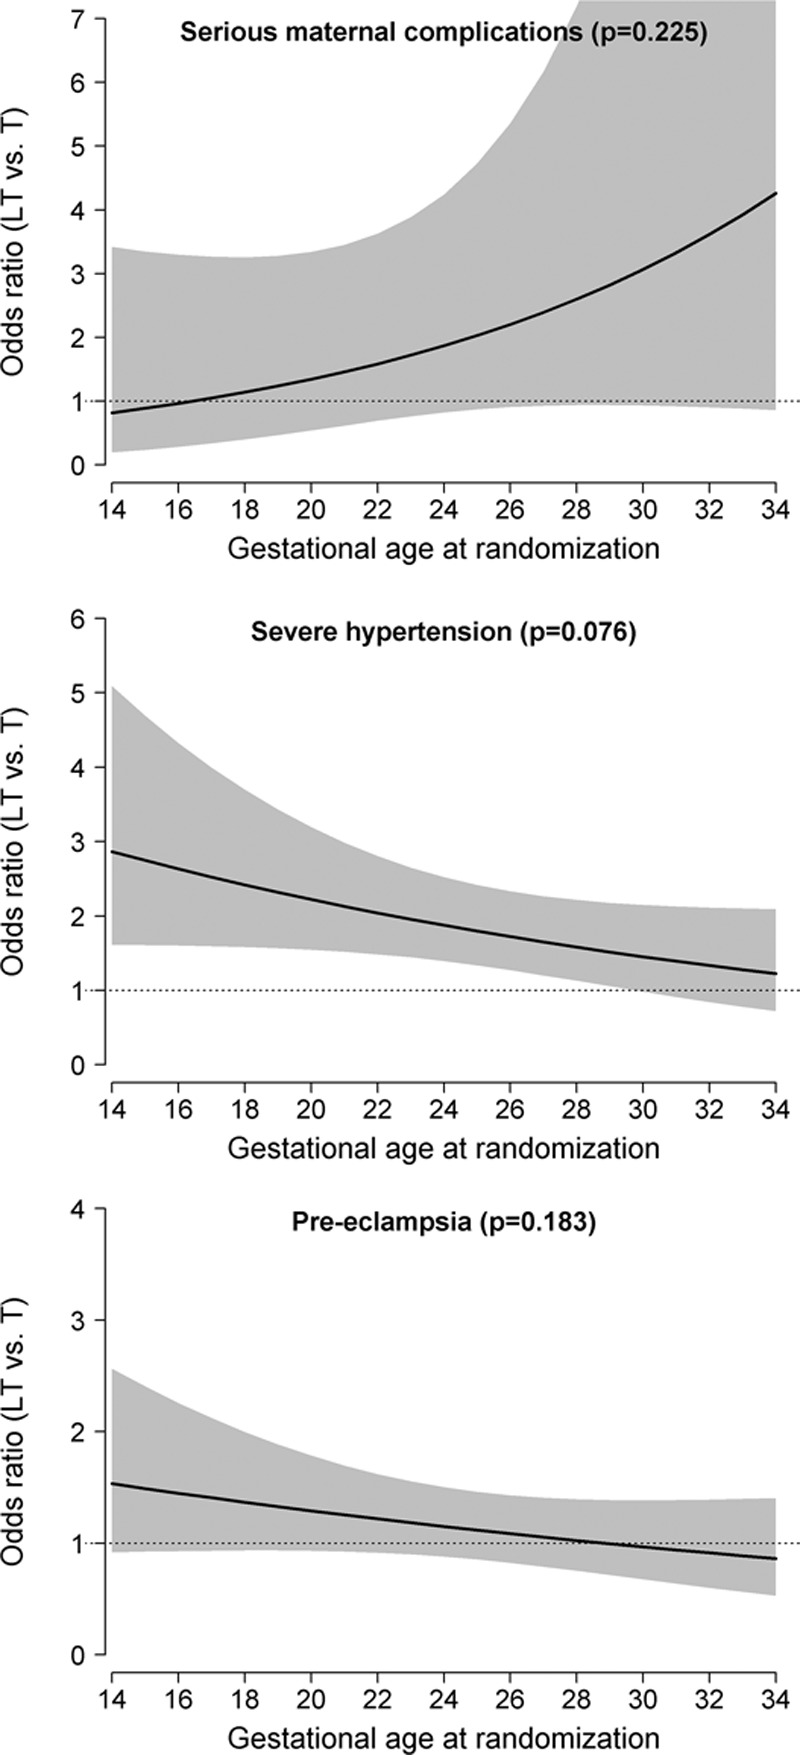
Figure 2.

Odds ratio and 95% confidence intervals for major CHIPS (Control of Hypertension in Pregnancy Study) MATERNAL outcomes in less-tight (LT; vs tight [T]) control groups, according to gestational age at randomization (wk). The P value shown is for the interaction between treatment group and gestational age at randomization treated as a continuous variable on the relevant outcome.
