Abstract
Background:
In a spatially well known and dispersed HIV epidemic, identifying geographic clusters with significantly higher HIV prevalence is important for focusing interventions for people living with HIV (PLHIV).
Methods:
We used Kulldorff spatial-scan Poisson model to identify clusters with high numbers of HIV-infected persons 15–64 years old. We classified PLHIV as belonging to either higher prevalence or lower prevalence (HP/LP) clusters, then assessed distributions of sociodemographic and biobehavioral HIV risk factors and associations with clustering.
Results:
About half of survey locations, 112/238 (47%) had high rates of HIV (HP clusters), with 1.1–4.6 times greater PLHIV adults observed than expected. Richer persons compared with respondents in lowest wealth index had higher odds of belonging to a HP cluster, adjusted odds ratio (aOR) 1.61 [95% confidence interval (CI): 1.13 to 2.3], aOR 1.66 (95% CI: 1.09 to 2.53), aOR 3.2 (95% CI: 1.82 to 5.65), and aOR 2.28 (95% CI: 1.09 to 4.78) in second, middle, fourth, and highest quintiles, respectively. Respondents who perceived themselves to have greater HIV risk or were already HIV-infected had higher odds of belonging to a HP cluster, aOR 1.96 (95% CI: 1.13 to 3.4) and aOR 5.51 (95% CI: 2.42 to 12.55), respectively; compared with perceived low risk. Men who had ever been clients of female sex worker had higher odds of belonging to a HP cluster than those who had never been, aOR 1.47 (95% CI: 1.04 to 2.08); and uncircumcised men vs circumcised, aOR 3.2 (95% CI: 1.74 to 5.8).
Conclusions:
HIV infection in Kenya exhibits localized geographic clustering associated with sociodemographic and behavioral factors, suggesting disproportionate exposure to higher HIV risk. Identification of these clusters reveals the right places for targeting priority-tailored HIV interventions.
Key Words: HIV/AIDS, clustering, geographic differences, Kulldorff spatial-scan statistics, Kenya
BACKGROUND
Kenya accounts for 6% of people living with HIV (PLHIV) in sub-Saharan Africa (SSA) and has the fourth highest adult HIV prevalence in the world and fifth in new HIV infections.1 In 2015, Kenya was estimated to have over 1.5 million HIV-infected adults and children and an annual incidence of about 0.3% among adults aged 15–49 years.2,3 In Kenya, HIV care and treatment efforts in the past 2 decades have led to reduced HIV prevalence from 6.8% in 2007 to 5.6% in 2012 among adults 15–49 years old.4 However, 65% of new infections occur in just 9 of the country's 47 counties.5 At county level, estimated adult HIV prevalence ranges from 24.8% in Siaya to 0.4% in Wajir.3 These disparate burdens present an impetus to plan for better use of resources in HIV epidemic control.
Traditionally, Kenya's national HIV program uses UNAIDS estimation and projections package (EPP) models to estimate national and county HIV prevention and treatment needs.6 Mathematical models provide projections of HIV epidemics, resource allocation, and interventions at subnational levels.7 For example, based on modeling, it is estimated that 14% more infections in Kenya could be averted over a 15-year period (2014–2029) if resources were targeted to the most effective interventions and regions most in need.8 Processes such as commodities estimates and quantification of HIV care and treatment depend heavily on these kind of estimates. However, rarely do such processes focus on more granular units beyond the subnational (county) level. With a worldwide commitment to end the HIV epidemic by 2030,9,10 a more granular versus broadly generalized spatial epidemiological analysis to identify hidden clusters and HIV infection patterns is important because it helps to better target interventions. Conversely, spatially overgeneralized HIV estimates can mask the true pattern of HIV and may lead to inefficient allocation of resources and missed opportunities for prevention and treatment. Pin-pointing cluster differences that impact on HIV diagnosis and linkage to care continuum outcomes could be performed.11 Other assessments of geographical features such as transportation accessibility may show cluster variations impacting linkage to care and outcomes such as viral load suppression.12
Kulldorff and Nagarwalla have described a general method for disease cluster detection using a scan window of a specified size and scans through space to identify clusters.13 The method tests if the number of individuals with a disease occurs at random over space or if any clusters can be detected. This method has been applied in multiple studies owing to its efficiency in identifying clusters. Spatial clustering patterns may exist in relation to physical geographical features: for example, a road or railway network, commercial activity such as large farms and their positioning or proximity of clusters to such features. Cluster analysis and mapping may be used to identify “micro-epidemics” in certain geographic areas such as rural communities,14 populations at higher risk of HIV infection,15 demonstrate decline in HIV prevalence,16 key populations such as female sex workers (FSWs),17 and for assessing access to HIV-related services such as HIV testing and counseling18,19 or provision of antiretroviral treatment.20 In addition, mapping may be used for allocation of targets,7 thereby improving efficiencies in resource allocation.
HIV spatial clustering studies have rarely used nationwide population-based survey data. Yet, there is opportunity to explore associations between spatial clustering, individual, and ecological characteristics. Population-based surveys provide high quality demographic, socioeconomic, and behavioral data at individual level and additional ecological data that relate to where individuals live which may determine risk of exposure including sexual partnerships. In Kenya, HIV epidemic is generally considered to be concentrated in 5 high-burden counties (Homabay, Kisumu, Migori, Siaya, and Nairobi) with 50% of the unmet antiretroviral treatment need.21 We conducted geospatial analysis on data from a nationally representative Kenya AIDS Indicator Survey (KAIS) 2012 to identify clusters with higher rates of HIV-infected persons 15–64 years old. In this article, we have described spatial-epidemic clustering of HIV prevalence in Kenya beyond the well-known subnational pattern. We have also explored relationships between HIV clustering and sociodemographic and behavioral risk indicators, awareness of HIV status and access to HIV services such as HIV testing services (HTS), and voluntary medical male circumcision.
METHODS
Study Design and Population
The methods used in KAIS 2012 have been previously described.22 In brief, KAIS is a cross-sectional household survey whose target population was adults aged 15–64 years and children aged 18 months to 14 years. The survey was conducted from October 2012 to February 2013 using a stratified 2-stage cluster (survey locations) sample to identify households and within households, eligible respondents were interviewed. The North Eastern region was not surveyed because of regional insecurity. KAIS 2012 study locations were sampled from the National Sample Survey and Evaluation Programme (NASSEP V) sampling frame which is developed and maintained by the Kenya National Bureau of Statistics (KNBS). All households in each sampled cluster were geocoded using Global Information System (GIS), at the time of sampling frame development. However, to provide for confidentiality, cluster geocentroids were used for data aggregated at cluster level. This analysis was restricted to respondents aged 15–64 years with a confirmed HIV-positive test result from the national testing laboratory.
Data Collection Methods
Participants were interviewed using a standardized questionnaire regarding household and demographic characteristics, biobehavioral factors, and use of HIV-related services such as HTS and voluntary medical male circumcision. Use of Information and Communication Technologies (ICT) for data collection in KAIS has been described elsewhere.23 Data were collected on tablet computers (Mirus Innovations, Mississauga, Ontario, Canada) and securely transmitted electronically to a central database in Nairobi. Blood was obtained and tested for HIV antibodies at the National HIV Reference Laboratory (NHRL) using the Vironostika HIV-1/2 UNIF II Plus O Enzyme Immunoassay (bioMérieux, Marcy d'Etoile, France) as the screening assay and the Murex HIV.1.2.O HIV Enzyme Immunoassay (DiaSorin, SpA, Saluggia, Italy) as the confirmatory assay.
Selection of Variables
Commonly, determinants of HIV epidemic are grouped into 3: sociocultural, socioeconomic, and epidemiological. Behavioral factors may include condom use, age at the onset of sexual activity, and sexual intercourse with multiple and nonregular partners; others include condom use, age at the onset of sexual activity, and sexual intercourse with multiple and nonregular partners.24 We included sex, age, region, residence, and wealth index (calculated based on household characteristics and ownership of assets measures captured in the household questionnaire). The wealth index was generated using factor analysis calculated using standard methods,25 and the resulting indices were grouped into 5 quintiles from lowest to highest. Other key variables included: marital status, education level, employment, travel, awareness of HIV status, ever tested, being sexually active in the past year, consistent condom use, number of lifetime sex partners, and among men, circumcision and ever having been a client of FSWs.
Spatial-Scan Methodology
We determined clusters with significant numbers of HIV-infected individuals by using a Poisson-based model performed through spatial-scan statistics program SaTScan version 9.4,26 (downloadable from http://www.satscan.org). The number of HIV-positive persons in a cluster was assumed to be Poisson-distributed according to an underlying population at risk. The population at risk was determined from the number of respondents tested and inverse calculation based on survey weights. The spatial-scan statistic was calculated using likelihood ratio test and Monte Carlo simulations to calculate the maximum likelihood ratio.13,27 We set the maximum number of standard Monte Carlo replications to 999 and considered a cluster to be statistically significant when its log likelihood ratio (LLR) was greater than the standard Monte Carlo critical values at P < 0.05. The most likely clusters were reported alongside their log likelihood ratio, relative risks, and P values.
The Kulldorff spatial cluster detection looped over all the 358 survey locations. Using the observed cases, the likelihood of each cluster being a high prevalence (HP) or low prevalence (LP) was computed using a purely spatial Poisson model. For the purpose of classifying HP clusters and grouping the PLHIV as belonging to HP clusters, we took all study clusters that had a significant P value of <0.05 identified after cluster analysis and grouped respondents as belonging to HP clusters and conversely for LP clusters. To avoid detection of large clusters, we assumed a maximum of 30% of the population were at risk and defined a sizeable scan window with a maximum diameter of 100 km for 3 reasons; comparison with other studies, for example,15,28 reasonable HIV program implementation reach and to avoid biasing our analysis to smaller clusters. Consideration for a high proportion of population at risk has been suggested by Kulldorff et al.13 Conventionally, if the proportion at risk is unknown, 50% is set as the default but may lead to identification unnecessarily large and less informative clusters.29 The proportion of adults at highest risk of HIV infection is unknown because in general population surveys, it is not possible to segregate most-at-risk populations. Given that 34% of the population in Kenya are aged 15–24 years,30 to be modest in our estimation, we assumed 30% of the adult population were at greatest risk in a generalized epidemic such as Kenya's. This age category corresponds to those who have highest HIV prevalence.4
Characterizing Respondents in HP Clusters
Results of identified clusters were imported into Statistical Analysis System (SAS) version 9.3 for statistical analyses.31 We classified persons as belonging to HP vs LP clusters. Using this classification, we assessed distributions and associations of clustering with sociodemographic and biobehavioral HIV risk factors. We used PROC SURVEYFREQ in SAS to do χ2 tests to compare weighted proportions. We tested for associations for social demographic, behavioral, male circumcision, and HTS utilization to belonging to a HP cluster using PROC SURVEYLOGISTIC in SAS and presented both unadjusted and adjusted odds ratios (aORs). Mapping of identified clusters and related spatial features was performed using Quantum GIS (QGIS) version 2.16.
Characterizing HP Clusters
After mapping, we visually reviewed the clusters of interest (HP clusters) regarding proximity to or located within features of interest such as trade centers, commercial activities such as large tea plantations or flower farms, near an informal settlement, etc. We added an Open Street Map layer and overlaid the centroid coordinates displayed as circles of varying sizes depending on the estimated number of HIV-infected to qualitatively characterize HP clusters.
Ethics Approval and Consent to Participate
This study was approved by the Kenya Medical Research Institute's (KEMRI) Ethical Review Committee (ERC), the US Centers for Disease Control and Prevention's (CDC) Institutional Review Board (IRB), and the Committee on Human Research of the University of California, San Francisco (UCSF).
Consent for Publication
At household level, the head of household consented to the household questionnaire; the heads of households were adults aged 18–64 years or emancipated individuals with no parent or guardian or not living with their parent/guardian. Individual consent or assent was sought by the field interviewer for all eligible household members to participate in the individual questionnaires. In the case of participants aged 10–17 years, consent was obtained from a parent/guardian or other adult responsible for the child/youth health and welfare before the child/youth was asked for his/her assent. Oral informed consent for HIV testing was required for adults and emancipated minors. Verbal informed consent with a signature of the interviewer on the consent form served as documentation of the consenting.
RESULTS
HIV Spatial Clustering Levels
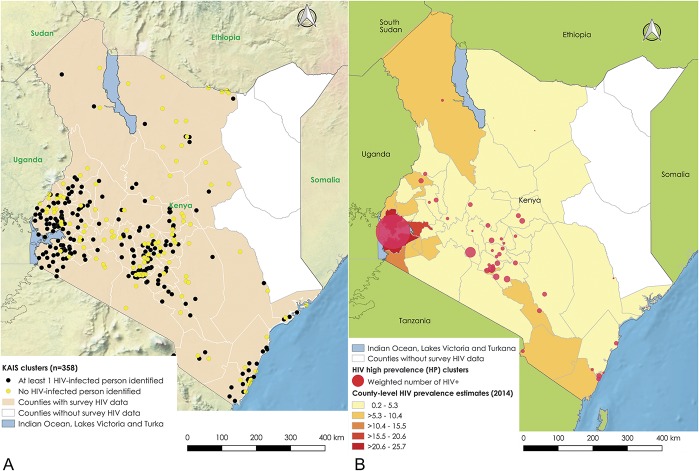
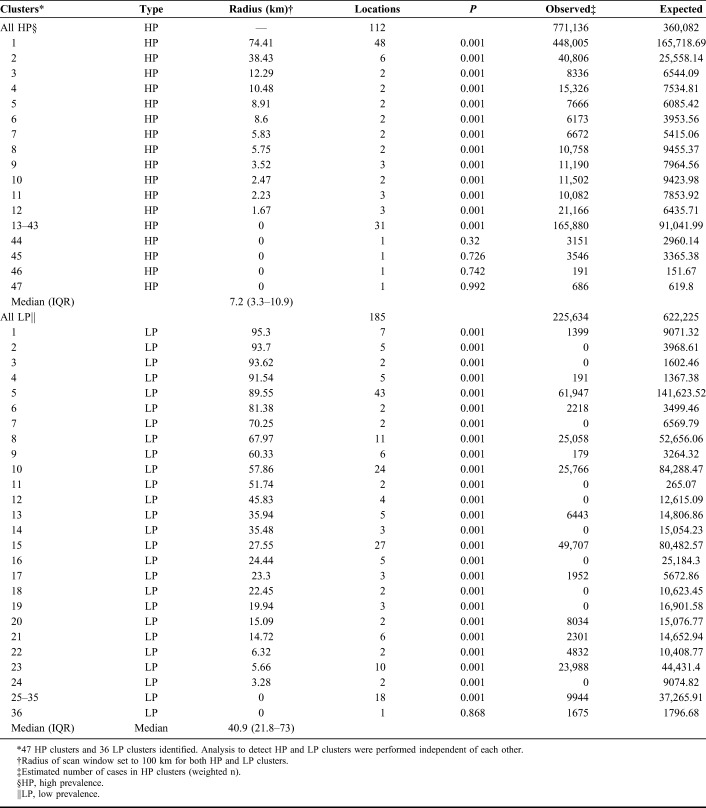
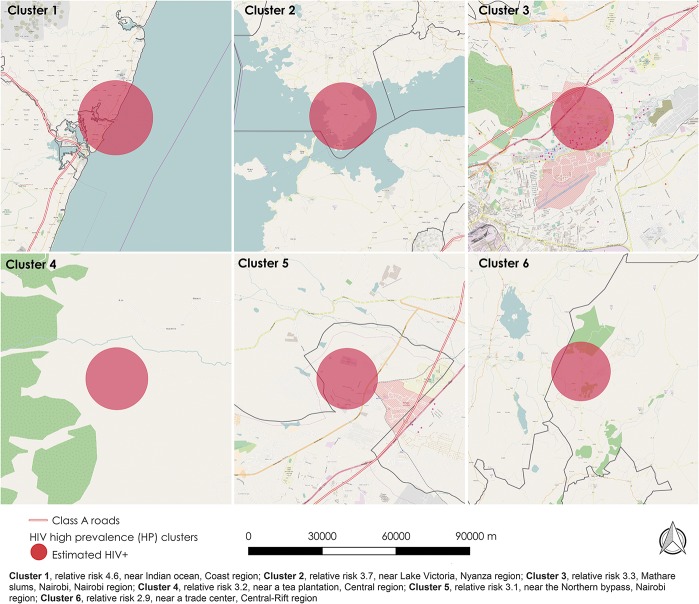
Of 358 survey clusters, 238 (66.5%) had at least 1 HIV-infected person (Fig. 1). Of those, about half, 112/238 (47%) had high rates of HIV (HP clusters), with 1.1–4.5 times greater PLHIV 15–64 years old observed than expected. These were grouped into significant HP and LP clusters; 43 of 47 and 35 of 36, respectively (Table 1). Clusters were identified in multiple regions, with the larger clusters in Nyanza region and several in Nairobi, but also in central-Rift Valley, Central, and Coast regions (Fig. 1). The cluster with highest relative risk was near the Indian Ocean, Coast region; followed by 1 near Lake Victoria, Nyanza region; Mathare slums in Nairobi; 2 more in Nairobi region; 1 in a rural area near a tea plantation in Central Kenya; and another cluster in a rural area near a trade center, central-Rift Valley region (Fig. 2). The HP clusters had a median radius of 7.2 km, interquartile range (IQR) 3.3–10.9 km, whereas LP clusters had a median radius of 40.9 km, IQR 21.8–73.0 km (Table 1).
FIGURE 1.
A, Distribution of 358 sampled survey locations, Kenya AIS 2012. The figure shows the distribution of 353 sampled survey locations in Kenya. The North eastern Kenya was not included in the survey. B, Distribution of HP clusters, Kenya AIS 2012, compared with well-known spatial distribution of HIV prevalence. The figure shows the HP clusters in Kenya. The base layer choropleth shows well-known spatial distribution of HIV prevalence at county level.
TABLE 1.
Distribution of Cases in Significant HP and LP Clusters, Kenya AIDS Indicator Survey 2012
FIGURE 2.
Highest burden HP clusters, Kenya AIS 2012, in relation to geographic features of interest. The figure shows the distribution of top 4 highest burden HP clusters in order of relative risk. The base layer shows geographic features of interest where these clusters are located.
Characterizing HIV Clustering
Sociodemographic Factors and HIV Clustering
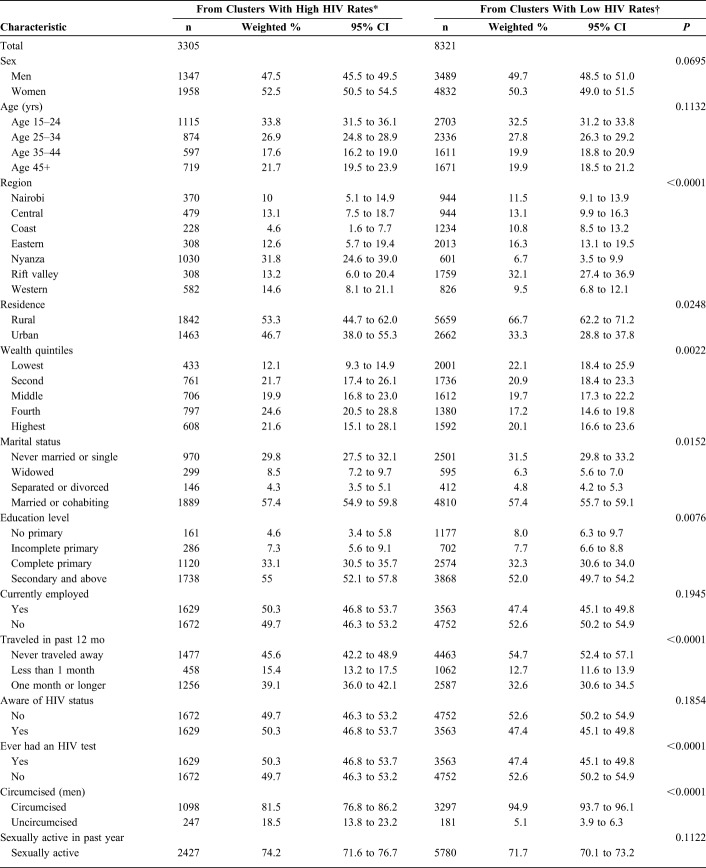
Nearly two-thirds of the respondents in LP clusters were from rural areas 66.7% [95% confidence interval (CI): 62.2 to 71.2] vs 53.3% (95% CI: 44.7 to 62.0) in HP clusters (P = 0.025). More respondents in LP than HP clusters were categorized as belonging to lowest wealth quintile 22.1% (95% CI: 18.4 to 25.9) vs 12.1% (95% CI: 9.3 to 14.9), P = 0.002. There were more widows/widowers living in HP clusters than in LP clusters; 8.5% (95% CI: 7.2 to 9.7) vs 6.3% (95% CI: 5.6 to 7.0), P = 0.015. Fewer respondents in HP clusters had no primary education, 4.6% (95% CI: 3.4 to 5.8) vs 8.0% (95% CI: 6.3 to 9.7) in LP clusters, P = 0.008. More respondents had traveled away from home for more than 1 month in HP vs LP clusters; 39.1% (95% CI: 36.0 to 42.1) vs 32.6% (95% CI: 30.6 to 34.5), P < 0.001.
Biobehavioral Factors and HIV Clustering
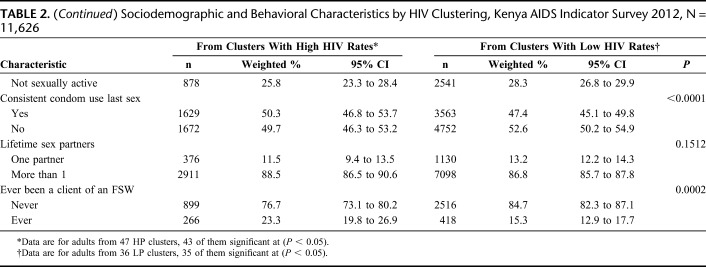
There were fewer circumcised men in HP vs LP clusters; 81.5% (95% CI: 76.8 to 86.2) vs 94.9% (95% CI: 93.7 to 96.1), P < 0.001. More men had ever been clients of FSWs in HP vs LP clusters; 23.3% (95% CI: 19.8 to 26.9) vs 15.3% (95% CI: 12.9 to 17.7), P = 0.0002.
Respondents were distributed similarly across HP and LP clusters by sex (P = 0.070), age (P = 0.113), employment status (P = 0.195), awareness of HIV status (P = 0.185), reported sexual activity in the past year (P = 0.112), and number of lifetime sex partners (P = 0.151) (Table 2).
TABLE 2.
Sociodemographic and Behavioral Characteristics by HIV Clustering, Kenya AIDS Indicator Survey 2012, N = 11,626
Associations of Sociodemographic and Biobehavioral Factors With HIV Clustering
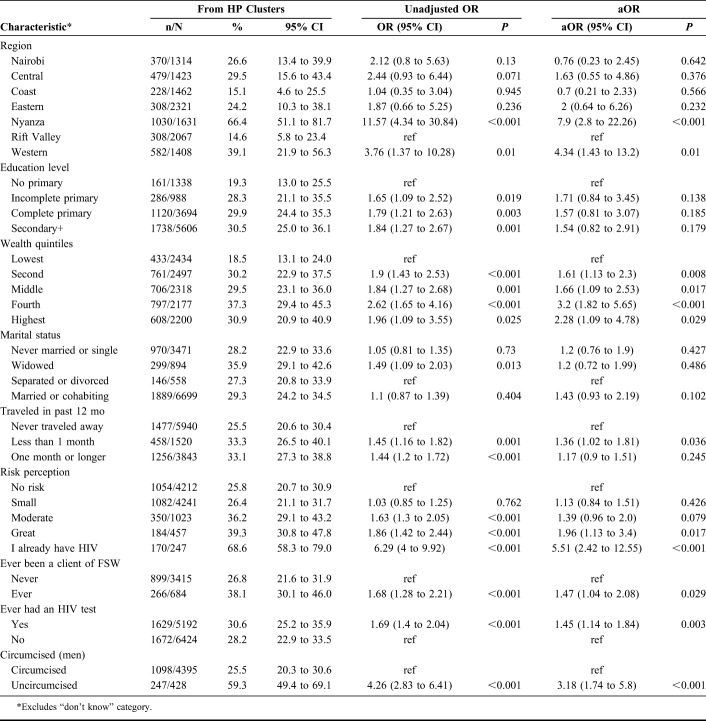
In adjusted analysis, persons in the second, middle, fourth, and highest wealth quintiles compared with those belonging to the lowest wealth index had higher odds of belonging to a HP cluster. Respondents who perceived themselves to have greater risk or already had HIV had higher odds of belonging to a HP cluster compared with those who perceived themselves as having no risk, aOR 1.96 (95% CI: 1.13 to 3.4) and aOR 5.51 (95% CI: 2.42 to 12.55), respectively; men who had ever been clients of FSW had higher odds of belonging to a HP cluster than those who had never been, aOR 1.47 (95% CI: 1.04 to 2.08); persons who had ever had an HIV test had higher odds of belonging to a HP than LP cluster aOR 1.45 (95% CI: 1.14 to 1.84) and uncircumcised men had higher odds of belonging to a HP cluster than circumcised, aOR 3.2 (95% CI: 1.74 to 5.8) (Table 3).
TABLE 3.
Factors Associated With Being in a High HIV-Prevalence Cluster*, Kenya AIDS Indicator Survey 2012
DISCUSSION
Why These Analyses Are Important
The results of our analyses indicate that it is possible to obtain more granular geographical variation in HIV prevalence, expanding our insights into the spatial distribution of HIV in Kenya. In our analyses, we have demonstrated that survey data can be used to show HP clusters in unexpected LP regions in a generalized epidemic. Our findings strengthen the move to support geographically targeted intervention packages for HIV-infected persons and/or most-at-risk. Information about these smaller foci in otherwise LP areas is especially important with the programmatic focus on the subnational units with the highest HIV burden and prevalence.
HIV Spatial Clustering in Kenya
Our observed spatial variation in HIV prevalence highlights clustered HIV prevalence across Kenya within microepidemics of varying magnitudes. Such microepidemics have been observed in other SSA countries.32–34 High HIV prevalence clusters were found in medium generalized epidemic regions; for example, in some parts of Central Kenya and Central-Rift Valley that have considerably lower HIV prevalence of 3.8% and 4.3%, respectively, compared with the national prevalence of 5.6%.4 Most of the HP clusters were near a lake/river, major road highway, economic hub, or in highly productive agricultural zones such as tea-growing areas and flower farms. HP clusters in Nairobi region were in informal settlements. Our study indicates that there are pockets of higher HIV infection that otherwise may not be well described in a generalized and spatially diffused epidemic. Such pockets of higher HIV rates have been identified in other SSA countries even in the context of generalized epidemics.14,15
Population Distribution Within Clusters
In our analyses, we identified HP clusters that were about half in size compared with LP clusters. This may indicate more intense and localized pockets of infection, as opposed to diffused infections. We had similar number of men and women in both HP and LP clusters and similar age distributions by cluster types. This indicates that population demographics may not play a role in clustering as do behavioral or structural factors. Expectedly, a higher proportion of study clusters categorized as HP were in Nyanza region which has the highest HIV prevalence in Kenya, at 14.9% vs the 5.6% national prevalence.4 We found that two-thirds of respondents in LP clusters were from rural areas compared with half of those from HP clusters indicating that degree of urbanization has a big role to play in clustering. This is corroborated by the higher income among residents in HP clusters and the smaller number of respondents in HP vs LP clusters reporting no education. There were more widows/widowers living in HP clusters than in LP clusters, perhaps an indication of higher HIV-associated mortality as has been described elsewhere in SSA.35 The disproportionately high number of widows/widowers found in HP clusters may additionally mean a higher HIV-associated mortality of spouses in areas with disproportionate higher HIV rates.
Clustering, Social, and Behavioral Patterns
We found that there were more respondents in HP clusters who had traveled away from home for ≥1 month as compared to LP clusters. Although people travel for various reasons, most extended travel is work related. Work-related migration may mean access to disposable income and sexual partners during travel, hence higher potential for exposure to HIV infection. In our analysis, more residents in HP clusters had ever had an HIV test compared with those in LP clusters may affirm these results because use of HTS may be related to perception of risk. It has been observed in SSA that seeking HIV testing is associated with perception of higher risk,36 and the converse may imply that perception of low risk may deter HIV testing. There was an overall pattern of greater sexual risk in HP clusters compared with LP clusters, with a higher proportion of respondents being sexually active, fewer persons reporting using condoms consistently, more lifetime sexual partners on average and also more men in HP clusters that had ever been clients of FSWs. Rates of male circumcision were lower in HP clusters, with lower circumcision rates associated with higher risk of HIV acquisition and transmission in multiple studies including randomized control trials in SSA.37–43
Limitations
Our analysis is subject to a few limitations. First, the actual population size data per cluster was not available; hence, we worked back to estimate the cluster population size using the household weights. KAIS 2012 did not include the former North Eastern Province, which generally has very low HIV prevalence; hence, the findings presented here may not be nationally representative. It would have been useful to assess whether there are HP clusters in a region where HIV prevalence is very low. KAIS was not designed to capture key populations such as FSWs, men who have sex with men, or person who inject drugs; hence, this analysis of clustering focuses on risks in the general population and may not explicitly reveal patterning related to KP spatial distribution. There may be other individual characteristics which we did not include, yet they may confound the associations with HIV clustering. However, we believe that we captured the most important demographic and behavioral factors that can be easily collected in household interviews. Finally, the proportion of adults at risk of HIV infection is unknown because in general population surveys, it is not possible to segregate most-at-risk populations. Hence, we assumed 30% of the adult population were at greatest risk because we wanted to be modest in our estimation.
CONCLUSIONS
Our analyses provide information on finer geographic areas of focus in developing HIV prevention and treatment activities. Hence, resource allocation needs to be performed equitably as opposed to equally across regions and subnational units. The HIV program in our setting may need to rethink targeting of interventions for specific populations such as workers at large commercial agricultural or transport corridors, or underserved population in urban informal settlements. Other considerations such as enhanced HTS for persons perceiving themselves as having a high risk of HIV acquisition, interventions targeting widows and widowers such as accelerated HTS and linkage to care and treatment. Finding hidden HIV clusters to support geographic-oriented HIV interventions in Kenya is an important consideration in developing country operational plans to improve resource allocation. We suggest the need to integrate more granular analyses, lest we overlook geographically smaller HP foci.
ACKNOWLEDGMENTS
The authors thank the survey teams for their work during KAIS data collection and all persons who participated in this national survey. The authors thank Angela Broad, Silas Mulwa, Serenita Lewis, Yakubu Owolabi, Timothy Kellogg, and Mike Grasso for their input on the development of the EDC system; Nicky Okeyo and Daniel Kwaro for their technical support; Wolfgang Hladik, Mike Grasso, and George Rutherford for reviewing and providing input on the article; and the KAIS Study Group for their contribution to the design of the survey and collection of the data set: Willis Akhwale, Sehin Birhanu, John Bore, Angela Broad, Robert Buluma, Thomas Gachuki, Jennifer Galbraith, Anthony Gichangi, Beth Gikonyo, Margaret Gitau, Joshua Gitonga, Mike Grasso, Malayah Harper, Andrew Imbwaga, Muthoni Junghae, Mutua Kakinyi, Samuel Mwangi Kamiru, Nicholas Owenje Kandege, Lucy Kanyara, Yasuyo Kawamura, Timothy Kellogg, George Kichamu, Andrea Kim, Lucy Kimondo, Davies Kimanga, Elija Kinyanjui, Stephen Kipkerich, Danson Kimutai Koske, Boniface O. K'Oyugi, Veronica Lee, Serenita Lewis, William Maina, Ernest Makokha, Agneta Mbithi, Joy Mirjahangir, Ibrahim Mohamed, Rex Mpazanje, Nicolas Muraguri, Patrick Murithi, Lilly Muthoni, James Muttunga, Jane Mwangi, M.M., Sophie Mwanyumba, Francis Ndichu, Anne Ng'ang'a, J.N., John Gitahi Ng'ang'a, Lucy Ng'ang'a, Carol Ngare, Bernadette Ng'eno, Inviolata Njeri, David Njogu, Bernard Obasi, Macdonald Obudho, Edwin Ochieng, Linus Odawo, Jacob Odhiambo, Caleb Ogada, Samuel Ogola, David Ojakaa, James Kwach Ojwang, George Okumu, Patricia Oluoch, T.O., Kenneth Ochieng Omondi, Osborn Otieno, Yakubu Owolabi, Bharat Parekh, George Rutherford, Sandra Schwarcz, Shanaaz Sharrif, Victor Ssempijja, Lydia Tabuke, Yuko Takanaka, Mamo Umuro, Brian Eugene Wakhutu, Celia Wandera, John Wanyungu, Wanjiru Waruiru, A.W., Paul Waweru, Larry Westerman, and Kelly Winter.
Footnotes
This publication was made possible by support from the US President's Emergency Plan for AIDS Relief (PEPFAR) through cooperative agreements (#PS001805, GH000069-05, and PS001814) from the US Centers for Disease Control and Prevention (CDC), Division of Global HIV &TB (DGHT). KAIS 2012 was also funded in part by support from the Global Fund, World Bank, and the Joint United Nations Team for HIV/AIDS.
Presented as a poster in CROI 2017; February 13–16, 2017, Seattle, WA.
The authors have no conflicts of interest to disclose.
REFERENCES
- 1.Joint United Nations Programme on HIV/AIDS (UNAIDS). The GAP Report 2015 UNAIDS, Geneva, Switzerland; 2015. [Google Scholar]
- 2.National AIDS and STI Control Program (NASCOP) Kenya Ministry of Health, National AIDS Control Council (NACC). Kenya AIDS Response Progress Report 2016. Nairobi, Kenya: National AIDS Control Council (NACC); 2016. [Google Scholar]
- 3.National AIDS and STI Control Programme Ministry of Health, National AIDS Control Council (NACC). Kenya HIV Estimates 2015. Nairobi, Kenya: National AIDS Control Council (NACC); 2015. [Google Scholar]
- 4.National AIDS and STI Control Programme (NASCOP). Kenya AIDS Indicator Survey 2012: Final Report; 2014. Available at: http://nacc.or.ke/wp-content/uploads/2015/10/KAIS-2012.pdf. [Google Scholar]
- 5.National AIDS/STI Control Program. Kenya HIV Prevention Revolution Road Map. Nairobi, Kenya: National AIDS and STI Control Program (NASCOP); 2014. [Google Scholar]
- 6.Ghys PD, Brown T, Grassly NC, et al. The UNAIDS Estimation and Projection Package: a software package to estimate and project national HIV epidemics. Sex Transm Infect. 2004;80(suppl 1):5–10. [DOI] [PMC free article] [PubMed] [Google Scholar]
- 7.Kerr CC, Stuart RM, Gray RT, et al. Optima: a model for HIV epidemic analysis, program prioritization, and resource optimization. J Acquir Immune Defic Syndr. 2015;69:365–376. [DOI] [PubMed] [Google Scholar]
- 8.Anderson SJ, Cherutich P, Kilonzo N, et al. Maximising the effect of combination HIV prevention through prioritisation of the people and places in greatest need: a modelling study. Lancet. 2014;384:249–256. [DOI] [PubMed] [Google Scholar]
- 9.Joint United Nations Programme on HIV/AIDS (UNAIDS). Highlights from the High-level Side Event: Fast-track Ending the AIDS Epidemic by 2030; 2014. [Google Scholar]
- 10.Joint United Nations Programme on HIV/AIDS (UNAIDS). UNAIDS 2016–2021 strategy: on the fast-track to end AIDS. 2015:1–120. Available at: http://www.unaids.org/sites/default/files/media_asset/20151027_UNAIDS_PCB37_15-18_EN_rev1.pdf.
- 11.Ransome Y, Dean LT, Crawford ND, et al. How do social capital and HIV/AIDS outcomes geographically cluster and which sociocontextual mechanisms predict differences across clusters? J Acquir Immune Def Syndr. 2017;76:13–22. [DOI] [PMC free article] [PubMed] [Google Scholar]
- 12.Goswami ND, Schmitz MM, Sanchez T, et al. Understanding local spatial variation along the care continuum: the potential impact of transportation vulnerability on HIV linkage to care and viral suppression in high-poverty areas, Atlanta, Georgia. 2016;77(7):616–623. 10.1097/QAI.0000000000000914. [DOI] [PMC free article] [PubMed] [Google Scholar]
- 13.Kulldorff M, Nagarwalla N. Spatial disease clusters: detection and inference. Stat Med. 1995;14:799–810. [DOI] [PubMed] [Google Scholar]
- 14.Wand H, Ramjee G. Targeting the hotspots: investigating spatial and demographic variations in HIV infection in small communities in South Africa. J Int AIDS Soc. 2010;13:41. [DOI] [PMC free article] [PubMed] [Google Scholar]
- 15.Cuadros DF, Awad SF, Abu-Raddad LJ. Mapping HIV clustering: a strategy for identifying populations at high risk of HIV infection in sub-Saharan Africa. Int J Health Geogr. 2013;12:28. [DOI] [PMC free article] [PubMed] [Google Scholar]
- 16.Cuadros DF, Abu-raddad LJ. Spatial variability in HIV prevalence declines in several countries in sub-Saharan Africa. Health Place. 2014;28:45–49. [DOI] [PubMed] [Google Scholar]
- 17.UNAIDS Reference Group on Estimates Modelling and Projections. Identifying Populations at Greatest Risk of Infection—Geographic Hotspots and Key Populations; 2013:25–26. [Google Scholar]
- 18.Yao J, Agadjanian V, Murray AT. Spatial and social inequities in HIV testing utilization in the context of rapid scale-up of HIV/AIDS services in rural Mozambique. Health Place. 2014;28:133–141. [DOI] [PMC free article] [PubMed] [Google Scholar]
- 19.Hixson BA, Omer SB, Rio C, et al. Spatial clustering of HIV prevalence in Atlanta, Georgia and population characteristics associated with case concentrations. J Urban Heal. 2011;88:129–141. [DOI] [PMC free article] [PubMed] [Google Scholar]
- 20.Mee P, Collinson MA, Madhavan S, et al. Evidence for localised HIV related micro—epidemics associated with the decentralised provision of antiretroviral treatment in rural South Africa : a spatio–temporal analysis of changing mortality patterns (2007–2010). J Glob Health. 2014;4:010403. 10.7189/jogh.04.010403. [DOI] [PMC free article] [PubMed] [Google Scholar]
- 21.Kenya PEPFAR interagency team. Kenya country operational plan COP 2016: strategic direction summary. 2016. Available at: https://www.pepfar.gov/documents/organization/257644.pdf.
- 22.Waruiru W, Kim AA, Kimanga DO, et al. The Kenya AIDS indicator survey 2012: rationale, methods, description of participants, and response rates. J Acquir Immune Defic Syndr. 2014;66:3–12. [DOI] [PMC free article] [PubMed] [Google Scholar]
- 23.Ojwang' JK, Lee VC, Waruru A, et al. Using information and communications technology in a national population-based survey: the Kenya AIDS indicator survey 2012. J Acquir Immune Defic Syndr. 2014;66(suppl 1):S123–S129. [DOI] [PMC free article] [PubMed] [Google Scholar]
- 24.Temah CT. What Drives HIV/AIDS Epidemic in Sub-Saharan Africa? Vol. 17; 2009. [Google Scholar]
- 25.Rutstein SO, Johnson K. The DHS Wealth Index. DHS Comp Reports No 6. Calverton: ORC Macro; 2004:1–71. [Google Scholar]
- 26.Kulldorff M. SaTScan—software for the spatial, temporal, and space-time scan statistics. 2016. Available at: http://www.satscan.org/.
- 27.Kulldorff M. A spatial scan statistic. Commun Stat Theor Meth. 1997;26(8):1481–1496. 10.1080/03610929708831995. [DOI] [Google Scholar]
- 28.Messina JP, Emch M, Muwonga J, et al. Spatial and socio-behavioral patterns of HIV prevalence in the Democratic Republic of Congo. Soc Sci Med. 2010;71:1428–1435. [DOI] [PMC free article] [PubMed] [Google Scholar]
- 29.Han J, Zhu L, Kulldorff M, et al. Using Gini coefficient to determining optimal cluster reporting sizes for spatial scan statistics. Int J Health Geogr. 2016;15:1–11. [DOI] [PMC free article] [PubMed] [Google Scholar]
- 30.Kenya National Bureau of Statistics (KNBS). The 2009 Kenya population and housing census - population distribution by age, sex and administrative units. 2010;IC:546. Available at: http://www.knbs.or.ke/index.php?option=com_phocadownload&view=category&download=584:volume-1c-population-distribution-by-age-sex-and-administrative-units&id=109:population-and-housing-census-2009&Itemid=599.
- 31.SAS Institute Inc. Statistical analysis system. SAS for windows. Cary, NC. [Google Scholar]
- 32.Tanser F, Bärnighausen T, Cooke GS, et al. Localized spatial clustering of HIV infections in a widely disseminated rural South African epidemic. Int J Epidemiol. 2009;38:1008–1016. [DOI] [PMC free article] [PubMed] [Google Scholar]
- 33.Zulu LC, Kalipeni E, Johannes E. Analyzing spatial clustering and the spatiotemporal nature and trends of HIV/AIDS prevalence using GIS: the case of Malawi, 1994–2010. BMC Infect Dis. 2014;14:1–21. [DOI] [PMC free article] [PubMed] [Google Scholar]
- 34.Mayer JD. The geographical understanding of HIV/AIDS in Sub-Saharan Africa. Nor J Geogr. 2005;59:6–13. [Google Scholar]
- 35.Hosegood V. The demographic impact of HIV and AIDS across the family and household life-cycle: implications for efforts to strengthen families in sub-Saharan Africa. AIDS Care. 2009;21(suppl 1):13–21. 10.1080/09540120902923063. [DOI] [PMC free article] [PubMed] [Google Scholar]
- 36.Musheke M, Ntalasha H, Gari S, et al. A systematic review of qualitative findings on factors enabling and deterring uptake of HIV testing in Sub-Saharan Africa. BMC Public Health. 2013;13:220. [DOI] [PMC free article] [PubMed] [Google Scholar]
- 37.Sgaier SK, Reed JB, Thomas A, et al. Achieving the HIV prevention impact of voluntary medical male circumcision: lessons and challenges for managing programs. PLoS Med. 2014;11:e1001641. [DOI] [PMC free article] [PubMed] [Google Scholar]
- 38.Bailey RC, Plummer FA, Moses S. Reviews Male circumcision and HIV prevention: current knowledge and future research directions. Lancet Infect Dis. 2001;1:223–231. [DOI] [PubMed] [Google Scholar]
- 39.Gray RH, Kigozi G, Serwadda D, et al. Male circumcision for HIV prevention in men in Rakai, Uganda: a randomised trial. Lancet 2007;369:657–666. [DOI] [PubMed] [Google Scholar]
- 40.Puren A, Auvert B, Taljaard D, et al. Randomized, controlled intervention trial of male circumcision for reduction of HIV infection risk: the ANRS 1265 trial. PLoS Med. 2005;2:e298. 10.1371/journal.pmed.0020298. [DOI] [PMC free article] [PubMed] [Google Scholar]
- 41.Bailey R, Gray R, Africa S. Male circumcision to cut HIV risk in the general population the printed journal includes an image merely for illustration. Lancet. 2007;369:617–619. [DOI] [PubMed] [Google Scholar]
- 42.Wawer MJ, Makumbi F, Kigozi G, et al. Circumcision in HIV-infected men and its effect on HIV transmission to female partners in Rakai, Uganda: a randomised controlled trial. Lancet. 2009;374:229–237. [DOI] [PMC free article] [PubMed] [Google Scholar]
- 43.Bailey RC, Moses S, Parker CB, et al. Male circumcision for HIV prevention in young men in Kisumu, Kenya: a randomised controlled trial. Lancet. 2007;369:643–656. [DOI] [PubMed] [Google Scholar]


