

Supplemental Digital Content is Available in the Text.
Key Words: anticoagulants, automated, serum, UHPLC-MS/MS
Abstract
Background:
Direct oral anticoagulants (DOACs) are prescribed for anticoagulation in patients with atrial fibrillation and venous thromboembolic disease. Fixed doses are recommended, but measuring their serum drug concentrations as a basis for dose adjustments may be useful in some clinical settings.
Methods:
An ultra–high-performance liquid chromatography-tandem mass spectrometry method for the analysis of the DOACs apixaban, dabigatran, edoxaban, and rivaroxaban in human serum was developed and validated. A 100-µL serum sample was handled using a pipetting robot. Protein precipitation was performed with 375 µL of 1% formic acid in acetonitrile (vol/vol), and phospholipid removal was performed using a Waters Ostro 96-well plate. The injection volume was 1 µL, and run time was 3.0 minutes.
Results:
The calibration range was 5–800 nmol/L. The between-day precision relative SDs were in the range of 3.3%–10%. Recoveries ranged from 85% to 105%, and matrix effects from 88% to 102%, when corrected with internal standard. Edoxaban was, in contrast to the other DOACs, unstable when stored for more than 6 hours at 30°C. The suitability of the method was demonstrated by analyzing routine samples from 345 patients undergoing anticoagulation treatment.
Conclusions:
The developed method fulfilled the set validation criteria, and its suitability was demonstrated in a routine setting. The instability of edoxaban may complicate the transport of routine samples to the laboratory.
INTRODUCTION
Traditionally, anticoagulation treatment with the vitamin K antagonist warfarin has been the golden standard for stroke prevention in patients with atrial fibrillation and for prophylaxis and treatment of venous thromboembolic disease. However, during the last decade, anticoagulants with a more direct mechanism of action have been developed. These drugs include the direct thrombin inhibitor dabigatran and the factor Xa inhibitors rivaroxaban, apixaban, and edoxaban. As a group name, these drugs are most often referred to as “direct oral anticoagulants” (DOACs), alternatively “new oral anticoagulants” or “non–vitamin K antagonist oral anticoagulants” (NOACs).1–3
DOACs have the advantage of a quicker onset of action than warfarin. However, they also have relatively short elimination half-lives.1,2 This is a challenge because nonadherence can be expected to be even more common for DOACs than for warfarin since the patients are not regularly monitored. Omission of only a few doses will increase the risk of thromboembolic events. Moreover, although DOACs have a lower pharmacokinetic and pharmacodynamic variability than warfarin and also fewer drug–drug interactions, reduced hepatic metabolism and impaired renal function may cause supratherapeutic drug concentrations with an increased risk of bleeding.1–3 Consequently, even when using recommended doses, a certain number of those treated with DOACs will either have high plasma concentrations with an increased risk of bleeding or low plasma concentrations with an increased risk of developing a thromboembolic episode.4 As there seems to be a direct association between the plasma concentration of the DOAC and the anticoagulation effect,5 the existence of therapeutic plasma concentration ranges where the risk of these endpoints is lower can be predicted.
Measuring plasma concentrations of drugs (therapeutic drug monitoring) is generally recommended for drugs with a large pharmacokinetic variability and a narrow therapeutic index, drugs for which it is complicated to measure pharmacodynamic endpoints directly, and drugs where there is a clear association between drug concentrations and a therapeutic effect and/or adverse drug reactions.6 These prerequisites all apply to DOACs. The British Society of Haematology has stated that measuring the plasma drug concentration of DOACs will be appropriate for optimal drug dosage, for example, in patients with impaired renal function, patients subjected to drug–drug interactions, and patients with excessively high or low body weight.7
Various coagulation assays have been proposed for the indirect measurements of apixaban, dabigatran, and rivaroxaban.8–10 Schmitz et al9 compared several coagulation assays with a ultra-performance liquid chromatography-tandem mass spectrometry (UPLC-MS/MS) method and found that some of the assays gave satisfactory results, but the UPLC-MS/MS method gave overall the best precision and accuracy.9 In general, direct measurements of anticoagulant plasma concentrations by LC-MS/MS were recommended, especially at low concentration levels (<50 ng/mL).8–10
Several recent publications describe the use of LC-MS/MS and ultra–high-performance liquid chromatography-tandem mass spectrometry (UHPLC-MS/MS) for the detection and quantification of anticoagulants.9,11–13 Most of these methods used plasma and protein precipitation with acetonitrile or methanol as a sample cleanup. Such precipitation does not remove phospholipids, which can build up on the analytical column and pollute the mass spectrometer source, and thereby contribute to matrix effects (MEs) and reduced sensitivity.14,15 In one recent publication, solid-phase extraction was used as sample preparation method before analysis.12
Only one publication has included all the 4 DOACs apixaban, dabigatran, edoxaban, and rivaroxaban in the same method.11 The study used protein precipitation before turbulent flow LC with high-resolution MS. A direct injection of protein-containing samples was possible using the TurboFlow technology. A manual protein precipitation step before analysis was nevertheless required to increase column lifetime. Thus, this method is less suited for high throughput of samples.
The aim of this study was to develop a semiautomated, simple, and robust routine method for the analysis of apixaban, dabigatran, edoxaban, and rivaroxaban in serum, using acidic acetonitrile protein precipitation and phospholipid removal plates followed by a high-throughput UHPLC-MS/MS analysis. A secondary aim was to evaluate the suitability of the method in a routine setting by analyzing patient samples sent to our laboratory for the quantification of DOACs.
MATERIALS AND METHODS
Chemicals
Reference compounds of apixaban (purity >98%), dabigatran (purity >95%), and rivaroxaban (purity >98%) were purchased from AlsaChim (Illkirch Graffenstaden, France) and TRC (Toronto, Canada). Edoxaban (purity >99%) was from AlsaChim (Illkirch Graffenstaden, France). The internal standards (IS) apixaban-13Cd7, dabigatran-13C6, edoxaban-d6, and rivaroxaban-13C6 with purity of 97% were purchased from AlsaChim (Illkirch Graffenstaden, France). Acetonitrile and methanol used were of LC-MS grade and purchased from Merck (Darmstadt, Germany). Formic acid used for sample preparation was of analysis quality from Merck (Darmstadt, Germany), and formic acid used in mobile phase was 100% Aristar (VWR, Leuven, Belgium). Hydrochloric acid (HCl) used for preparation of stock solutions of dabigatran and dabigatran-13C6 was of AnalaR NORMAPUR type (VWR, Fontenay-sous-Bois, France). All water used was provided from a Millipore A10 system Synthesis filtering system (Billerica, MA). The 2-propanol used for preparation of wash solution for UPLC was of LC grade (Merck, Darmstedt, Germany). External quality control (QC) samples of apixaban, dabigatran, and rivaroxaban in freeze-dried plasma were from ECAT (Voorschoten, the Netherlands), with 2 concentration levels of each analyte. Human blank serum was obtained from healthy blood donors not using any of the anticoagulants (St. Olav University Hospital, Trondheim, Norway).
Preparation of Calibrators and QC Sample Solutions
Preparation of stock solution of calibrators and QC of apixaban, dabigatran, and rivaroxaban was prepared using materials from 2 different suppliers, whereas for edoxaban, only material from one supplier was available. The concentration of stock solutions was 0.1 mmol/L (apixaban) or 1 mmol/L (dabigatran, edoxaban, and rivaroxaban). The solvent used for the preparation of stock solutions was 0.1 mol/L of HCl (dabigatran) or acetonitrile (apixaban, edoxaban, and rivaroxaban). Two sets of working solutions of calibrators and QCs were prepared, one with dabigatran (in water) and one with apixaban, edoxaban, and rivaroxaban in acetonitrile. Dabigatran stock and working solutions were stored at −20°C, and stock and working solutions containing apixaban, edoxaban, and rivaroxaban were stored at 4–8°C. The working solutions were used to prepare calibrator samples of 5, 10, 50, 200, 500, and 800 nmol/L (Std1–Std6, respectively). QCs were prepared in blank serum at 13 nmol/L (QC1), 150 nmol/L (QC2), and 640 nmol/L (QC3). An IS solution was prepared with a concentration of 100 nmol/L in 20% methanol. The standards in serum and IS were stored at −20°C.
Sample Preparation
Automatic sample preparation was performed using a Tecan Freedom Evo pipetting robot (Teacan, Männedorf, Switzerland). Aliquots of 100 µL of Std, QC, or patient sample, in addition to the IS (25 µL), were pipetted onto a 96-well phospholipid removal plate (Ostro Protein Precipitation & Phospholipid Removal Plate, 25 mg; Waters, Milford, MA). Ice-cold acetonitrile with formic acid (1% vol/vol, 375 µL) was added to the wells. The serum samples and acetonitrile were mixed by aspirating thrice with the pipetting robot. The supernatant was separated from the precipitate using a positive pressure unit (positive pressure-96; Waters, Taunton, MA) capturing the phospholipids and precipitated protein in the filtration plate. The eluates were collected in 2-mL sample collection wells (96-well Square collection plate; Waters) and sealed with cap-mat square plugs (silicone/PTFE-treated preslit; Waters).
UHPLC Conditions
An Acquity UPLC I-Class FTN system (Waters) was used for separation, with an Acquity UPLC HSS T3 1.8 µm, 2.1 × 100 mm analytical column and an Acquity UPLC HSS T3 1.8 µm, 2.1 × 5 mm precolumn (Waters, Wexford, Ireland). The injection volume was set to 1 µL. The mobile phase was composed of MilliQ H2O with 0.1% formic acid (A) and acetonitrile (B) with a flow of 0.6 mL/min. Analytes were eluted with a linear gradient from 95% A to 98% B in 3.0 minutes. The column temperature was set to 50°C, and the autosampler temperature was set to 10°C. Preinject and postinject washes were performed with methanol:acetonitrile:2-propanol:MilliQ H2O: formic acid (25:25:25:23:2, vol/vol) for 2 seconds and 6 seconds, respectively.
MS/MS Conditions
A Xevo TQ-S tandem-quadrupole mass spectrometry (Waters, Manchester, United Kingdom) equipped with a Z-spray electrospray interface was used. Positive electrospray ionization was performed in the multiple reaction monitoring (MRM) mode. The capillary voltage was set to 1.0 kV, the source block temperature was set to 120°C, the desolvation gas (nitrogen) was heated to 650°C and delivered at a flow rate of 1000 L/h, and the cone gas (nitrogen) was set to 150 L/h. Dwell times were automatically adjusted with 15–20 data points per peak. MRM transitions, cone voltage, and collision energy for the analytes and IS used in the presented method are shown in Table 1. System operation and data acquisition were controlled using Mass Lynx 4.1 software (Waters). All data were processed with the Target Lynx quantification program (Waters).
TABLE 1.
MRM Transitions, Cone Voltages, Collision Energies, and Retention Times of Analytes and Internal Standards

METHOD VALIDATION
The validation was undertaken according to the guidelines provided by Peters et al16 and the U.S. Department of Health and Human Services, Food and Drug Administration.17
Calibration Curves
Calibration standards were prepared in blank serum at 5.0, 10.0, 50.0, 200, 500, and 800 nmol/L (3 replicates of each standard level). Quadratic calibration curves were based on peak area ratios of the analyte relative to its corresponding IS using weighted (1/x) regression, excluding the origin. The acceptance criteria for the back-calculated concentrations were set to ±10%, and coefficient of determination (R2) should be >0.995.
Limit of Detection and Limit of Quantification
Limit of quantification (LOQ) was determined by spiking blank serum with concentrations of 2.5 and 4 nmol/L, one replicate of each, and analyzed on 10 different days over a period of approximately 3 months. Criteria for signal-to-noise (S/N) for LOQ samples were ≥10, and criteria for precision acceptance were ±20%. Limit of detection (LOD) was determined using spiked blank serum at concentrations of 0.25, 0.5, and 1.25 nmol/L. Acceptance criteria were set to S/N ≥ 3.
Accuracy and Precision
Within-assay precision was determined by analysis of 10 replicates of QC1, QC2, and QC3 in a single assay. The acceptance criterion of coefficient of variation (CV) (%) was set to ≤10%. Between-assay precision was determined by analysis of one replicate of QC1, QC2, and QC3 at 10 days over a period of approximately 3 months. Sample preparation for between-assay precision measurement was performed by 3 different persons. The acceptance criterion of CV for between-assay precision was set to ≤20%. The within-assay precision data were used to determine the accuracy of the method, and the acceptance criterion was set to ≤15%. External QC samples of dabigatran, apixaban, and rivaroxaban were also used to measure the accuracy of the method. Two replicates of 2 different samples of each of these 3 compounds were ordered from ECAT (freeze-dried plasma). The acceptance criterion was a Z value of ≤|2|.
Extraction Recovery
Extraction recovery was determined at 2 concentration levels, QC1 and QC3, with 6 replicates for each concentration. Blank serum samples, QC1, and QC3, were prepared, without addition of IS. The blank serum sample filtrate was spiked to equal concentrations of analytes as QC1 and QC3. In both cases, the IS was added after the extraction step. Recovery was calculated by dividing the response (Peak areaanalyte/Peak areaIS) of the serum sample spiked before sample preparation (A) with the response of the serum sample spiked after sample preparation (B). Recovery was calculated as follows: (A/B) × 100%.
Matrix Effects
MEs were studied using the method proposed by Matuszewski et al.18 Extracted filtrated serum samples of 6 different individuals were spiked to the concentrations of QC1 and QC3. A solution of 80% acetonitrile was spiked to equal concentrations as postspiked QC samples. Identical concentrations of the IS were added to the extracted sample and acetonitrile spiked samples. ME was calculated as ME (%) = (Peak areamatrix/Peak areaacetonitril) × 100. Relative ME was calculated as relative ME (%) = 100 × [(Peak areaanalytematrix/Peak areaIS-matrix)/(Peak areaanalyte-acetonitril/Peak areaIS-acetonitril)]. Acceptance criterion for relative ME was set to 75%–125% and CV (%) of ME was set to ≤15%.
Carryover
Carryover was evaluated by injecting extracted blank samples after an extracted standard containing 1600 nmol/L of apixaban, dabigatran, edoxaban, and rivaroxaban. Acceptance criteria were set to <20% of peak area of Std1.
Selectivity and Specificity
Selectivity of the method was evaluated by checking for interference in the chromatogram at the expected retention times of the analytes in extracted blank samples in 10 different series and in blank serum from 6 different persons. The specificity of the method was evaluated by spiking blank serum with a few compounds with similar molecular weight as apixaban, dabigatran, edoxaban, and rivaroxaban: flupentixol (Mw = 434.53 g/mol), morphine-3-glucuronide (Mw = 461.5 g/mol), morphine-6-glucuronide (Mw = 461.5 g/mol), and pimozide (Mw = 461.55 g/mol). Dabigatran-acylglucuronide (Mw = 647.64 g/mol) was also included for the evaluation of in-source fragmentation to dabigatran.19
Stability
The stability of apixaban, dabigatran, edoxaban, and rivaroxaban in spiked serum samples and in a few patient samples was evaluated at different storage temperatures. Postextraction stability at 10°C was evaluated by reinjection of the extract of Std1–Std6 and QC1–QC3 (n = 3) 3 and 5 days after initial sample preparation. The samples were considered stable if relative deviation was ≤15% of theoretical value. Stability of QC1 and QC3 samples stored at 4–8°C was evaluated up to 5 days. Three replicates of QC1 and QC3 were analyzed after 3 and 5 days of storage at 4–8°C. One patient sample containing rivaroxaban and one containing dabigatran were also included and stored at the same conditions. The storage conditions were considered stable if the relative deviation of QC samples was ≤15% of theoretical value or Day 0 value. Stability of analytes in QC and patient samples at 30°C was tested to mimic a high summer temperature during postal shipment to the laboratory. QC1 (n = 3) and QC3 (n = 3) samples as well as one patient sample were kept at 30°C and analyzed after 3 and 5 days and then reanalyzed and calculated with freshly prepared calibrators. Only patient samples with dabigatran and rivaroxaban were available. The stability of edoxaban was also studied at 24, 48, and 72 hours. The storage conditions were considered stable if the relative deviation of QC samples was ≤15% of Day 0 value or 0-hour value.
Robustness
Variation in retention times (RTs) of the 4 analytes and the 4 ISs was studied in 3 different series/sequences. The RT stability was measured by calculating the relative deviation of the RT and relative RT (RTanalyte/RTIS) of injected samples (Stds and QCs) compared with the average RT and relative RT of Std2 and Std3 in the same sequence.
Drift of signal/area of the 4 analytes and the 4 ISs within a sequence was studied by injecting Std0–Std6 in the beginning and in the end of a sequence with 15–70 samples between the 2 injections.
Application
Results from the analyses of serum samples from patients sent to our laboratory the 1st year after implementing the method for routine use were included in this study. After arrival at the laboratory, the specimens were stored at 4°C for a maximum of 1 week until analysis.
RESULTS AND DISCUSSION
Method Development
During method development, both an Ostro Protein Precipitation & Phospholipid Removal Plate (Ostro plate) and a Supelco Hybrid SPE-plus plate (Supelco, Bellefonte, PA) were tested. The Ostro plate was selected because the extraction recovery was higher for some of the compounds compared with the plate from Supelco (data not shown). The filtration after the protein precipitation was included to remove precipitate and phospholipids, which are known to decrease the lifetime of UPLC columns and increase the frequency for cleaning of the MS.14,15 Using a 96-well plate, it is easy to automate the sample preparation, and the method is suited for analyzing up to 88 patient samples simultaneously. The setup procedure on the pipetting robot is simple, making the sample preparation easy also when a few samples are to be analyzed. The cost per sample is not significantly increased even when only a few samples are analyzed, as the remaining wells in the most expensive consumable, the 96-well Ostro plate, are used for later analysis of DOACs or in other analyses.
During method development, it was noticed that the signal of apixaban-13Cd7 and edoxaban-d6 was up to 50% lower in patient samples compared with blank serum. Therefore, patient samples positive for rivaroxaban or dabigatran were spiked with known concentrations of apixaban and edoxaban to test that the ion suppressions of analyte and internal standard were comparable. This was the case (data not shown) and shows the importance of using matrix-matched internal standards.
Linearity, Limit of Detection, and Limit of Quantification
The linearity results of the calibration curves are listed in Table 2. In the range of 5.0–800 nmol/L, the curves for all 4 analytes were linear (R2 above the acceptance criterion of 0.995). The residuals were found to distribute randomly around zero, and the back-calculated concentrations were <10%. Representative MRM chromatograms of the lowest QC are shown in Figure 1. Total run MRM chromatograms for the 4 analytes are depicted in Supplemental Digital Content 1 (see Figure, http://links.lww.com/TDM/A240). LODs and LOQs are presented in Table 2. As the CV of precision of LOQ samples for edoxaban were >20%, that is, above the set acceptance criteria, the LOQ was set equal to calibration level 1.
TABLE 2.
Calibration Range, Coefficient of Determination (R2), Limit of Detection (LOD), Limit of Quantification (LOQ), Within-Assay Precision, Between-Day Precision, and Bias for Apixaban, Dabigatran, Edoxaban, and Rivaroxaban

FIGURE 1.

MRM chromatograms of apixaban, dabigatran, edoxaban, and rivaroxaban, 13 nmol/L (QC1) of each analyte.
Accuracy and Precision
Within-day and between-day precisions are listed in Table 2. Within-assay CVs were <7% and between-day CVs were ≤10%, which were below the maximum acceptance criteria of 10% and 20%, respectively. The between-day bias using QC1 and QC3 was within acceptance criterion of ±15% (Table 2). The |Z|-scores for the analysis of external QCs (freeze-dried plasma) for apixaban, dabigatran, and rivaroxaban were all ≤ ±1.8.
Recovery and Matrix Effects
The results of extraction recoveries of QC1 and QC3 concentration are presented in Table 3. The extraction recoveries were all between 85% and 105% with CVs ranging from 4.9% to 10.5%. Results from the ME studies are presented in Table 4. Ion enhancement was seen for apixaban, dabigatran, and rivaroxaban and was largest for dabigatran. However, when corrected with the IS for all 4 analytes, the ion enhancement of apixaban, dabigatran, and rivaroxaban disappeared, and the ME shifted from 97%–137% to 88%–102%.
TABLE 3.
Extraction Recoveries of Apixaban, Dabigatran, Edoxaban, and Rivaroxaban
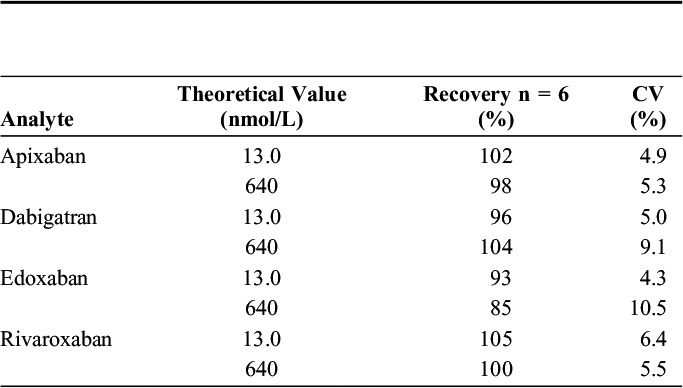
TABLE 4.
Results From Matrix Effect (ME) Studies at 13 (nmol/L) (QC1) and 640 nmol/L (QC3)

The finding shows the importance of using an IS when quantification is based on MS signals. Isotopically labeled standards are expensive, but only a small amount is necessary, and the results are far more reliable.
Carryover
Carryover was studied by comparing the area in blank serum injected after a sample of 1600 nmol/L to the area of Std1 (5 nmol/L). Values found were 14% for apixaban, 0% for edoxaban, 10% for dabigatran, and 16% for rivaroxaban. No spiked standards caused false positive results because of carryover effects.
Selectivity and Specificity
None of the 10 blank serum samples tested showed interfering peaks at the expected retention times of apixaban, dabigatran, edoxaban, or rivaroxaban. The specificity test with dabigatran-acylglucuronide showed that in-source fragmentation occurs, since a peak for MRM transition of dabigatran, m/z 472.3 > 289, is detected at the same retention time (0.83 minutes) as the MRM transition of dabigatran-acylglucuronide, m/z 648.2 > 289.1 (data not shown). This effect has also been reported previously.19 However, as we achieved separation of dabigatran (RT = 0.88 minutes) and the dabigatran-acylglucuronide (RT = 0.83 minutes), an overestimating of dabigatran concentration was thus avoided. MRM chromatograms showing the separation of dabigatran and dabigatran-acylglucuronide are shown in Supplemental Digital Content 2 (see Figure, http://links.lww.com/TDM/A241). None of the other compounds tested were detected positive for any of the 4 analytes.
Stability
Extracted serum samples could be stored at 10°C up to 5 days without any significant loss of apixaban, dabigatran, edoxaban, or rivaroxaban (ie, concentrations were within 15% of the theoretical value). No degradation was seen in spiked serum samples (QC1 and QC3) stored for up to 4 weeks at 4–8°C or in 2 patient samples with dabigatran or rivaroxaban. Apixaban, dabigatran, and rivaroxaban were stable for transportation and storage at 30°C for at least 1 week. Edoxaban was only stable for transportation and storage for 6 hours. After 24 hours at 30°C, the concentration had decreased 17% compared with concentration measured directly after spiking. After 48 and 72 hours, the degradation was >30% and >49%, respectively. Thus, we conclude that patient samples with apixaban, dabigatran, or rivaroxaban can be sent with normal mail without any temperature control, but samples containing edoxaban should be delivered at the laboratory within 6 hours after sampling or be stored cold and sent on ice if the delivery time will be greater than 6 hours.
Robustness
Retention times were found to be stable for all analytes and internal standards with deviations within ±1% for both RT and relative RT.
Occasionally during the validation, the areas of analytes and IS drifted within an analysis sequence, and the relative deviation of measured concentration between the first and second injection for some of Std0–Std6 could be as large as −18% and +22%. Therefore, at implementation of the method in the routine setting, the drifting of area of analytes and IS within a sequence were controlled by reinjection of QC2. If the relative deviation of the measured concentration is more than ±20% the standards, controls and samples are reinjected to ensure reliable results.
Patient Samples
During the first year after implementing the method for routine use, 345 patient samples had been analyzed. The distribution of concentrations for the 4 analytes is presented in Table 5. Based on data from the published literature, we have suggested recommended therapeutic reference ranges of 100–300 nmol/L (50–150 ng/mL) for dabigatran and 50–300 nmol/L (25–250 ng/mL) for rivaroxaban and apixaban.20 It should be noted that we, in contrast to some other laboratories, have chosen not to include a hydrolysis step of possible glucuronidated metabolites of dabigatran. Because we achieved chromatographic separation between dabigatran and a glucuronidated metabolite, the risk of overestimation of the dabigatran concentration due to in-source fragmentation is eliminated. As the glucuronidated metabolites amount to about 15%–20% of the concentration of dabigatran, only21 (on a molar basis), the effect of including or not including the glucuronidated metabolites in the analysis is relatively low.
TABLE 5.
Serum Samples From Patients Sent to Our Laboratory for Analysis of Direct Oral Anticoagulants the 1st Year After the Method was Implemented for Routine Purposes

Because of challenges related to the in vitro instability of edoxaban, analysis of edoxaban is only offered after the doctor has first contacted the laboratory, so we can ensure that the sample will be stored cold after sampling and kept frozen during transport to the laboratory.
CONCLUSION
The developed method for quantification of apixaban, dabigatran, edoxaban, and rivaroxaban fulfilled the predefined validation criteria. Because 88 patient samples can be prepared at the same time and the UHPLC-MS/MS run time per sample is only 3.0 minutes, the method is efficient in a routine setting. The validation demonstrated the importance of using isotopically labeled IS because of the variation in the measured signal in different serum samples. Edoxaban is not stable at 30°C for more than 6 hours. Thus, it is important to point out to clinicians considering to sending an edoxaban sample that the sample should be stored in a refrigerator until shipping, and that the samples preferably should be sent on ice when the transport time to the laboratory is prolonged.
Footnotes
The authors declare no conflict of interest.
Supplemental digital content is available for this article. Direct URL citations appear in the printed text and are provided in the HTML and PDF versions of this article on the journal's Web site (www.drug-monitoring.com).
REFERENCES
- 1.Cheng JW, Barillari G. Non-vitamin K antagonist oral anticoagulants in cardiovascular disease management: evidence and unanswered questions. J Clin Pharm Ther. 2014;39:118–135. [DOI] [PubMed] [Google Scholar]
- 2.Mani H, Lindhoff-Last E. New oral anticoagulants in patients with nonvalvular atrial fibrillation: a review of pharmacokinetics, safety, efficacy, quality of life, and cost effectiveness. Drug Des Devel Ther. 2014;8:789–798. [DOI] [PMC free article] [PubMed] [Google Scholar]
- 3.Fenger-Eriksen C, Münster AM, Grove EL. New oral anticoagulants: clinical indications, monitoring and treatment of acute bleeding complications. Acta Anaesthesiol Scand. 2014;58:651–659. [DOI] [PubMed] [Google Scholar]
- 4.Reilly PA, Lehr T, Haertter S, et al. The effect of dabigatran plasma concentrations and patient characteristics on the frequency of ischemic stroke and major bleeding in atrial fibrillation patients: the RE-LY Trial (Randomized Evaluation of Long-Term Anticoagulation Therapy). J Am Coll Cardiol. 2014;63:321–328. [DOI] [PubMed] [Google Scholar]
- 5.Gong IY, Kim RB. Importance of pharmacokinetic profile and variability as determinants of dose and response to dabigatran, rivaroxaban, and apixaban. Can J Cardiol. 2013;29:S24–S33. [DOI] [PubMed] [Google Scholar]
- 6.Aronson JK, Hardman M. ABC of monitoring drug therapy. Measuring plasma drug concentrations. BMJ. 1992;305:1078–1080. [DOI] [PMC free article] [PubMed] [Google Scholar]
- 7.Baglin T, Keeling D, Kitchen S. Effects on routine coagulation screens and assessment of anticoagulant intensity in patients taking oral dabigatran or rivaroxaban: guidance from the British Committee for Standards in Haematology. Br J Haematol. 2012;159:427–429. [DOI] [PubMed] [Google Scholar]
- 8.Schmohl M, Gansser D, Moschetti V, et al. Measurement of dabigatran plasma concentrations by calibrated thrombin clotting time in comparison to LC-MS/MS in human volunteers on dialysis. Thromb Res. 2015;135:532–536. [DOI] [PubMed] [Google Scholar]
- 9.Schmitz EM, Boonen K, van den Heuvel DJ, et al. Determination of dabigatran, rivaroxaban and apixaban by ultra-performance liquid chromatography–tandem mass spectrometry (UPLC-MS/MS) and coagulation assays for therapy monitoring of novel direct oral anticoagulants. J Thromb Haemost. 2014;12:1636–1646. [DOI] [PubMed] [Google Scholar]
- 10.Al-Aieshy F, Malmström RE, Antovic J, et al. Clinical evaluation of laboratory methods to monitor exposure of rivaroxaban at trough and peak in patients with atrial fibrillation. Eur J Clin Pharmacol. 2016;72:671–679. [DOI] [PubMed] [Google Scholar]
- 11.Gous T, Couchman L, Patel JP, et al. Measurement of the direct oral anticoagulants apixaban, dabigatran, edoxaban, and rivaroxaban in human plasma using turbulent flow liquid chromatography with high-resolution mass spectrometry. Ther Drug Monit. 2014;36:597–605. [DOI] [PubMed] [Google Scholar]
- 12.Baldelli S, Cattaneo D, Pignatelli P, et al. Validation of an LC-MS/MS method for the simultaneous quantification of dabigatran, rivaroxaban and apixaban in human plasma. Bioanalysis. 2016;8:275–283. [DOI] [PubMed] [Google Scholar]
- 13.Schellings MW, Boonen K, Schmitz EM, et al. Determination of dabigatran and rivaroxaban by ultra-performance liquid chromatography-tandem mass spectrometry and coagulation assays after major orthopaedic surgery. Thromb Res. 2016;139:128–134. [DOI] [PubMed] [Google Scholar]
- 14.Bylda C, Thiele R, Kobold U, et al. Recent advances in sample preparation techniques to overcome difficulties encountered during quantitative analysis of small molecules from biofluids using LC-MS/MS. Analyst. 2014;139:2265–2276. [DOI] [PubMed] [Google Scholar]
- 15.Jemal M, Ouyang Z, Xia YQ. Systematic LC-MS/MS bioanalytical method development that incorporates plasma phospholipids risk avoidance, usage of incurred sample and well thought-out chromatography. Biomed Chromatogr. 2010;24:2–19. [DOI] [PubMed] [Google Scholar]
- 16.Peters FT, Drummer OH, Musshoff F. Validation of new methods. Forensic Sci Int. 2007;165:216–224. [DOI] [PubMed] [Google Scholar]
- 17.Guidance for industry, Bioanalytical method validation, September 2013. Available at: http://www.fda.gov/downloads/Drugs/GuidanceComplianceRegulatoryInformation/Guidances/ucm368107.pdf. Access date March 15, 2018. [Google Scholar]
- 18.Matuszewski BK, Constanzer ML, Chavez-Eng CM. Strategies for the assessment of matrix effect in quantitative bioanalytical methods based on HPLC-MS/MS. Anal Chem. 2003;75:3019–3030. [DOI] [PubMed] [Google Scholar]
- 19.Xue YJ, Akinsanya JB, Raghavan N, et al. Optimization to eliminate the interference of migration isomers for measuring 1-O-beta-acyl glucuronide without extensive chromatographic separation. Rapid Commun Mass Spectrom. 2008;22:109–120. [DOI] [PubMed] [Google Scholar]
- 20.Lundgaard H, Dyrkorn R, Stokes CL, et al. Safer treatment with serum concentration monitoring of the new anticoagulants? Tidsskr Nor Laegeforen. 2016;136:1556–1560. [DOI] [PubMed] [Google Scholar]
- 21.Skeppholm M, Hjemdahl P, Antovic JP, et al. On the monitoring of dabigatran treatment in “real life” patients with atrial fibrillation. Thromb Res. 2014;134:783–789. [DOI] [PubMed] [Google Scholar]