

Abstract
Background
This proof-of-concept study investigated the feasibility of using biomarkers to monitor right heart pressures (RHP) in heart transplanted (HTx) patients.
Methods
In 298 patients, we measured 7.6 years post-HTx mean pressures in the right atrium (mRAP) and pulmonary artery (mPAP) and capillaries (mPCWP) along with plasma high-sensitivity troponin T (hsTnT), a marker of cardiomyocyte injury, and the multidimensional urinary classifiers HF1 and HF2, mainly consisting of dysregulated collagen fragments.
Results
In multivariable models, mRAP and mPAP increased with hsTnT (per 1-SD, +0.91 and +1.26 mm Hg; P < 0.0001) and with HF2 (+0.42 and +0.62 mm Hg; P ≤ 0.035), but not with HF1. mPCWP increased with hsTnT (+1.16 mm Hg; P < 0.0001), but not with HF1 or HF2. The adjusted odds ratios for having elevated RHP (mRAP, mPAP or mPCWP ≥10, ≥24, ≥17 mm Hg, respectively) were 1.99 for hsTnT and 1.56 for HF2 (P ≤ 0.005). In detecting elevated RHPs, areas under the curve were similar for hsTnT and HF2 (0.63 vs 0.65; P = 0.66). Adding hsTnT continuous or per threshold or HF2 continuous to a basic model including all covariables did not increase diagnostic accuracy (P ≥ 0.11), whereas adding HF2 per optimized threshold increased both the integrated discrimination (+1.92%; P = 0.023) and net reclassification (+30.3%; P = 0.010) improvement.
Conclusions
Correlating RHPs with noninvasive biomarkers in HTx patients is feasible. However, further refinement and validation of such biomarkers is required before their clinical application can be considered.
Heart transplantation (HTx) is the treatment of choice for a highly selected group of terminally ill heart failure patients with severe symptoms not responding to optimal medical therapy with the goal to prolong survival and improve quality of life.1 Right heart catheterization, sometimes performed simultaneously with obtaining surveillance endomyocardial biopsies (EMB), is a standard way to monitor cardiac hemodynamics of patients after HTx.
A position paper of the American Heart Association supports research into proteomics as applied to cardiovascular health and disease with the goal to discover new and effective strategies for the prevention, diagnosis and treatment of cardiovascular disease.2 This proof-of-concept study3 builds on previously identified multidimensional urinary proteomic classifiers.4-6 HF1 consists of 85 peptide fragments and was originally developed in a case-control study nested within the Flemish Study on Environment, Genes and Health Outcomes5 with the goal to identify potentially discriminating urinary biomarkers for asymptomatic diastolic left ventricular (LV) dysfunction. The HF2 classifier was designed by including also patients with advanced heart failure and consists of 671 peptide fragments.4,6 The current hypothesis-driven study is a first attempt to assess the feasibility of correlating HTx graft performance with urinary proteomic biomarkers, because invasive right heart catheterization causes discomfort and sometime life-threatening complications. To address this objective, we correlated right heart pressures (RHPs) with the previously established HF14,5 and HF24,6 urinary biomarkers in 298 post-HTx patients. We also studied plasma high-sensitivity cardiac troponin T (hsTnT) as a circulating biomarker of cardiomyocyte injury in HTx patients.7 In the general population, hsTnT is associated with LV and left atrial remodeling and dysfunction8 and even outside the context of myocardial ischemia predicts the incidence of heart failure and all-cause mortality.9,10
MATERIALS AND METHODS
Study Participants
Urinary Proteomics in Predicting Heart Transplantation Outcomes (uPROPHET; registration number at www.clinicaltrials.gov, NCT03152422) complies with the Helsinki declaration for research in humans.11 The Ethics Committee of the University Hospitals Leuven (approval numbers B322201421186 [S56384] and B322201421045 [S56472]) and the officers of the European Research Council Executive Agency approved uPROPHET. Heart transplant recipients provided written informed consents. Recruitment of patients took place at the University Hospital Gasthuisberg in Leuven (2014-2015) in collaboration with the HTx team. All surviving HTx recipients in regular follow-up at the University Hospitals Leuven were invited to provide a 5-mL midmorning urine sample. Of 352 study participants, 298 had undergone invasive right heart catheterization within 6 months of the urine sampling and were included in the present analysis.
Collection of Clinical Data
A detailed description of the construction and contents of uPROPHET database is available elsewhere.3 The policy implemented at the University Hospital Leuven is that EMBs are generally performed weekly for the first month, then every 2 weeks during the second month, at variable intervals during the third and fourth month, and monthly through months 8 to 12. After 1 year, biopsies are done every 4 to 6 months. After a treated episode of rejection, EMB is generally repeated within 14 days to ensure that immunosuppression is adequate. Right heart hemodynamic measurements included mean pressures in the right atrium (mRAP), mean pulmonary arterial pressure (mPAP), mean pulmonary capillary wedge pressure (mPCWP) and right ventricular systolic (sRVP) and diastolic (dRVP) pressures. The RHPs were recorded averaged over the respiratory cycle. In categorical analyses, we applied the 75th percentiles of mRAP (≥10 mm Hg), mPAP (≥24 mm Hg) and mPCWP (≥17 mm Hg) to define elevated RHP. All potentially relevant clinical information, including EMB histopathology, tests for antibody-mediated rejection performed if clinically indicated, and use of immunosuppressive drugs was retrieved from the computerized information system of the University Hospitals Leuven. Ejection fraction was determined by echocardiography. Hypertension was an office blood pressure of at least 140 mm Hg systolic or 90 mm Hg diastolic or use of antihypertensive drugs. Body mass index was weight in kilograms divided by height in meters squared.
Urinary Proteomics
Methods for urine sample preparation, proteome analysis by capillary electrophoresis coupled to mass spectrometry, data processing, and sequencing have been published before.12,13 Peptides were combined into a single summary variables, using the MosaCluster software, version 1.7.0.14 HF1 was originally derived in a case-control study including participants with mild and moderate LV diastolic dysfunction. It consists of 85 peptides mainly collagen fragments.4,5 HF1 is a robust urinary biomarker validated before in case-control studies5 and in the general population.4 To generate the HF2 classifier, all urinary proteomic data sets from cases available in the Mosaiques database15 were combined and compared with data from sex- and age-matched controls. Cases were 98 patients with LV diastolic dysfunction recruited from the population (n = 35)5 or admitted to the hospital because of overt heart failure (n = 63).4,6 The underlying cause of heart failure was ischemic (50.8%), dilated (28.6%), or hypertrophic (1.6%) cardiomyopathy, valvular heart disease (1.6%) or unspecified (17.4%). Comparing cases with controls identified 710 potential biomarkers, based on a P value less than 0.05 with adjustment for multiple testing applied. Using a take-one-out procedure16 to remove potential biomarkers that are of no apparent value, the number of peptides was reduced to 671. Both HF1 and HF2 are normally distributed, higher values being associated with worse outcomes.4-6
High-Sensitivity Cardiac Troponin T
Blood sampling for hsTnT took place on the same date as urine sampling. High-sensitivity cardiac troponin T concentrations were measured in plasma, using the hsTnT one-step electrochemiluminescence immunoassay on an Elecsys 2010 analyzer (Roche Diagnostics, Meylan, France). The measuring range extended from 0.003 to 10 μg/L. The diagnostic threshold for myocardial damage is 0.014 μg/L or greater (99th percentile).17
Statistical Analysis
For database management and statistical analysis, we used the SAS system, version 9.4 (SAS Institute Inc., Cary, NC). Means were compared using the large-sample z test or analysis of variance and proportions by Fisher exact test. Based on the Wilk-Shapiro test, we logarithmically transformed the distribution of hsTnT to approximate normality. Our statistical methods also include multivariable-adjusted linear and logistic regression with the right heart hemodynamic indexes as dependent variables on a continuous or binary scale. We adjusted the analyses for covariables of physiological relevance, including age, years after HTx, body mass index, mean arterial pressure (diastolic plus one third of the difference between systolic and diastolic blood pressure on office measurement), heart rate (during right heart catheterization), and serum creatinine. In addition to these covariables, fully adjusted models also accounted for use of immunosuppressive agents by drug class, including methylprednisolone and intake of antihypertensive drugs. We constructed the RHP score (RHPS [0, 1], which equaled 1, if any mean RHP (mRAP, mPAP, or mPCWP) was equal to or higher than the 75th percentile of its distribution and 0 otherwise. In categorical analyses, we used the published threshold of 0.014 μg/L or greater for hsTnT.17 For HF1 and HF2, we determined optimal discrimination limits to categorize patients according to their RHPS by maximizing Youden Index (the maximum of sensitivity plus specificity minus 1). We evaluated the capability to discriminate between patients with or without elevated RHPs by constructing receiver operating characteristic (ROC) curves and by calculating the area under the ROC curve (AUC). The 95% confidence interval (CI) of the AUC was calculated by the DeLong method. Finally, we assessed the incremental value of the urinary biomarkers in discriminating between normal and abnormal right heart hemodynamics, while adjusting for covariables, using the integrated discrimination improvement (IDI) and the net reclassification improvement (NRI).18
RESULTS
Patients Characteristics
Among the 298 study participants, the underlying cause of treatment-resistant end-stage heart failure, which constituted the indication for HTx, was ischemic cardiomyopathy in 121 (40.6%) patients and dilated cardiomyopathy (DCM) in 116 (38.9%). Among the remaining 61 patients, the etiology of heart failure included hypertrophic cardiomyopathy (n = 19), restrictive (n = 5), valvular (n = 10) or congenital (n = 18) heart disease, arrhythmogenic right ventricular dysplasia (n = 3), constrictive pericarditis (n = 1), cardiac sarcoidosis (n = 1), myocarditis (n = 3), and irreversible myocardial damage caused by a massive hemorrhage (n = 1). The 298 patients underwent surgery from August 1988 until April 2015 and included 68 (22.8%) women. Mean (±SD) age of the donors was 36.2 ± 12.9 years.
Tables 1, 2, and 3 lists the characteristics of the patients by quartiles of the distributions of mRAP, mPAP, and mPCWP, respectively. Patients with RHP above the 75th percentile, had a higher frequency of diabetes mellitus or history of ischemic cardiomyopathy, were older, had higher body mass index and were more likely to be past smokers. The number of patients that underwent EMB within 6 months of urine sampling totaled 73. Of the biopsy specimens, 51 (69.9%) had no rejection (grade 0), 19 (26.0%), and 3 (4.1%) had grade 1A or 1B rejection. There were no grade 2 or higher rejections. Evidence of positive C4d staining occurred in 18 (6%) patients.
TABLE 1.
Characteristics of patients categorized by quartiles of mean right atrial pressure

TABLE 2.
Characteristics of patients categorized by quartiles of mean pulmonary arterial pressure

TABLE 3.
Characteristics of patients categorized by quartiles of mean pulmonary capillary wedge pressure

Figure 1 shows the distributions of hsTnT, HF1 and HF2 dichotomized by RHPS. The median values of mRAP, mPAP, and mPCWP among all 298 patients were 9 mm Hg (interquartile range [IQR], 7-10 mm Hg), 21 mm Hg (IQR, 18-24 mm Hg) and 14 mm Hg (IQR, 11-17 mm Hg) respectively. Patients with higher versus lower RHPs had higher values of hsTnT (0.017 vs 0.011 μg/L; P < 0.0001), HF1 (−0.41 vs –0.82; P = 0.0005), and HF2 (0.18 vs –0.19; P < 0.0001). Figure 2 shows mRAP, mPAP, and mPCWP as a function of time since transplantation. Mean pressures in the right atrium (P = 0.004) increased with higher time interval since HTx, whereas mPAP (P = 0.16) and mPCWP (P = 0.45) did not.
FIGURE 1.

Frequency distributions of hsTnT, HF1 and HF2 by RHPS (0, 1). This score is 1 if any mean RHP is equal to or higher than the 75th percentile (mean right atrial pressure, ≥10 mm Hg; mean pulmonary arterial pressure, ≥24 mm Hg; or pulmonary capillary wedge pressure, ≥17 mm Hg) and 0 otherwise. Mean values (given at the top of the distribution plots) were in patients with elevated RHPS or not (P ≤ 0.0005).
FIGURE 2.

mRAP, mPAP, and mPCWP plotted as a function of the time interval since HTx. Plotted values are averages for each time point. n indicates the number of patients contributing to the estimates. Vertical bar denote the SD. P values are for linear trend.
Use of Medications
Of 298 patients, 65 (21.8%) were taking cyclosporine, 225 (75.5%) tacrolimus, 232 (77.9%) mycophenolate mofetil, 17 (5.7%) everolimus, 20 (6.7%) azathioprine, and 105 (35.2%) methylprednisolone. Fifteen (5.0%) were taking a single drug, 200 (67.1%) 2 drugs, and 83 (27.9%) 3 drugs. The most common combination was tacrolimus plus mycophenolate mofetil (177 patients; 59.4%). The number of patients taking 1 or more antihypertensive drugs was 231 (77.5%), of whom 57 (24.7%) were on thiazide or loop diuretics, 113 (48.9%) on β-blockers, 140 (60.6%) on angiotensin-converting enzyme inhibitors or angiotensin I receptor blockers, 90 (39.0%) on calcium-channel blockers, and 19 (8.2%) on aldosterone antagonists. The number of patients on antidiabetic treatment totaled 81, of whom 50 (61.7%) were on oral therapy and 31 (38.3%) on insulin. The time interval between right heart catheterization and urine sampling was 91 days (IQR, 84-105 days). Over this time, interval changes in medication use were minimal.
Per 1 unit increment in the number of immunosuppressive drugs, hsTnT increased by 21.4% (95% CI, 14.0-28.9; P < 0.0001), HF1 by 0.243 (95% CI, 0.022-0.464; P = 0.033), and HF2 by 0.159 (95% CI, 0.010-0.308; P = 0.038). Per 1 unit increase in the number of antihypertensive drugs taken, these estimates were 4.0% (95% CI, 0.4-7.5; P = 0.032) for hsTnT, 0.339 (95% CI, 0.243-0.435; P < 0.0001) for HF1, and 0.272 (95% CI, 0.209-0.335; P < 0.0001) for HF2.
Associations of RHPs with Biomarkers
The correlation coefficients between hsTnT and HF1, hsTnT and HF2, and HF1 and HF2 were 0.38, 0.36, and 0.63, respectively (P < 0.0001).
Continuous Outcomes
In unadjusted analyses, all RHPs increased with hsTnT, HF1, and HF2 (Table 4). In adjusted models, mRAP, mPAP, sRVP, and dRVP, all increased with hsTnT and HF2. Expressed per 1-SD increment in the biomarker, the increases in RHPs ranged from 0.67 mm Hg (P = 0.0001) to 1.67 mm Hg (P < 0.0001) for hsTnT and from 0.34 mm Hg (P = 0.051) to 0.92 mm Hg (P = 0.018) for HF2 (Table 4). With additional adjustments for use of immunosuppressive (by class) and antihypertensive drugs, these estimates ranged from 0.91 mm Hg (P < 0.0001) to 1.64 mm Hg (P = 0.0001) for hsTnT and from 0.42 mm Hg (P = 0.020) to 0.89 mm Hg (P = 0.027) for HF2 (Table 4 and Figure 3). In adjusted and fully adjusted models mPCWP increased with hsTnT (≥0.93 mm Hg; P ≤ 0.0005), whereas the increase in mPCWP associated with HF2 did not reach significance (≥0.24 mm Hg; P ≥ 0.27). With partial and full adjustments applied, none of the RHPs remained significantly associated with HF1 (P ≥ 0.12). Excluding 24 patients on loop diuretics or 57 patients on any diuretic produced results not different from those reported in Table 4. In fully adjusted models, the interaction terms of diuretic use versus nonuse in association with the urinary biomarkers were nonsignificant (P ≥ 0.089).
TABLE 4.
Association of RHPs with biomarkers

FIGURE 3.

Mean normalized values of hsTnT, HF1, and HF2 by fourths of the distributions of mRAP, mPAP, and mPCWP. P values are for linear trend. Associations were adjusted for years since transplantation, age, body mass index, mean arterial pressure on office measurement, heart rate during the right heart catheterization, serum creatinine, and use of immunosuppressive (by class), and antihypertensive drugs.
Analyses limited to 119 patients, who had their urine sample collected within 3 months of the right heart catheterization provided estimates of the fully adjusted association sizes comparable with those reported in Table 4. The estimates per 1-SD increment in the biomarkers were 0.88 mm Hg (95% CI, 0.28-1.49 mm Hg; P = 0.004), 1.00 mm Hg (95% CI, 0.09-1.91 mm Hg; P = 0.032) and 0.87 mm Hg (95% CI, 0.03-1.71 mm Hg; P = 0.043) for mRAP, mPAP, and mPCWP in relation to hsTnT; 0.49 mm Hg (95% CI, -0.05 to 1.04 mm Hg; P = 0.077), 0.67 mm Hg (CI, -0.15 to 1.49 mm Hg; P = 0.11) and 0.13 mm Hg (95% CI, -0.63 to 0.89 mm Hg; P = 0.73) for mRAP, mPAP, and mPCWP in relation to HF1; and 0.75 mm Hg (95% CI, 0.20-1.29 mm Hg; P = 0.008), 1.06 mm Hg (CI, 0.24-1.87 mm Hg; P = 0.012), and 0.70 mm Hg (95% CI, -0.06 to 1.46 mm Hg; P = 0.072) for mRAP, mPAP, and mPCWP in relation to HF2. The interaction terms of the urinary biomarkers with time interval relative to right heart catheterization (≤3 vs >3 months) were all nonsignificant (P ≥ 0.073).
Categorical Outcomes
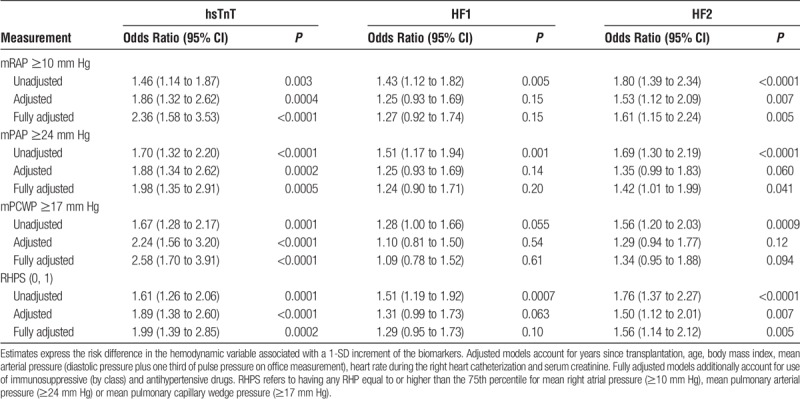
In categorical analyses, we set the threshold for elevated RHPs at the 75th percentile (Table 5). The odds of having an elevated mRAP, mPAP, or mPCWP increased with hsTnT. In adjusted models, the odds ratios associated with a 1-SD increment in hsTnT were 1.86 for mRAP, 1.88 for mPAP, and 2.24 for mPCWP (P ≤ 0.0004) and in fully adjusted models 2.36, 1.98, and 2.58 (P ≤ 0.0005), respectively. The odds ratios for a 1-SD increment in HF2 were 1.53 (P = 0.007) for mRAP, 1.35 (P = 0.060) for mPAP, and 1.29 (P = 0.12) for mPCWP in adjusted models and in fully adjusted models 1.61 (P = 0.005), 1.42 (P = 0.041), and 1.34 (P = 0.094), respectively. The odds of exceeding any threshold in adjusted and fully adjusted models were 1.89 and 1.99 for hsTnT (P ≤ 0.0002) and 1.50 and 1.56 (P ≤ 0.007) for HF2. With partial and full adjustments applied, none of the odds ratios remained significant for HF1 (P ≥ 0.063). In a sensitivity analysis, we set the threshold for mPCWP to the guideline-endorsed value of 15 mm Hg (71st percentile in our data) instead of 17 mm Hg (75th percentile). In fully adjusted models, the odds of having an elevated mPCWP then were 1.43 (95% CI, 1.03-1.98; P = 0.033), 0.99 (95% CI, 0.74-1.32; P = 0.92), and 1.14 (95% CI, 0.85-1.52; P = 0.39) in relation to hsTnT, HF1, and HF2. Based on the results given in Tables 4 and 5, hsTnT and HF2 were carried through in further analyses.
TABLE 5.
Odds of having increased RHP
Diagnostic Accuracy
Unadjusted Analyses
To differentiate normal from elevated RHP, we used 0.014 μg/L or greater17 as diagnostic threshold for hsTnT, a value approximately equal to the median of its distribution in our data. The threshold for HF2 obtained by optimizing the Youden index was 0.15 or higher. In all patients, these thresholds yielded a sensitivity of 56.8% for hsTnT and 52.5% for HF2 with a specificity of 59.8% and 71.1%, respectively (Table 6). These estimates were similar in patients with ischemic and DCM (Table 6). Replacing the hsTnT threshold of 0.014 μg/L or greater by the optimized threshold of 0.009 μg/L or greater did not materially change the findings reported in Table 6.
TABLE 6.
Classification parameters for higher RHPs by categories of hsTnT, HF1, and HF2

In all patients, the AUCs were similar for hsTnT and HF2 (0.63 [95% CI, 0.57-0.69] vs 0.65 [95% CI, 0.58-0.71], P = 0.66; Figure 4). Among patients with ischemic cardiomyopathy, the AUC was slightly but not significantly smaller for hsTnT compared with HF2 (0.56 [95% CI, 0.46-0.67] vs 0.67 [95% CI, 0.58-0.77], P = 0.079; Figure 4). In patients with DCM, estimates were similar for hsTnT and HF2 (0.62 [CI, 0.52 to 0.73] vs 0.63 [CI, 0.52 to 0.73], P = 0.95; Figure 4).
FIGURE 4.

ROC curves for differentiating between RHPS 1 versus 0 for hsTnT and HF2 in all patients (n = 298) and patients with a history of ischemic (n = 121 [ICM]) or dilated (n = 116 [DCM]) cardiomyopathy. The AUCs did not differ among the biomarkers (P ≥ 0.66) with the exception of a slight increase in the AUC for HF2 compared with hsTnT in patients with ischemic cardiomyopathy (0.56 vs 0.67; P = 0.079).
Adjusted Analyses
Adding hsTnT continuous or per threshold or HF2 continuous to a basic model including all covariables (Table 7) did not increase IDI (P ≥ 0.11) or NRI (P ≥ 0.16). Adding HF2 per threshold increased both IDI (+1.92%; P = 0.023) and NRI (+30.3%; P = 0.010).
TABLE 7.
IDI and net reclassification improvement by adding hsTnT, HF2 or both to the basic model

DISCUSSION
This proof-of-concept study demonstrated that correlating RHPs with biomarkers in HTx recipients is feasible. Mean pressures in the right atrium and mPAP increased with plasma hsTnT, a marker of cardiomyocyte injury, and with HF2, a multidimensional urinary proteomic classifier mainly consisting of dysregulated collagen fragments. In unadjusted analyses, the AUC was similar for hsTnT and HF2. However, adding hsTnT to a basic model including all covariables did not increase diagnostic accuracy, whereas HF2 did. By design, HF1 is associated with early asymptomatic LV dysfunction,4,5 whereas HF2 reflects more advanced LV dysfunction.4 This probably explains the null findings for HF1 in the current study. Although our study suggests that assessing RHPs by noninvasive biomarkers is feasible, it also highlights that further refinement and validation of such biomarkers is required before their clinical application in HTx patients is possible. Improving the diagnostic accuracy of hsTnT is difficult, because it is a single protein released from injured cardiomyocytes. On the other hand, discovery of novel urinary classifiers specific for monitoring the hemodynamic status of HTx patients can be done by support vector machine modelling and methods described before for diastolic LV dysfunction4,5,19 or chronic kidney disease.6,20
Right heart catheterization, the standard in hemodynamic monitoring after HTx, provides mRAP, mPAP, and mPCWP, which are indicators not only of left- and right-sided allograft function and pulmonary vascular pressure and resistance, but also of the systemic hemodynamic state.21,22 Mean pressures in the right atrium and mPCWP mainly reflect right and left heart function, while elevated LV filling pressure can be estimated by mPCWP.23 Right heart pressures change significantly in the first months after HTx as the allograft and the vasculature of the host adjust to the posttransplant condition.24 Right heart catheterization after this adaptive phase usually reveals smaller pressure changes unless rejection occurs. In our current study, in all the 298 HTx patients, right heart catheterization was performed within 6 months of urine sampling during this stable phase. However, a Swiss study confirmed the predictive value of RHPs measured within 1 year (median) after HTx.22
In our current study, mRAP, mPAP, and mPCWP increased with higher plasma troponin levels, which is consistent with observations in patients with stable LV dysfunction or precapillary pulmonary hypertension,25 coronary heart disease,26 heart failure,27,28 or acute rejection in HTx patients.29 Along similar lines, we previously demonstrated that plasma hsTnT is associated with left atrial and LV remodeling and diastolic LV dysfunction.8 To our knowledge, our current study is the first to associate RHPs with plasma levels of hsTnT in post HTx patients. However, the most salient finding of our current analysis is the association of mRAP and mPAP with the urinary classifier HF2. This association is physiologically plausible, because fibrosis is a hallmark of graft malfunction. Under physiological conditions, the urinary proteome originates for about 70% from the kidney and the urinary tract, while 30% is derived from plasma.30 Approximately 60% of the total mass of urinary peptides and proteins consist of collagen fragments.15 Of the urinary peptides with known amino-acid sequence that are included in HF2, 68.9% are collagen fragments.6 The cardiac extracellular matrix predominantly consist of fibrillar collagen type I (85%) and type III (11%). Although our current study cannot prove the cardiac origin of the urinary HF2 collagen fragments, we demonstrated that in the context of diastolic LV dysfunction circulating and urinary biomarkers of fibrosis are correlated.19 Furthermore, preliminary findings from tissue proteomic studies conducted within uPROPHET3 demonstrated upregulation of proteins involved in collagen deposition and organization of the extracellular matrix in explanted diseased hearts from patients with ischemic or DCM compared with healthy hearts offered for implantation, but discarded because of the donors' age.31
Previous studies addressed the use of biomarkers, but mainly in the context of acute graft rejection.32-38 The biomarkers investigated included gene-expression profiling on peripheral blood32-35 or circulating microRNAs36,37 or exosomal proteins.38 A clinical trial in the United States involved 602 selected patients who had received a cardiac transplant from 6 months to 5 years previously and who were at a low risk of rejection.33 Patients who were monitored with gene-expression profiling and those who underwent routine biopsies had similar 2-year cumulative rates of the composite primary outcome (14.5% and 15.3%) and all-cause mortality (6.3% and 5.5%). Patients who were monitored with the use of gene-expression profiling underwent fewer biopsies per person-year of follow-up than did patients who were monitored with the use of EMB (0.5% vs 3.0%).33 This clinical trial substantiated earlier observational studies32 and was followed up by studies showing similar diagnostic performance of gene-profiling compared with EMB.34,35 Other studies demonstrated the potential use of microRNAs36,37 and exosomal proteins38 as candidate biomarkers of acute rejection in the HTx field.
To our knowledge, our current study is the first to apply urinary proteomics for the hemodynamic assessment of HTx patients. Its strong points are the large sample size and the stringent quality control of the clinical, biochemical, and proteomic variables. However, our study must also be interpreted within the context of potential limitations. Foremost, the urinary biomarkers and hsTnT urine samples were not collected within a short time interval, but only within 6 months of the right heart catheterization. The RHPs were associated with both hsTnT and HF2, but we might have underestimated the strength of these associations. However, a sensitivity analysis showed comparable estimates for the biomarkers collected within intervals of 3 months and from 3 to 6 months of the right heart catheterization. This timeframe also precludes firm recommendation about the time interval at which the biomarkers should be remeasured. Such recommendation also require a research track as described above for gene profiling.32-35 Second, the median interval between HTx and data collection was 7.6 years (IQR, 3.2-14.3 years). We only started urine sampling from January 2014 onward, explaining why only 39 patients had a urine sample collected within the first year after HTx, when acute rejection is more likely to occur. Third, our analysis was cross-sectional. uPROPHET data collection is currently going on to cover the first months up to 2 years after HTx with substantially greater granularity and to enable a longitudinal analysis using the urinary proteomic signature as a predictor rather than as a correlate of clinical outcomes in HTx patients. Fourth, our study is a single-center study. That our observations are generalizable to other HTx centers remains to be confirmed. Finally, we did not have any measurement of N-terminal pro b-type natriuretic peptide, because this marker was not routinely measured, but only if severe deterioration of LV function occurred.
In conclusion, this proof-of-concept study suggests that urinary proteomics are potentially useful in assessing the central hemodynamics post HTx. However, further refinement and validation of the urinary biomarkers is required before their clinical application in this indication can be considered. This process will involve a long path from discovery over proving their plausibility at the molecular level to testing their performance in randomized clinical trials compared with the current state-of-the-art hemodynamic monitoring.
ACKNOWLEDGMENTS
The authors acknowledge the clerical contribution of Linda Custers, Vera De Leebeeck, Marie-Jeanne Jehoul, Hanne Truyens, and Renilde Wolfs.
Footnotes
Published online 23 April, 2018.
The European Union (HEALTH-F7-305507 HOMAGE), the European Research Council (Advanced Researcher Grant 2011-294713-EPLORE and Proof-of-Concept Grant 713601-uPROPHET), the European Research Area Net for Cardiovascular Diseases (JTC2017-046-PROACT), and the Fonds voor Wetenschappelijk Onderzoek Vlaanderen, Ministry of the Flemish Community, Brussels, Belgium (G.0881.13) currently support the Studies Coordinating Centre in Leuven. The funding source had no role in study design, data extraction, data analysis, data interpretation, or writing of the report. The corresponding author had full access to all of the data in the study and had the responsibility for the decision to submit for publication.
H.M. is the cofounder and a shareholder of Mosaiques Diagnostics AG (Hannover, Germany). E.N.-K. is an employee of Mosaiques Diagnostics AG. The other authors declare no conflicts of interest.
J.A.S. designed and coordinated the study and acquired funding. Q.F.H., S.T., Z.Z.Y., and J.V.K. contributed to the data extraction from the clinical files and the construction and curation of the database. Q.F.H., L.T., and J.A.S. did the statistical analysis. E.N.K. and H.M. measured the urinary proteome. Q.F.H., Z.Z.Y., W.Y.Y., L.T., F.F.W., and B.M. wrote the SAS statements required for database construction and statistical analysis. L.N.L.V.A., A.C., W.D., J.V., S.J., and J.V.C. supervised patient care. All authors were involved in drafting the article or revising it critically for important intellectual content and approved the final version. J.A.S. is the guarantor of this work and, as such, had full access to all the data and takes responsibility for the integrity of the data and the accuracy of the data analysis.
REFERENCES
- 1.Haddad H, Isaac D, Legare JF, et al. Canadian Cardiovascular Society Consensus Conference update on cardiac transplantation 2008: executive summary. . 2009;25:197–205. [DOI] [PMC free article] [PubMed] [Google Scholar]
- 2.Lindsey ML, Mayr M, Gomes AV, et al. Transformative impact of proteomics on cardiovascular health and disease: a scientific statement from the American Heart Association. . 2015;132:852–872. [DOI] [PubMed] [Google Scholar]
- 3.Huang QF, Trenson S, Zhang ZY, et al. Urinary Proteomics in Predicting Heart Transplantation Outcomes (uPROPHET)—rationale and database description. . 2017;12:e0184443. [DOI] [PMC free article] [PubMed] [Google Scholar]
- 4.Zhang ZY, Staessen JA, Thijs L, et al. Left ventricular diastolic function in relation to the urinary proteome: a proof-of-concept study in a general population. . 2014;176:158–165. [DOI] [PMC free article] [PubMed] [Google Scholar]
- 5.Kuznetsova T, Mischak H, Mullen W, et al. Urinary proteome analysis in hypertensive patients with left ventricular diastolic dysfunction. . 2012;33:2342–2350. [DOI] [PMC free article] [PubMed] [Google Scholar]
- 6.Gu YM, Thijs L, Liu YP, et al. The urinary proteome as correlate and predictor of renal function in a population study. . 2014;29:2260–2268. [DOI] [PubMed] [Google Scholar]
- 7.Mullen JC, Bentley MJ, Scherr KD, et al. Troponin T and I are not reliable markers of cardiac transplant rejection. . 2002;22:233–237. [DOI] [PubMed] [Google Scholar]
- 8.Ravassa S, Kuznetsova T, Varo N, et al. Biomarkers of cardiomyocyte injury and stress identify left atrial and left ventricular remodelling and dysfunction: a population-based study. . 2015;185:177–185. [DOI] [PubMed] [Google Scholar]
- 9.Eggers KM, Lind L, Ahlström H, et al. Prevalence and pathophysiological mechanisms of elevated cardiac troponin I levels in a population-based sample of elderly subjects. . 2008;29:2252–2258. [DOI] [PubMed] [Google Scholar]
- 10.de Lemos JA, Drazner MH, Omland T, et al. Association of troponin T detected with a highly sensitive assay and cardiac structure and mortality risk in the general population. . 2010;304:2503–2512. [DOI] [PMC free article] [PubMed] [Google Scholar]
- 11.World Medical Association. World Medical Association Declaration of Helsinki. Ethical principles for medical research involving human subjects. . 2013;310:2191–2194. [DOI] [PubMed] [Google Scholar]
- 12.Jantos-Siwy J, Schiffer E, Brand K, et al. Quantitative urinary proteome analysis for biomarker evaluation in chronic kidney disease. . 2009;8:268–281. [DOI] [PubMed] [Google Scholar]
- 13.Mischak H, Kolch W, Aivalotis M, et al. Comprehensive human urine standards for comparability and standardization in clinical proteome analysis. . 2010;4:464–478. [DOI] [PMC free article] [PubMed] [Google Scholar]
- 14.Delles C, Schiffer E, von Zur Muhlen C, et al. Urinary proteomic diagnosis of coronary artery disease: identification and clinical validation in 623 individuals. . 2010;28:2316–2322. [DOI] [PubMed] [Google Scholar]
- 15.Coon JJ, Zürbig P, Dakna M, et al. CE-MS analysis of the human urinary proteome for biomarker discovery and disease diagnostics. . 2008;2:964–973. [DOI] [PMC free article] [PubMed] [Google Scholar]
- 16.Rossing K, Mischak H, Dakna M, et al. Urinary proteomics in diabetes and CKD. . 2008;19:1283–1290. [DOI] [PMC free article] [PubMed] [Google Scholar]
- 17.Giannitsis E, Kurz K, Hallermayer K, et al. Analytical validation of a high-sensitivity cardiac troponin T assay. . 2010;56:254–261. [DOI] [PubMed] [Google Scholar]
- 18.Pencina MJ, D'Agostino RB, Sr, D'Agostino RB, Jr, et al. Evaluating the added predictive ability of a new marker: from area under the ROC curve to reclassification and beyond. . 2008;27:157–172. [DOI] [PubMed] [Google Scholar]
- 19.Zhang ZY, Ravassa S, Yang WY, et al. Diastolic left ventricular function in relation to urinary and serum collagen biomarkers in a general population. . 2016;11:e0167582. [DOI] [PMC free article] [PubMed] [Google Scholar]
- 20.Nkuipou-Kenfack E, Zürbig P, Mischak H. The long path towards implementation of clinical proteomics: exemplified based on CKD273. . 2017;11: 1600104. [DOI] [PubMed] [Google Scholar]
- 21.Drazner MH, Velez-Martinez M, Ayers CR, et al. Relationship of right- to left-sided ventricular filling pressures in advanced heart failure: insights from the ESCAPE trial. . 2013;6:264–270. [DOI] [PubMed] [Google Scholar]
- 22.Molkentin JP, Nägele MP, Frank M, et al. Prognostic value of mean pulmonary artery pressure in the stable phase after heart transplantation. . 2017;52:775–780. [DOI] [PubMed] [Google Scholar]
- 23.Oliveira RK, Ferreira EV, Ramos RP, et al. Usefulness of pulmonary capillary wedge pressure as a correlate of left ventricular filling pressures in pulmonary arterial hypertension. . 2014;33:157–162. [DOI] [PubMed] [Google Scholar]
- 24.Bedanova H, Orban M, Vrsansky D, et al. Impact of pulmonary hypertension on early hemodynamics, morbidity and mortality after orthotopic heart transplantation. A single center study. . 2013;157:35–40. [DOI] [PubMed] [Google Scholar]
- 25.Eggers KM, Nygren M, Venge P, et al. High-sensitive troponin T and I are related to invasive hemodynamic data and mortality in patients with left-ventricular dysfunction and precapillary pulmonary hypertension. . 2011;412:1582–1588. [DOI] [PubMed] [Google Scholar]
- 26.Omland T, de Lemos JA, Sabatine MS, et al. A sensitive cardiac troponin T assay in stable coronary artery disease. . 2009;361:2538–2547. [DOI] [PMC free article] [PubMed] [Google Scholar]
- 27.Latini R, Masson S, Anand IS, et al. Prognostic value of very low plasma concentrations of troponin T in patients with stable chronic heart failure. . 2007;116:1242–1249. [DOI] [PubMed] [Google Scholar]
- 28.Miller WL, Hartman KA, Burritt MF, et al. Serial biomarker measurements in ambulatory patients with chronic heart failure: the importance of change over time. . 2007;116:249–257. [DOI] [PubMed] [Google Scholar]
- 29.Patel PC, Hill DA, Ayers CR, et al. High-sensitivity cardiac troponin I assay to screen for acute rejection in patients with heart transplant. . 2014;7:463–469. [DOI] [PubMed] [Google Scholar]
- 30.Pieper R, Gatlin CL, McGrath AM, et al. Characterization of the human urinary proteome: a method for high-resolution display of urinary proteins on two-dimensional electrophoresis gels with a yield of nearly 1400 distinct protein spots. . 2004;4:1159–1174. [DOI] [PubMed] [Google Scholar]
- 31.Zhang ZY, Trenson S, Yang WY, et al. Myocardial proteomic signatures in end-stage dilated and ischemic cardiomyopathy compared with normal human hearts. OMICS as Tool to Address the Burden of Non-Communicable Age-Related Disease in Populations in Epidemiological Transition. . 2017:315–375. [Google Scholar]
- 32.Starling RC, Pham M, Valantine H, et al. Molecular testing in the management of cardiac transplant recipients: initial clinical experience. . 2006;25:1389–1395. [DOI] [PubMed] [Google Scholar]
- 33.Pham MX, Teuteberg JJ, Kfoury AG, et al. Gene-expression profiling for rejection surveillance after cardiac transplantation. . 2010;362:1890–1900. [DOI] [PubMed] [Google Scholar]
- 34.Kobashigawa J, Patel J, Azarbal B, et al. Randomized pilot trial of gene expression profiling versus heart biopsy in the first year after heart transplant: Early Invasive Monitoring Attenuation through Gene Expression Trial. . 2015;8:557–564. [DOI] [PubMed] [Google Scholar]
- 35.Crespo-Leiro M, Stypmann J, Schulze U, et al. Clinical usefulness of gene-expression profile to rule out acute rejection after heart transplantation: CARGO II. . 2016;37:2591–2601. [DOI] [PMC free article] [PubMed] [Google Scholar]
- 36.Duong Van Huyen JP, Tible M, Gay A, et al. MicroRNAs as non-invasive biomarkers of heart transplant rejection. . 2014;35:3194–3202. [DOI] [PubMed] [Google Scholar]
- 37.Sukma Dewi I, Torngren K, Gidlöf O, et al. Altered serum miRNA profiles during acute rejection after heart transplantation: potential for non-invasive allograft surveillance. . 2013;32:463–466. [DOI] [PubMed] [Google Scholar]
- 38.Kennel PJ, Saha A, Maldonado DA, et al. Serum exosomal protein profiling for the non-invasive detection of cardiac allograft rejection. . 2018;37:409–417. [DOI] [PubMed] [Google Scholar]