Abstract
The aim of this study was to evaluate the correlation of long non-coding RNAs (lncRNAs) taurine-upregulated gene 1 (TUG1) with clinicopathological characteristics as well as overall survival (OS) in epithelial ovarian cancer (EOC) patients, and investigate its function in EOC cells proliferation and apoptosis in vitro.
LncRNA TUG1 expressions were detected in tumor tissues and paired adjacent tissues obtained from 96 EOC patients. Blank mimic, lncRNA TUG1 mimic, blank inhibitor, and lncRNA TUG1 inhibitor plasmids were transfected into SKOV3 cells. CKK-8, annexin V-FITC–propidium iodide, qPCR and western blot assays were performed to detect cells proliferation, cells apoptosis, RNA expression, and protein expression, respectively.
LncRNA TUG1 expression was higher in tumor tissue compared to paired adjacent tissue (P < .001), and it was positively correlated with pathological grade (P = .022), tumor size (P = .011) and FIGO stage (P < .001). Kaplan-Meier curve showed that lncRNA TUG1 high expression was associated with worse OS (P = .003). Multivariate Cox analysis indicated that lncRNA TUG1 high expression (vs. low expression) (P = .035) was independently predictive factor for shorter OS. In vitro, cells proliferation was promoted after treatment with lncRNA TUG1 mimic and was suppressed after treatment with lncRNA TUG1 inhibitor. In addition, cells apoptosis rate was decreased in lncRNA TUG1 mimic group compared to NC1 mimic, and increased in lncRNA TUG1 inhibitor group compared to NC2 inhibitor.
In conclusion, lncRNA TUG1 is positively correlated with advanced disease and poor prognosis, and it promotes cells proliferation and inhibits cells apoptosis in EOC cells.
Keywords: cells apoptosis, cells proliferation, epithelial ovarian cancer, LncRNA TUG1, prognosis
1. Introduction
Epithelial ovarian cancer (EOC) is the seventh common diagnosed cancer and the fourth leading cause of cancer-related mortality in women, accounting for nearly 5% of all cancer and 4.2% of all cancer deaths among female all over the world.[1–3] According to 2015 global cancer statistics, EOC affects estimated 239,000 populations and leads to 151,900 deaths during 2012.[4] In China, there are approximately 52,100 new cases and 22,500 deaths causing by EOC during 2015.[5] In addition, an increasing trend in mortality owing to EOC is observed in the last 2 decades because of several factors, including late diagnosis, chemoresistance, and complexed pathological process via dysregulation of tumor-related genes.[3] Hence, further understanding of molecular mechanisms underlying EOC progression may help improve the diagnosis and develop novel therapeutic targets.
Long non-coding RNAs (lncRNAs), a heterogeneous class of endogenous RNA molecules composed of >200 nucleotides, is characterized by the limiting or no protein-coding capacity.[6,7] Accumulating evidences have proven that lncRNAs play critical roles in biological processes, such as cells proliferation, cells apoptosis, cells invasion as well as cells differentiation, and their aberrant expressions involve into the process of tumorigenesis and cancer progression via mediating oncogenic or tumor-suppressing pathways.[8,9]
LncRNA taurine-upregulated gene 1 (TUG1), a novel lncRNA with 6.7-kb nucleotides, has been promulgated as an oncogene contributing to the development and prognosis of several carcinomas, including bladder cancer, osteosarcoma, and colorectal cancer.[9–12] However, the role of lncRNA TUG1 in EOC and its function in EOC cells are still unclear. Therefore, the purpose of this study was to evaluate the correlation of lncRNA TUG1 with clinicopathological characteristics as well as overall survival (OS) in EOC patients, and investigate function on EOC cells in vitro.
2. Materials and methods
2.1. Patients
A total of 96 EOC patients who received surgery, from July 2013 to June 2016 in People's Hospital of Lishui City were retrospectively included in this study. The inclusion criteria were: diagnosis as EOC confirmed by pathological and clinical examinations; age >18 years; completed clinical and pathological data; tumor tissue and paired adjacent tissue were accessible to be obtained from sample storehouse of the Hospital and were available for quantitative polymerase chain reaction (qPCR) assay. Patients with secondary ovarian cancer, history of other tumors, or previous ovarian surgery were excluded. This study was performed according to the Declaration of Helsinki. Institutional Review Board of People's Hospital of Lishui City approved this study, and written informed consents or oral agreements by telephone (with recording) were obtained from all patients or their guardians.
2.2. Data collection
Clinicopathological data were collected from Electronic Medical Record System or Medical Records Room, which include age, histological subtype, pathological grade, peritoneal cytology, tumor size, volume of ascites, International Federation of Gynecology and Obstetrics (FIGO) stage, carbohydrate antigen 125 (CA125), and survival information. Patients were followed up according to the disease conditions and patients’ willing; the median followed up duration was 23.5 (range 1.0–46.0 months) months, and the last follow-up date was July 1, 2017. OS was calculated from the time of surgery to the date of death from any cause.
2.3. Samples and lncRNA TUG1 determination
Tumor tissue and adjacent tissue were obtained during the surgery and stored in the liquid nitrogen in sample storehouse. LncRNA TUG1 expressions in both tumor tissue sample and adjacent non-tumor tissue sample were measured by quantitative polymerase chain reaction (qPCR) assay.
2.4. Cells culture
Human EOC cells (SKOV3 cells) were purchased from Cell Bank of the Chinese Academy of Sciences (Shanghai, China). After resuscitation, cells were cultured in Roswell Park Memorial Institute (RPMI) 1640 (Sigma-Aldrich) medium supplemented with 10% fetal bovine serum (Gibco), 100 U/mL penicillin, and 100 mg/mL streptomycin in a humidified incubator at 37°C with 5% CO2.
2.5. Cells transfection
After washing with PBS and replacing RPMI 1640 (Sigma-Aldrich) medium supplement, SKOV3 cells were transfected with blank mimic, lncRNA TUG1 mimic, blank inhibitor and lncRNA TUG1 inhibitor plasmids, which were divided into 4 groups, including NC1 mimic, lncRNA TUG1 mimic, NC2 inhibitor, and lncRNA TUG1 inhibitor groups. Transfection efficiency was estimated by qPCR assay. The following TUG1 siRNA sequences were designed: siRNA-TUG1 (SenseSeq: 5’-CCUCAGAUCUCAUCUAAAUTT-3’; AntiSeq: 5’-AUUUAGAUGAGAUCUGAGGTT-3’) and negative control siRNA (SenseSeq: 5’-U UCUCCGAACGUGUCACUTT-3’; AntiSeq: 5’-ACGUGACACGUUCGG AGAATT-3’).
2.6. qPCR
qPCR was determined to assess lncRNA and mRNA expression. Total RNA was extracted by the TRIzol reagent (Invitrogen) according to the manufacturer's instructions, and then RNA was quantitated by OD 260 (Takara, Japan). After that, RNA from each group was used for cDNA synthesis, and cDNA was then subjected to qPCR with SYBR Green kit (Takara, Japan). The PCR amplification was carried out as follows: 95°C for 5 minutes, followed by 40 cycles of 95°C for 5 seconds, 61°C for 30 seconds. The qPCR results were calculated by using the 2-ΔΔct method and U6 was served as the internal reference. The following primer sequences were as follows: TUG1, forward 5’-TAGGAGTGGATGTGTTCTGTAGCA-3’, reverse 5’–TGGTCGTGGAATATGGTCAATGAG-3’; U6, forward’–CTCGCTTCGGCAGCACATA-’, reverse 5’-CTCGCTTCGGCAGCACATA-3’.
2.7. Cells proliferation assay
After adding 10 μL of CCK8 (Dojindo, Japan) and 90 μL RPMI 1640 medium into each plate of cells, the sections were incubated at 37°C under 5% CO2, and microplate reader (Biotek) was subsequently used to measure OD value. The proliferative-detection was performed at 0, 24, and 48 hours after transfection.
2.8. Annexin V-FITC–propidium Iodide assay
For the analysis of cells apoptosis, cells were digested by pancreatin and washed three times with PBS, then suspended in 100 μL blinding buffer. After adding 5 μL Annexin V-FITC (AV) (Invitrogen), incubation was performed at room temperature for 15 minutes in the dark, and then 5 μL propidium iodide (PI) (Invitrogen) was added to the cell suspension and incubated at room temperature for 15 minutes in the dark. The cells stained with AV and PI were detected with flow cytometry.
2.9. Western blot assay and antibody
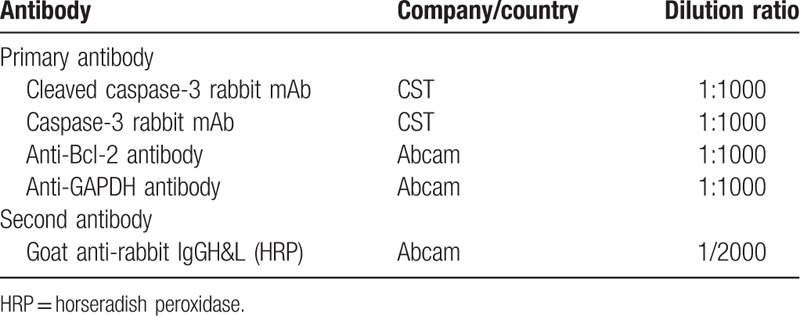
At 48 hours after transfection, total protein was extracted from lysing cells in 1 mL of RIPA buffer (Thermo Fisher Scientific). A bicinchoninic acid kit (Pierce Biotechnology) was used to measure the protein concentration, which was subsequently adjudged based on the standard curve. After that, 20-μg protein sample was fractionated by 10% sodium dodecyl sulfate-polyacrylamide gel electrophoresis and transferred to polyvinylidene fluoride membranes (Millipore). Five percent skim milk was then used to block the protein for 2 hours. The primary antibody (Table 1) was added for incubation of membranes at 4°C overnight. Subsequently, secondary antibody (Table 1) was added for incubation for 1 hour at room temperature. Blots were exposed to x-ray films for chemiluminescence following treatment using an enhanced chemiluminescence kit (Millipore).
Table 1.
Antibodies used in this study.
2.10. Statistics
Statistics was carried out using 2010 office software (Microsoft) and GraphPad prim 6.0 (GraphPad). Data were presented in mean ± standard deviation, median (25th–75th) or count (%). Comparison was determined by Wilcoxon rank sum test. Kaplan-Meier (K-M) curves and log-rank test were used to compare OS between different groups. Univariate Cox proportional hazard regression was used to assess all factors affecting OS, whereas all factors with P value no more than .1 were further detected by multivariate Cox proportional hazard regression. P < .05 was considered significant.
3. Results
3.1. Baseline characteristics
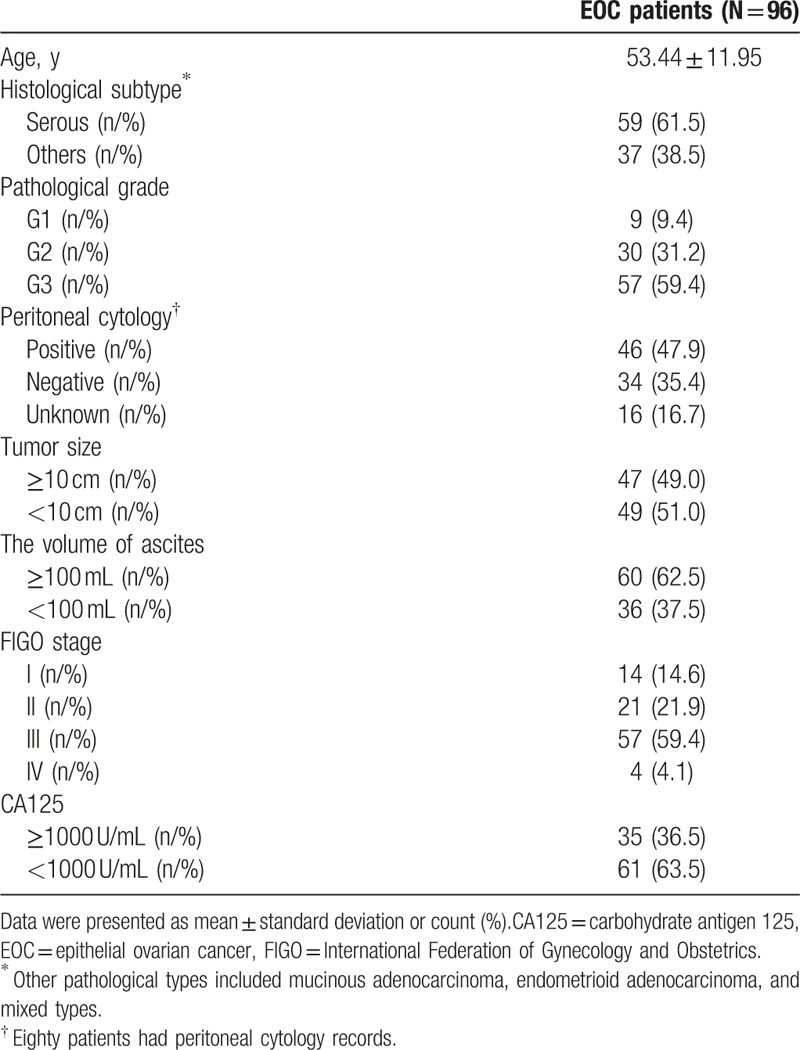
Mean age of 96 EOC patients was 53.44 ± 11.95 years (Table 2). The number of patients with pathological grade 1 (G1), G2, and G3 were 9 (9.4%), 30 (31.2%), and 57 (59.4%), respectively. Sixty (62.5%) patients were with ascites ≥100 mL, whereas others (N = 36 [37.5%]) were with ascites <100 mL. As to FIGO stage, the numbers of patients in stage I, II, III, and IV were 14 (14.6%), 21 (21.9%), 57 (59.4%), and 4 (4.1%), respectively. There were 35 (36.5%) patients with CA125 (≥1000 U/mL) and 61 (63.5%) patients with CA125 (<1000 U/mL). Other baseline characteristics were presented in Table 2.
Table 2.
Baseline characteristics.
3.2. Comparison of lncRNA TUG1 expression in tumor tissue and paired adjacent tissue
Wilcoxon rank sum test was performed to compare lncRNA TUG1 expression in tumor tissue and paired adjacent tissue (Fig. 1). The expression of lncRNA TUG1 was higher in tumor tissue compared to paired adjacent tissue (P < .001). The median value of lncRNA TUG1 expression in tumor tissue and paired adjacent tissue was 2.344 (1.394–3.403) and 1.182 (0.738–1.849), respectively.
Figure 1.
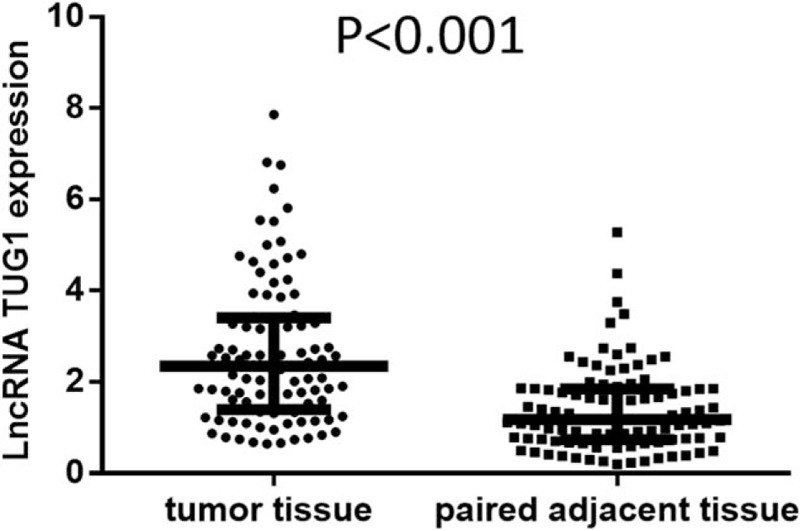
Comparison of lncRNA TUG1 expression in tumor tissue and paired adjacent tissue. The expression of lncRNA TUG1 was higher in tumor tissue compared to paired adjacent tissue. Comparison between groups was performed by Wilcoxon rank sum test. P < .05 was considered significant. lncRNAs = long non-coding RNAs, TUG1 = taurine-upregulated gene 1.
3.3. Correlation between tumor lncRNA TUG1 expression and clinicopathological characteristics
Analyses of tumor lncRNA TUG1 expression in subgroups classified by clinicopathological features were performed (Fig. 2). Higher expression of lncRNA TUG1 was correlated with pathological grade G3 (vs. G1/2) (P = .022, Fig. C), tumor size ≥10 (vs. <10 cm) (P = .011, Fig. 2E) and FIGO stage III-IV (vs. stage I-II) (P < .001, Fig. 2G), whereas no difference of tumor lncRNA TUG1 expression in other subgroups was observed (all P > .05), including age (≥50 vs. <50 years) (Fig. 2A), histological subtype (serous vs. others) (Fig. 2B), peritoneal cytology (positive vs. negative) (Fig. 2D), the volume of ascites (≥100 vs. <100 mL) (Fig. 2F), and CA125 (≥1000 vs. <1000 U/mL) (Fig. 2H).
Figure 2.
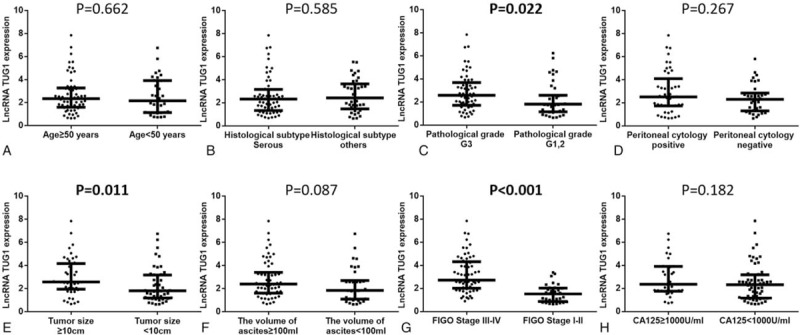
Tumor lncRNA TUG1 expression in subgroups. (A) Age (≥50 vs. <50 years); (B) histological subtype (serous vs. others); (C) pathological grade (G3 vs. G1/2); (D) peritoneal cytology (positive vs. negative); (E), tumor size (≥10 vs. <10 cm); (F) the volume of ascites (≥100 vs. <100 ml); (G) FIGO Stage (III-IV vs. I-II); (H) CA125 (≥1000 vs. <1000 U/mL). Higher expression of lncRNA TUG1 was correlated with patients with FIGO stage III-IV compared to patients with FIGO stage I-II, while no difference of lncRNA TUG1 expression in other subgroups was found. Comparison between groups was performed by Wilcoxon rank sum test. P < .05 was considered significant. FIGO = International Federation of Gynecology and Obstetrics, lncRNAs = long non-coding RNAs, TUG1 = taurine-upregulated gene 1.
3.4. Correlation of lncRNA TUG1 expression with OS
K-M curve and log-rank test were performed to evaluate the correlation of lncRNA TUG1 expression with OS (Fig. 3), high expression of lncRNA TUG1 was associated with worse OS compared to low expression of lncRNA TUG1 (P = .003).
Figure 3.
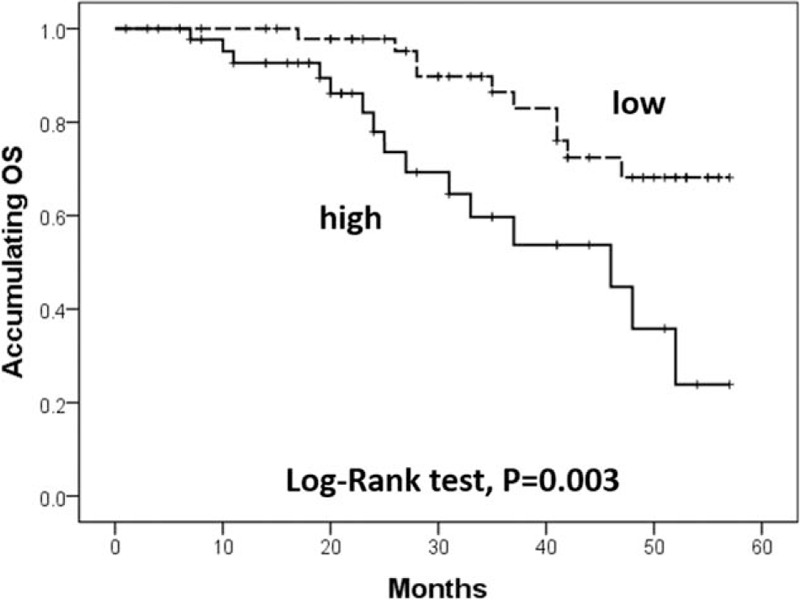
Correlation of lncRNA TUG1 expression with OS. High expression of lncRNA TUG1 was associated with worse OS compared to low expression of lncRNA TUG1. Kaplan-Meier curves and log-rank test were used to evaluate OS. lncRNAs = long non-coding RNAs, OS = overall survival, TUG1 = taurine-upregulated gene 1. P < .05 was considered significant.
3.5. Factors affecting OS
All factors affecting OS were assessed by univariate Cox proportional hazard regression, which suggested that higher expression of tumor lncRNA TUG1 (P = .004), pathological grade G3 (vs. G1/2) (P = .045), the volume of ascites ≥100 mL (P = .024) and FIGO stage III-IV (vs. I-II) (P = 0.008) were correlated with worse OS in EOC patients (Table 3). In addition, factors with a P value below 0.1 in univariate Cox's proportional hazard regression were further evaluated in multivariate Cox's proportional hazard regression, which indicated that high expression of tumor lncRNA TUG1 (P = .035) and the volume of ascites ≥100 mL (P = .031) were independently predictive factors for shorter OS in EOC patients.
Table 3.
Factors affecting OS by Cox proportional hazard regression.

3.6. LncRNA TUG1 expression after plasmids transfection
We further explored the function of lncRNA TUG1 in EOC cells in vitro. After transfection, PCR assay was performed. We observed that transfection rates were all >90% in NC1 mimic, lncRNA TUG1 mimic, NC2 inhibitor, and lncRNA TUG1 inhibitor groups (Fig. 4A), and lncRNA TUG1 expression was increased after transfection with lncRNA TUG1 mimic, and was decreased after transfection with lncRNA TUG1 inhibitor (Fig. 4B).
Figure 4.
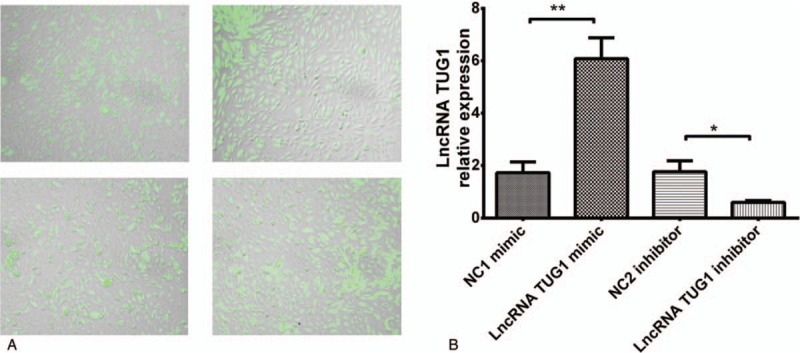
LncRNA TUG1 expression after plasmids transfection. (A) Transfection rate swere all >90% in 4 groups. (B) LncRNA TUG1 expression was increased in lncRNA TUG1 mimic group and decreased in lncRNA inhibitor group compared to NCs. ∗P < .05, ∗∗P < .01. lncRNAs = long non-coding RNAs, TUG1 = taurine-upregulated gene 1.
3.7. CKK8 Assay after transfection
We subsequently investigated whether lncRNA TUG1 could regulate cells proliferation by CCK8 assay after transfection. Cells proliferation was promoted after treatment with lncRNA TUG1 mimic and was suppressed after treatment with lncRNA TUG1 inhibitor, indicating that lncRNA TUG1 could facilitate proliferation in EOC cells (Fig. 5).
Figure 5.
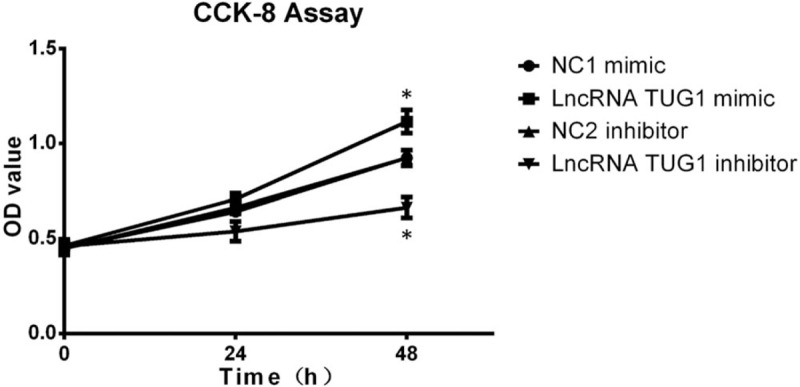
CKK8 assay after transfection. CKK8 assay was performed to determine proliferation of EOC cells after transfection. Cells proliferation was promoted after treatment with lncRNA TUG1 mimic and was suppressed after treatment with lncRNA TUG1 inhibitor. ∗P < .05, ∗∗P < .01. EOC = epithelial ovarian cancer, lncRNAs = long non-coding RNAs, TUG1 = taurine-upregulated gene 1.
3.8. Cells apoptosis after transfection
Cells apoptosis after transfection was also performed, which revealed that cells apoptosis rate was decreased after treatment with lncRNA TUG1 mimic compared to NC1 mimic, and was increased after treatment with lncRNA TUG1 inhibitor compared to NC2 inhibitor (Fig. 6A and B). We also detected cells apoptosis related protein. As shown in Figure 6C, lncRNA TUG1 mimic decreased the expression of C-Caspase 3, and lncRNA TUG1 inhibitor increased the expression of C-Caspase 3. As to Bcl-2 expression, lncRNA TUG1 mimic increased Bcl-2 expression and lncRNA TUG1 inhibitor decreased Bcl-2 expression. These finding suggested that lncRNA TUG1 could repress apoptosis in EOC cells.
Figure 6.
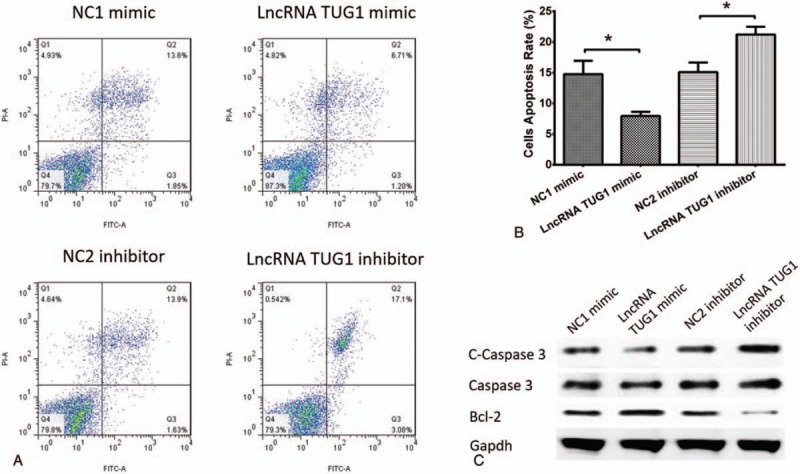
Cells apoptosis after transfection. (A and B) Cells apoptosis rate was reduced in lncRNA TUG1 mimic group than NC1 mimic group, and increased in lncRNA TUG1 inhibitor group than NC2 inhibitor group. (C) lncRNA TUG1 decreased C-Caspase 3 expression and increased Bcl-2 expression in EOC cells. ∗P < .05, ∗∗P < .01. EOC = epithelial ovarian cancer, lncRNAs = long non-coding RNAs, TUG1 = taurine-upregulated gene 1.
4. Discussion
In the present study, we observed that: LncRNA TUG1 expression was higher in tumor tissue compared to paired adjacent tissue; LncRNA TUG1 expression was positively correlated with advanced disease, multivariate Cox analysis indicated that tumor lncRNA TUG1 higher expression could independently predict for shorter OS in EOC patients; ncRNA TUG1 promoted cells proliferation and inhibited cells apoptosis in EOC cells.
LncRNAs are considered as new modulators in the process of tumorigenesis and progression in cancer by regulating several genes and pathways.[13–15] Accumulating evidences have proven that lncRNAs involve in many types of gene regulation through multiple mechanisms, including chromatin remodeling; mediating transcription factors and co-activators (cis-acting) recruitment; alternatively splicing pre-mRNAs; inhibiting RNA polymerase II activity; sequestrating microRNAs; medicating mRNA stability, to sequentially accumulate the development of various carcinomas, such as EOC, breast cancer, and colorectal cancer.[15–22] To EOC that is the most deadly gynecological malignancy, several lncRNAs, including HOX transcript antisense RNA (HOTAIR), colon cancer-associated transcript 2 (CCAT2), and nuclear paraspeckle assembly transcript 1, have been reported to dedicate to the prognosis in EOC patients.[23–25] An interesting study indicates that lncRNA CCAT2 is positively associated with FIGO stage, tumor grade as well as distant metastasis, and its high expression was correlated with worse OS and disease-free survival, which constitutes a potential biomarker for poor prognosis in EOC patients.[24] Another study determines that high expression of lncRNA protein sprouty homolog 4 (SPRY4)-intron 1 may be an independent predictive biomarker for shorter prognosis-free survival and OS in EOC patients.[22] These data suggest that lncRNAs involve in the progress of EOC and could be developed as prognostic biomarkers in EOC patients.
LncRNA TUG1, located on chromosome 22q12, is commonly expressed in human tissues and carcinomas cells, which has been verified as an oncogene to several cancers.[26–28] Recent data prove that lncRNA TUG1 is positively correlated with tumor size, distant metastasis as well as TNM stage, and it might act as a diagnostic and prognostic biomarker in patients with breast cancer.[26] Also another study illustrates that overexpression of lncRNA TUG1 is associated with worse lymph nodes metastasis and advanced TNM stage in patients with gastric cancer.[27] Furthermore, upregulated expressions of lncRNA TUG1 are correlated with shorter OS in breast cancer, colorectal cancer as well as clear cell renal cell carcinoma, and so on.[26,28,29] These data have proven that lncRNA TUG1 may serve as a convinced unfavorable prognosis factor for some carcinomas, while little is known about the role of lncRNA TUG1 in EOC. Therefore, we investigated the role of lncRNA TUG1 in EOC, and found that lncRNA TUG1 expression was positively associated with pathological grade, tumor size, as well as FIGO stage, and it could be served as an independent risk factor for OS in EOC patients, indicating that lncRNA TUG1 may be a potential biomarker for tumor prognosis in EOC patients. However, the sample size in this study was relatively small with enrollment of 96 EOC patients; thus, the role of lncRNA TUG1 in EOC is needed to be further validated in larger number of patients.
To explore the effects of lncRNA TUG1 in pathological process of cancer and its potential mechanism, several vitro experiments have been performed. For example, lncRNA TUG1 accumulates cells proliferation and represses cells apoptosis by promoting zinc finger E-box-binding homeobox 2 (ZEB2) mediated by miR-142 through the inactivation of Wnt/β-catenin pathway in bladder cancer cells.[30] Also, lncRNA TUG1 promotes oral squamous cell carcinoma cells proliferation and invasion through inhibiting miR-219 or inducing formin-like protein 2.[31] Another study identifies that lncRNA TUG1 facilitates cells proliferation and invasion in papillary thyroid cancer cells via regulating miR-145/ZEB1 signal pathway.[32] In the present study, the results showed that lncRNA TUG1 induced cells proliferation and inhibited apoptosis in EOC. These might suggest that lncRNA TUG1 contributes to EOC pathology via mediating cells proliferation and cells apoptosis through several genes or pathways.
In conclusion, lncRNA TUG1 is positively correlated with advanced disease and poor prognosis, and it promotes cells proliferation and inhibits cells apoptosis in EOC cells.
Author contributions
Conceptualization: Yan Chen.
Data curation: Jingjing Zhang.
Formal analysis: Tonghuai Li, Jingjing Zhang, Shaoxiao Liu.
Investigation: Tonghuai Li.
Methodology: Tonghuai Li, Jingjing Zhang, Shaoxiao Liu.
Project administration: Yan Chen.
Resources: Yan Chen.
Supervision: Yan Chen.
Validation: Shaoxiao Liu.
Writing – original draft: Tonghuai Li, Jingjing Zhang, Shaoxiao Liu.
Writing – review & editing: Shaoxiao Liu, Yan Chen.
Footnotes
Abbreviations: BCA = bicinchoninic acid, CA125 = carbohydrate antigen 125, CCAT2 = colon cancer associated transcript 2, EOC = epithelial ovarian cancer, FIGO = International Federation of Gynecology and Obstetrics, lncRNAs = long non-coding RNAs, OS = overall survival, qPCR = quantitative polymerase chain reaction, RPMI = Roswell Park Memorial Institute, TUG1 = taurine-upregulated gene 1, ZEB2 = zinc finger E-box-binding homeobox 2.
The authors report no conflicts of interest.
References
- [1].Jayson GC, Kohn EC, Kitchener HC, et al. Ovarian cancer. Lancet 2014;384:1376–88. [DOI] [PubMed] [Google Scholar]
- [2].Cramer DW. The epidemiology of endometrial and ovarian cancer. Hematol Oncol Clin North Am 2012;26:1–2. [DOI] [PMC free article] [PubMed] [Google Scholar]
- [3].Pal MK, Jaiswar SP, Dwivedi VN, et al. MicroRNA: a new and promising potential biomarker for diagnosis and prognosis of ovarian cancer. Cancer Biol Med 2015;12:328–41. [DOI] [PMC free article] [PubMed] [Google Scholar]
- [4].Torre LA, Bray F, Siegel RL, et al. Global cancer statistics, 2012. CA Cancer J Clin 2015;65:87–108. [DOI] [PubMed] [Google Scholar]
- [5].Chen W, Zheng R, Baade PD, et al. Cancer statistics in China, 2015. CA Cancer J Clin 2016;66:115–32. [DOI] [PubMed] [Google Scholar]
- [6].Djebali S, Davis CA, Merkel A, et al. Landscape of transcription in human cells. Nature 2012;489:101–8. [DOI] [PMC free article] [PubMed] [Google Scholar]
- [7].Guttman M, Rinn JL. Modular regulatory principles of large non-coding RNAs. Nature 2012;482:339–46. [DOI] [PMC free article] [PubMed] [Google Scholar]
- [8].Qiu MT, Hu JW, Yin R, et al. Long noncoding RNA: an emerging paradigm of cancer research. Tumour Biol 2013;34:613–20. [DOI] [PubMed] [Google Scholar]
- [9].Wang L, Zhao Z, Feng W, et al. Long non-coding RNA TUG1 promotes colorectal cancer metastasis via EMT pathway. Oncotarget 2016;7:51713–9. [DOI] [PMC free article] [PubMed] [Google Scholar]
- [10].Li Z, Shen J, Chan MT, et al. TUG1: a pivotal oncogenic long non-coding RNA of human cancers. Cell Prolif 2016;49:471–5. [DOI] [PMC free article] [PubMed] [Google Scholar]
- [11].Han Y, Liu Y, Gui Y, et al. Long intergenic non-coding RNA TUG1 is overexpressed in urothelial carcinoma of the bladder. J Surg Oncol 2013;107:555–9. [DOI] [PubMed] [Google Scholar]
- [12].Zhang Q, Geng PL, Yin P, et al. Down-regulation of long non-coding RNA TUG1 inhibits osteosarcoma cell proliferation and promotes apoptosis. Asian Pac J Cancer Prev 2013;14:2311–5. [DOI] [PubMed] [Google Scholar]
- [13].Sun C, Li S, Zhang F, et al. Long non-coding RNA NEAT1 promotes non-small cell lung cancer progression through regulation of miR-377-3p-E2F3 pathway. Oncotarget 2016;7:51784–814. [DOI] [PMC free article] [PubMed] [Google Scholar]
- [14].Cai H, Liu X, Zheng J, et al. Long non-coding RNA taurine upregulated 1 enhances tumor-induced angiogenesis through inhibiting microRNA-299 in human glioblastoma. Oncogene 2017;36:318–31. [DOI] [PubMed] [Google Scholar]
- [15].Fu X, Zhang L, Dan L, et al. LncRNA EWSAT1 promotes ovarian cancer progression through targeting miR-330-5p expression. Am J Transl Res 2017;9:4094–103. [PMC free article] [PubMed] [Google Scholar]
- [16].Gooding AJ, Zhang B, Jahanbani FK, et al. The lncRNA BORG drives breast cancer metastasis and disease recurrence. Sci Rep 2017;7:12698. [DOI] [PMC free article] [PubMed] [Google Scholar]
- [17].Zhai HY, Sui MH, Yu X, et al. Overexpression of long non-coding RNA TUG1 promotes colon cancer progression. Med Sci Monit 2016;22:3281–7. [DOI] [PMC free article] [PubMed] [Google Scholar]
- [18].Yu X, Li Z. Long non-coding RNA HOTAIR: a novel oncogene (review). Mol Med Rep 2015;12:5611–8. [DOI] [PubMed] [Google Scholar]
- [19].Li CH, Chen Y. Targeting long non-coding RNAs in cancers: progress and prospects. Int J Biochem Cell Biol 2013;45:1895–910. [DOI] [PubMed] [Google Scholar]
- [20].Tano K, Akimitsu N. Long non-coding RNAs in cancer progression. Front Genet 2012;3:219. [DOI] [PMC free article] [PubMed] [Google Scholar]
- [21].Dey BK, Mueller AC, Dutta A. Long non-coding RNAs as emerging regulators of differentiation, development, and disease. Transcription 2014;5:e944014. [DOI] [PMC free article] [PubMed] [Google Scholar]
- [22].Li H, Liu C, Lu Z, et al. Upregulation of the long non-coding RNA SPRY4-IT1 indicates a poor prognosis and promotes tumorigenesis in ovarian cancer. Biomed Pharmacother 2017;88:529–34. [DOI] [PubMed] [Google Scholar]
- [23].Qiu JJ, Wang Y, Ding JX, et al. The long non-coding RNA HOTAIR promotes the proliferation of serous ovarian cancer cells through the regulation of cell cycle arrest and apoptosis. Exp Cell Res 2015;333:238–48. [DOI] [PubMed] [Google Scholar]
- [24].Huang S, Qing C, Huang Z, et al. The long non-coding RNA CCAT2 is up-regulated in ovarian cancer and associated with poor prognosis. Diagn Pathol 2016;11:49. [DOI] [PMC free article] [PubMed] [Google Scholar]
- [25].Adriaens C, Standaert L, Barra J, et al. p53 induces formation of NEAT1 lncRNA-containing paraspeckles that modulate replication stress response and chemosensitivity. Nat Med 2016;22:861–8. [DOI] [PubMed] [Google Scholar]
- [26].Li T, Liu Y, Xiao H, et al. Long non-coding RNA TUG1 promotes cell proliferation and metastasis in human breast cancer. Breast Cancer 2017;24:535–43. [DOI] [PubMed] [Google Scholar]
- [27].Zhang E, He X, Yin D, et al. Increased expression of long noncoding RNA TUG1 predicts a poor prognosis of gastric cancer and regulates cell proliferation by epigenetically silencing of p57. Cell Death Dis 2016;7:e2109. [DOI] [PMC free article] [PubMed] [Google Scholar]
- [28].Sun J, Ding C, Yang Z, et al. The long non-coding RNA TUG1 indicates a poor prognosis for colorectal cancer and promotes metastasis by affecting epithelial-mesenchymal transition. J Transl Med 2016;14:42. [DOI] [PMC free article] [PubMed] [Google Scholar]
- [29].Wang PQ, Wu YX, Zhong XD, et al. Prognostic significance of overexpressed long non-coding RNA TUG1 in patients with clear cell renal cell carcinoma. Eur Rev Med Pharmacol Sci 2017;21:82–6. [PubMed] [Google Scholar]
- [30].Liu Q, Liu H, Cheng H, et al. Downregulation of long noncoding RNA TUG1 inhibits proliferation and induces apoptosis through the TUG1/miR-142/ZEB2 axis in bladder cancer cells. Onco Targets Ther 2017;10:2461–71. [DOI] [PMC free article] [PubMed] [Google Scholar]
- [31].Yan G, Wang X, Yang M, et al. Long non-coding RNA TUG1 promotes progression of oral squamous cell carcinoma through upregulating FMNL2 by sponging miR-219. Am J Cancer Res 2017;7:1899–912. [PMC free article] [PubMed] [Google Scholar]
- [32].Lei H, Gao Y, Xu X. LncRNA TUG1 influences papillary thyroid cancer cell proliferation, migration and EMT formation through targeting miR-145. Acta Biochim Biophys Sin (Shanghai) 2017;49:588–97. [DOI] [PubMed] [Google Scholar]


