

SUMMARY
The nervous system, the immune system, and microbial pathogens interact closely at barrier tissues. Here we find that a bacterial pathogen, Streptococcus pyogenes, hijacks pain and neuronal regulation of the immune response to promote bacterial survival. Necrotizing fasciitis is a life-threatening soft tissue infection in which “pain is out of proportion” to early physical manifestations. We find that S. pyogenes, the leading cause of necrotizing fasciitis, secretes streptolysin S (SLS) to directly activate nociceptor neurons and produce pain during infection. Nociceptors, in turn, release the neuropeptide calcitonin gene-related peptide (CGRP) into infected tissues, which inhibits the recruitment of neutrophils and opsonophagocytic killing of S. pyogenes. Botulinum neurotoxin A and CGRP antagonism block neuron-mediated suppression of host defense, thereby preventing and treating S. pyogenes necrotizing infection. We conclude that targeting the peripheral nervous system and blocking neuro-immune communication is a promising strategy to treat highly invasive bacterial infections.
IN BRIEF
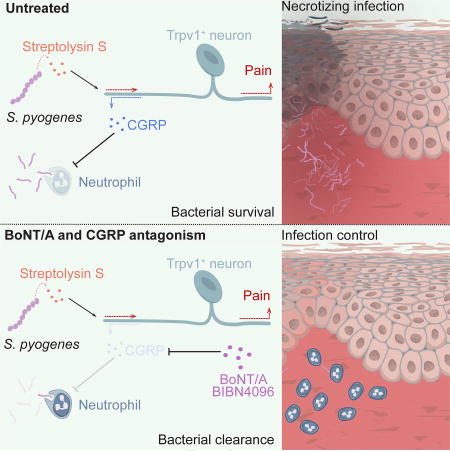
Flesh-eating bacteria hijack a pain response that suppresses host defense and blocking this neuro-immune communication holds potential for treatment
The skin is a major barrier tissue that is exposed to external insults and microbial invasion. The somatosensory nervous system densely innervates the skin, detecting noxious and environmental stimuli to mediate pain, itch, thermosensation, and mechanosensation (Abraira and Ginty, 2013; Basbaum et al, 2009). Somatosensory neurons actively communicate with the immune system in pain and inflammatory conditions (Pinho-Ribeiro et al., 2017). However, the role of the sensory nervous system in host defense is not well understood. Here we find that Streptococcus pyogenes, an invasive bacterial pathogen, activates sensory neurons to produce pain and to induce neural suppression of the immune system to enhance its survival during infection.
Necrotizing fasciitis (or “flesh-eating disease”) is a life-threatening, aggressive bacterial infection of the subcutaneous tissue and underlying fascia. A cardinal manifestation of this infection is “pain out of proportion” to physical findings at early time points (Borschitz et al., 2015). S. pyogenes (or group A Streptococcus) is a gram-positive bacterial pathogen and the leading cause of necrotizing fasciitis (Leitch et al., 2000). S. pyogenes also frequently causes pharyngitis (or “strep throat”), a painful infection that affects 600 million people annually (Ralph and Carapetis, 2013). Necrotizing fasciitis is difficult to treat and has a mortality rate of 24–32% in developed countries (Cole et al., 2011). Due to its rapid progression, disfiguring surgical debridement or limb amputation is often required to prevent mortality. Despite the importance of pain in the diagnosis of necrotizing fasciitis, the role of pain in S. pyogenes invasion is unclear.
Nociceptor neurons are the specific subset of peripheral sensory neurons that mediate pain, an unpleasant sensation that warns organisms of danger. In addition to transducing pain signals to the central nervous system, nociceptors release neuropeptides from their peripheral nerve terminals that can directly modulate inflammation. These neuropeptides bind to their cognate receptors on immune cells, leading to changes in transcription, cytokine production, and immune phenotypic polarization (Pinho-Ribeiro et al., 2017). Recent work shows that sensory neurons communicate with immune cells in allergic airway inflammation (Caceres et al., 2009; Talbot et al., 2015), atopic dermatitis (Wilson et al., 2013a, 2013b; Oetjen et al, 2017), and psoriasis (Riol-Blanco et al., 2014).
We identify a critical role for the nervous system in the regulation of host defense during S. pyogenes invasive infection. In mouse models of necrotizing fasciitis established using S. pyogenes clinical isolates, we show that bacteria directly activate TRPV1+ neurons to produce pain through the action of the secreted pore-forming toxin SLS. Nociceptors release CGRP, a neuropeptide that suppresses the recruitment and bactericidal activity of neutrophils essential for host defense. Silencing nerve fibers and their signaling to immune cells via administration of botulinum neurotoxin A (BoNT/A) or a CGRP antagonist halts bacterial invasion, showing that targeting the nervous system could be a strategy to enhance host defense and treat invasive bacterial infections.
RESULTS
S. pyogenes induces pain independently of the inflammatory response
To study the role of pain fibers in bacterial invasion, we adapted a mouse model of S. pyogenes infection shown to mimic pathologic features of human necrotizing fasciitis (Ashbaugh et al., 1998). We used two S. pyogenes strains from human infections: 1) 854 M-type 1 (M1), a clinical isolate representative of the dominant clonal group among isolates from contemporary invasive infections (Gryllos et al., 2008), and (2) 950771 M-type 3 (M3), a clinical isolate from a child with necrotizing fasciitis (Ashbaugh et al., 1998).
We initiated subcutaneous infection of the mouse hind paw, which is densely innervated and well suited for the study of pain reflex behaviors. Both bacterial strains induced progressive edema and dermonecrotic lesions (Figure 1A), necrosis in the subcutaneous tissues, overlying dermis, and thrombosis of the arterioles and venules, resembling human necrotizing fasciitis (Figure 1B). Body weight loss and mortality occurred over time, associated with bacterial proliferation (Figure S1A–S1C). While M3 produced lethality at all doses, M1 only caused death at the highest dose (Figure S1B).
Figure 1. S. pyogenes induces pain associated behaviors and directly activates sensory neurons.

(A) Representative images of mouse hind paws at different time points after subcutaneous injection of S. pyogenes M1 or M3 strains (5×10⁷ cfu). (B) Histopathology of skin and soft tissue biopsies 72 h after injection of vehicle, M1 or M3 (5×10⁷ cfu). Scale bars, 100 µm. (C) Spontaneous pain reflexes (lifting/licking of hind paw) over 1 h after injection of different inoculums of M1 (n=4/group) or M3 (n=9–11/group). (D) Mechanical sensitivity after injection of vehicle, S. pyogenes M1 (n=8–9/group) or M3 (n=7–10/group). (E) Heat sensitivity after injection of vehicle, S. pyogenes M1 (n=8–9/group) or M3 (n=7–9/group). (F) Representative Fura-2 ratiometric fields (Left) and calcium traces (Center) of DRG neurons at baseline and after stimulation in vitro with live S. pyogenes M3 (5×10⁹ cfu/mL), capsaicin (1 µm), and KCl (40 mM). Scale bars, 50 µm. Proportions (Right) of capsaicin non-responsive (Cap−) and capsaicin responsive (Cap+) neurons that responded to M3 (n=3–4 fields/condition). Statistical analysis: (C) One-way ANOVA, Tukey post-tests. (D–E) Two-way ANOVA, Bonferroni post-tests. (F) Two-way ANOVA, Bonferroni post-tests. (C,F) *p<0.05 **p<0.01 ***p<0.001 ****p<0.0001. (D,E) veh vs 5×10⁷ cfu: ***p<0.001 ****p<0.0001, veh vs 5×10⁶ cfu: †p<0.05 ††p<0.01 †††p<0.001 ††††p<0.0001, veh vs 5×10⁵ cfu: §§p<0.01 §§§§p<0.0001. ns=not significant. Mean±SEM. See Figure S1 for related data.
Pain behavioral analysis showed that both S. pyogenes M1 and M3 bacterial strains evoked dose-dependent and robust, spontaneous lifting/licking and flinching pain reflexes of the infected paw within minutes of injection (Figures 1C, S1D–S1E). M1 and M3 strains also produced dose-dependent mechanical hyperalgesia (increased sensitivity to noxious stimuli) within 1 h that continued for 48 h post-injection (Figure 1D). At lower doses, M1 infection induced stronger mechanical hyperalgesia than M3 infection. Heat hyperalgesia was also robustly produced by S. pyogenes M1 and M3 in a similar time course as mechanical hyperalgesia (Figure 1E). Because mechanical and heat sensitivity returned towards baseline at 48 h after infection (Figure 1D–1E), we determined if this transition was correlated with neural damage. At 48 h and 72 h post-infection, we did not detect significant changes in the proportions of TRPV1+, CGRP+, or NF200+ cell bodies in the L4–L6 dorsal root ganglia (DRG) (Figure S1F). However, we detected loss of sensory nerve fibers innervating the footpad in mice infected with M1 S. pyogenes at 72 h. At the center of infected lesions, there was complete loss of CGRP+ and PGP9.5+ nerves, with some intact nerves at lesion borders, whereas nerves remained unaffected in areas remote from the lesion (Figure S1G). Thus, S. pyogenes infection induces significant spontaneous pain and hyperalgesia at early time points, as well as subsequent local loss of sensory nerves.
We next determined whether inflammatory mediators or immune cells drove the early intense hyperalgesia during S. pyogenes infection. Ibuprofen, which blocks cyclooxygenase mediated prostaglandin synthesis, had no effect on mechanical or heat hyperalgesia (Figure S2A). We next found that mice deficient in caspase-1 (Casp1−/−), which mediates IL-1β production, or mice deficient in myeloid derived factor 88 (Myd88−/−), which mediates toll-like receptor and IL-1R signaling, developed hyperalgesia similar to wild-type mice following S. pyogenes infection (Figure S2A). Neither depletion of neutrophils (Gr1 antibody treatment), nor deficiency in recombination activating gene 2 (Rag2−/−), which mediates T and B cell development, altered the development of hyperalgesia after infection (Figure S2A). These data, together with the observation that S. pyogenes induces pain within minutes, suggest that bacteria may directly interact with neurons independent of the immune response.
S. pyogenes directly activates nociceptor neurons through SLS
We next determined whether S. pyogenes could directly act on sensory neurons to produce pain. Live M3 S. pyogenes induced robust calcium influx in DRG neurons in vitro within minutes of application (Figure 1F). Bacteria-responsive neurons also frequently responded to capsaicin, a ligand for TRPV1, a heat-sensitive ion channel expressed by many nociceptors. At lower bacterial concentrations (5×10⁸–5×10⁹ cfu/mL), more capsaicin-responsive (Cap+) neurons were activated by S. pyogenes than capsaicin-unresponsive (Cap−) neurons. At 5×10¹⁰ cfu/mL, the majority of DRG neurons were activated (Figure 1F). Bacteria-free filtered supernatant from M1 S. pyogenes cultures also induced calcium influx in DRG neurons in a dose-dependent manner (Figure 2A). Similar to responses to live bacteria, Cap+ nociceptors were more responsive to supernatants from lower density bacterial cultures than were Cap− neurons (Figure 2A). We observed that DRG neurons with smaller cell body areas were more sensitive to activation by bacterial supernatant than larger-sized neurons (Figure S2B).
Figure 2. S. pyogenes induces neuronal activation and CGRP release through SLS.

(A) Representative Fura-2 ratiometric fields (left) and calcium traces (center) of DRG neurons responding to filtered supernatant from S. pyogenes M1 (5×10⁹ cfu/mL), capsaicin (1 µm), and KCl (40 mM). Proportions (Right) of capsaicin non-responsive (Cap−) and capsaicin responsive (Cap+) neurons that responded to M1 supernatant (n=3–4 fields/condition). (B–D) Representative Fura-2 ratiometric fields (B) and calcium traces (C) of DRG neurons stimulated with filtered supernatant from S. pyogenes M1 (wt) or isogenic mutants lacking SLS (ΔsagA), both SLO and SLS (ΔsloΔsagA), or double mutant bacteria in which sagA expression was restored (ΔsloΔsagA+pDL:sagA). (D) Proportions of responding DRG neurons to bacterial supernatant from S. pyogenes M1 (wt) or isogenic mutant strains (n=3 fields/condition). (E) DRG neurons stimulated for 30 min with supernatant from S. pyogenes M1 (wt), isogenic mutants, or medium, analyzed for in vitro release of CGRP (n=5 samples/group). Statistical analysis: (A) Two-way ANOVA, Bonferroni post-tests. (D,E) One-way ANOVA, Tukey post-tests. *p<0.05 ***p<0.001 ****p<0.0001. ns=not significant. Scale bars, 50 µm. Mean±SEM. See Figure S2 for related data.
We hypothesized that S. pyogenes pore-forming toxins (PFT) could be molecular candidates for mediators of neuronal activation, due to their capacity to induce cation influx in mammalian cells (Bentley et al., 2005). S. pyogenes produces two PFTs, streptolysin O (SLO) and SLS. We generated M1 and M3 isogenic mutant strains that lacked expression of SLO (Δslo), SLS (ΔsagA), or both toxins (ΔsloΔsagA). Supernatant from bacteria deficient in SLS (ΔsagA and ΔsloΔsagA) did not induce calcium influx in DRG neurons (Figure 2B–2D). Plasmid complementation of SLS (pDL:sagA) into SLS mutant bacteria (ΔsagA+pDL:saga and ΔsagAΔslo+pDL:sagA) restored the ability of S. pyogenes to activate neurons at similar levels as wt bacteria (Figure 2B–2D). SLS (sagA) was required for S. pyogenes mediated neuronal activation at both low and high bacterial concentrations for Cap− and Cap+ cellular subsets (Figures 2D, S2C–S2D). We also found that S. pyogenes mediated release of the neuropeptide CGRP by DRG neurons in a SLS-dependent manner (Figure 2E). LDH release assays showed that this neuropeptide release was unrelated to cell lysis (Figure S3A). SLO activity was intact in wt and sagA mutant strains, indicating these effects were specific to SLS (Figure S3B).
SLS is critical for S. pyogenes-induced pain and pathogenesis
To determine the role of SLS in pain in vivo, mice were infected with wt or mutant S. pyogenes strains. Spontaneous lifting/licking pain behaviors were abrogated in mice infected with SLS-deficient bacteria (ΔsagA and ΔsloΔsagA) on both M1 and M3 S. pyogenes strain backgrounds, but not in mice infected with bacteria deficient in SLO alone (Δslo) (Figure 3A). Spontaneous flinches were abrogated in mice infected with SLS deficient strains (Figure 3B). Paw swelling and bacterial load recovery after infection did not vary between wt and mutant strains post-infection at the 1 hour time point after analysis of spontaneous pain behaviors (Figure S3C–S3D).
Figure 3. SLS is necessary for pain during S. pyogenes infection.

(A,B) Spontaneous lifting/licking pain over 1 h after injection of vehicle, S. pyogenes M1 or M3 (5×10⁸ cfu) wt, ΔsagA, Δslo, or ΔsloΔsagA strains (M1, n=8/group; M3, n=12/group). (C,D) Mechanical (n=10/group) and heat (n=9–10/group) sensitivity after injection of S. pyogenes M3 wt or isogenic mutants (5×10⁷ cfu). (E) Spontaneous pain over 1 h in mice injected with S. pyogenes M1 (5×10⁸ cfu) and treated with anti-SLS or control IgG (n=4–5/group). (F) Spontaneous pain over 1 h after injection of S. pyogenes M1 (5×10⁸ cfu) wt or isogenic mutants complemented with plasmid encoding sagA (pDL:sagA) or empty plasmid (pDL278) (n=8/group). Statistical analysis: (A,B,E,F) One-way ANOVA, Tukey post-tests, **p<0.01 ***p<0.001 ****p<0.0001; (C,D) Two-way ANOVA, Bonferroni post-tests, ΔsagA vs wt *p<0.05 ***p<0.001 ****p<0.0001, ΔsloΔsagA vs wt ††††p<0.0001. ns=not significant. nd=not detected. Mean±SEM. See Figure S3 for related data.
We next found that mice infected with SLS mutants (ΔsagA or ΔsloΔsagA) did not develop mechanical hyperalgesia, while wt and Δslo strains induced significant mechanical hyperalgesia (Figure 3C). Heat hyperalgesia was not significantly altered by deficiencies in SLS or SLO (Figure 3D). We next determined whether antibody neutralization of SLS affected S. pyogenes-induced pain. Mice were treated with a polyclonal antibody against a synthetic peptide encoded by sagA (Dale et al., 2002). Anti-SLS, but not control IgG, blocked spontaneous pain behaviors following M3 S. pyogenes infection (Figures 3E, S3E). Plasmid complementation with a functional copy of sagA (pDL:sagA) fully restored spontaneous pain reflexes induced by mutant SLS strains (Figure 3F).
To investigate the role of SLS in mediating S. pyogenes pathogenesis during soft tissue infection, we initiated infection by subcutaneous injection of M1 S. pyogenes (5×10⁶ cfu) into the flank, a model that allows serial measurement of skin lesions over time (Ashbaugh et al., 1998). Dermonecrotic lesions appeared 1 day after injection of wt strain, peaked at day 9, and began to decrease after day 10, while mice infected with ΔsagA bacteria did not develop dermonecrotic lesions (Figure S4A). No bacteria were recovered at day 9 from mice infected with ΔsagA S. pyogenes (Figure S4B). Local abscesses resolved faster in mice infected with ΔsagA bacteria, and weight loss was also dependent on SLS (Figure S4C–S4D). Plasmid complementation of ΔsagA bacteria with pDL:sagA restored dermonecrosis, bacterial proliferation, abscess formation and weight loss to similar levels as wt bacteria (Figure S4A–S4D).
Ablation of nociceptor neurons improves host control of S. pyogenes invasion
Since nociceptor neurons responded directly to SLS, which was crucial for S. pyogenes pathogenesis, we investigated whether pain fibers played a role in the outcome of infection. We specifically ablated TRPV1 neurons by crossing Trpv1-Cre mice with diphtheria toxin A reporter (Dta) mice, which ablates TRPV1-lineage neurons. Heat and mechanical hyperalgesia induced by M1 S. pyogenes was eliminated in Trpv1-Cre/Dta mice compared to control littermates (Figure 4A–4B). Infection-induced spontaneous pain reflexes were also reduced in these mice (Figure S4E). Loss of TRPV1+ and CGRP+ DRG neurons was confirmed by immunostaining (Figure S4F).
Figure 4. TRPV1 neurons that mediate pain inhibit host defenses against S. pyogenes infection.

(A) Heat sensitivity measured in Trpv1-Cre/Dta mice and control littermates after S. pyogenes M1 injection (5×10⁷ cfu, n=7–8/group). (B) Mechanical sensitivity of ipsilateral (ipsi) and contralateral (contra) hind paws after S. pyogenes M1 injection (5×10⁷ cfu) in Trpv1-Cre/Dta and control littermates (n=5/group). (C) Heat sensitivity in RTX and vehicle-treated mice after S. pyogenes M1 injection (5×10⁷ cfu, n=5/group). (D) Mechanical sensitivity of ipsilateral and contralateral hind paws of RTX and vehicle-treated mice after S. pyogenes M1 injection (5×10⁷ cfu, n=5/group). (E–H) S. pyogenes M1 (5×10⁶ cfu) was injected subcutaneously into the flank of mice: (E) Representative pictures of flank lesions, and (F) Quantification of dermonecrosis and weight loss at different time points after S. pyogenes M1 injection in Trpv1-Cre/Dta or control littermates (n=14–16/group). (G) Representative pictures of flank lesions, and (H) Quantification of dermonecrosis and weight loss after S. pyogenes M1 injection in RTX or vehicle-treated mice (n=15/group). Statistical analysis: (A–H) two-way ANOVA, Bonferroni post-tests. *p<0.05 **p<0.01 ***p<0.001 ****p<0.0001. (B) Trpv1-Cre/Dta (ipsi) vs Control (ipsi). (D) RTX (ipsi) vs Veh (ipsi). Mean±SEM. See Figure S4 for related data.
We next found that Trpv1-Cre/Dta mice developed significantly smaller dermonecrotic lesions and faster weight recovery compared to controls following S. pyogenes flank infection (Figure 4E–4F). In a second approach to ablate nociceptors, we treated mice with resiniferatoxin (RTX), a high affinity TRPV1 agonist. RTX treatment abrogated spontaneous pain behaviors, mechanical and heat hyperalgesia induced by S. pyogenes infection (Figures 4C–4D, S4G), and led to loss of TRPV1+ and CGRP+ neurons (Figure S4H). RTX-treated mice developed significantly less dermonecrosis and regained body weight faster than vehicle-treated mice following infection (Figure 4G–4H). Skin abscess sizes in RTX-treated mice also resolved faster (Figure S5A). Histopathologic analysis of skin from RTX-treated mice revealed containment of the bacterial infection within a circumscribed abscess containing polymorphonuclear leukocytes, whereas vehicle-treated animals showed necrosis of the subcutaneous tissues with abundant bacteria and relatively few leukocytes (Figures 5A, S5B). Quantitative cultures confirmed log-fold reductions of S. pyogenes in lesions of RTX-treated mice compared to vehicle controls (Figure 5B). S. pyogenes was cultured from spleens of vehicle-treated mice on day 9, whereas spleens of RTX-treated mice did not yield detectable bacteria (Figure 5B). Spleen size increased during infection in vehicle-treated mice, but not in RTX-treated mice (Figure S5C).
Figure 5. Nociceptors suppress recruitment of neutrophils that mediate host protection against S. pyogenes infection.

(A) Histopathology of flank biopsies from vehicle or RTX-treated mice 3 days after injection of S. pyogenes M1 (5×10⁶ cfu). Scale bars, 50 µm. (B) Bacterial load recovery (log10 cfu) from flank lesions and spleens in RTX or vehicle-treated mice after S. pyogenes M1 injection (5×10⁶ cfu, n=4/group). (C–E) Flow cytometry of leukocyte recruitment in necrotizing lesions 1 day after S. pyogenes M1 injection (5×10⁶ cfu): (C) Representative FACS plots showing neutrophils (CD11b+Ly6G+ gates) in lesion samples. (D–E) Quantification of immune cell populations by flow cytometry in flank biopsies from infected Trpv1-Cre/Dta mice or control littermates (n=4/group), or from uninfected mice, infected vehicle-treated mice, or infected RTX-treated mice (n=4–5/group). (F–H) Measurement of CGRP release ex vivo from flank skin punch biopsies. (G) CGRP release from uninfected skin (0 h), 7 h, or 24 h after S. pyogenes M1 injection (5×10⁶ cfu) (n=3/group). (H) CGRP release from uninfected skin or 7 h after S. pyogenes M1 (5×10⁶ cfu) injection of Trpv1-Cre/Dta mice or control littermates, or Vehicle or RTX-treated mice (n=3/group). Statistical analysis: (B,D,E,H) Two-way ANOVA, Bonferroni post-tests. (G) One-way ANOVA, Tukey post-tests. *p<0.05 **p<0.01 ***p<0.001 ****p<0.0001. ns=not significant. nd=none detected. Mean±SEM. See Figure S5 for related data.
Neutrophils are essential for S. pyogenes clearance and prevention of bacterial dissemination (Hidalgo-Grass et al., 2006). FACS analysis of infected tissues indicated that more CD11b+Ly6G+ neutrophils were recruited in Trpv1-Cre/Dta mice compared to controls (Figure 5C–5D). We observed a similar increase in RTX-treated mice compared to vehicle-treated mice (Figure 5C, 5E). By contrast, we did not detect significant differences in Cd11b+Ly6G−Ly6Chi monocytes, CD11b+Ly6G−Ly6Clo monocytes, Cd11b+Ly6G−Ly6C− myeloid cells, or CD11b−Cd45+ leukocytes (Figure 5D–5E). The host protective effect of RTX-treatment was eliminated by GR1-mediated neutrophil ablation, causing mice to develop dermonecrotic lesions, abscesses, and weight loss similar to controls (Figure S5D–S5F).
TRPV1 neurons release CGRP into infected tissues
Given our observation that S. pyogenes induced CGRP release by cultured nociceptor neurons in vitro through SLS (Figure 2E), we next determined whether bacterial invasion also induced CGRP release at the infection site using an ex vivo organ culture of skin explants (Figure 5F). A significant increase in CGRP levels was observed from biopsies collected 7 h after S. pyogenes infection, returning to baseline levels at 24 h (Figure 5G). This CGRP release was TRPV1 neuron dependent, as Trpv1-Cre/Dta mice showed reduced CGRP release after S. pyogenes infection compared to littermate controls (Figure 5H), and RTX-treated mice showed lower CGRP release in infected tissues compared to vehicle-treated controls (Figure 5H).
BoNT/A dissociates pain perception from neural regulation of host defense
Botulinum neurotoxin A (BoNT/A) is a bacterial toxin that cleaves SNAP-25, a component of the SNARE complex required for neuronal vesicle release (Binz et al., 1994). We used two different protocols of BoNT/A treatment (subcutaneous vs. intrathecal) to dissociate the effects of peripheral neuropeptide release from central pain transmission, to understand the roles of each neuronal process in bacterial infection.
BoNT/A was first injected subcutaneously at the anticipated site of infection 6 days prior to the bacterial inoculum. BoNT/A local treatment dramatically prevented the development of dermonecrotic lesions caused by S. pyogenes infection (Figure 6A–6C), with significantly reduced abscess formation (Figure S6A) and body weight loss (Figure 6D). Local BoNT/A treatment had no effect on spontaneous pain and hyperalgesia during infection (Figure S6B–S6C).
Figure 6. Local vs. intrathecal BoNT/A injection dissociates pain perception from peripheral neuro-immune suppression.

(A–D) Subcutaneous administration of BoNT/A (25 pg/100 µL) or vehicle 6 days prior to S. pyogenes M1 injection in flank skin (5×10⁶ cfu). (B) Representative images of lesions (day 8), (C) Dermonecrosis size measurements, and (D) Weight loss over time after injection of S. pyogenes (n=5–10/group). (E–H) Intrathecal administration of BoNT/A or vehicle 1 day prior to S. pyogenes M1 injection in flank skin (5×10⁶ cfu). (F) Representative images of lesions (day 8), (G) Dermonecrosis size measurements, and (H) Weight loss over time after injection of S. pyogenes (n=6/group). (I) DRG neurons exposed to BoNT/A (25 pg/200 µL) or medium for 24 h were stimulated with S. pyogenes supernatant (5×10⁹ cfu/mL) for 30 min, and CGRP was measured in neuronal supernatant (n=5/group). (J) CGRP release from skin punch biopsies of mice treated intrathecally or locally with BoNT/A, 7 h after S. pyogenes M1 (5×10⁶ cfu) injection (n=3/group). Statistical analysis: (C,D,G,H) Two-way ANOVA, Bonferroni post-tests. (I,J) One-way ANOVA, Tukey post-tests. *p<0.05 **p<0.01 ***p<0.001 ****p<0.0001. ns=not significant. Mean±SEM. See Figure S6 for related data.
By contrast, intrathecal injection of BoNT/A (Figure 6E) efficiently blocked both spontaneous pain and hyperalgesia caused by S. pyogenes infection (Figure S6D–S6E), but had no effect on dermonecrotic lesions, abscess size, or body weight loss (Figures 6F–6H, S6F). BoNT/A inhibited S. pyogenes-induced CGRP release when applied to cultured DRG neurons (Figure 6I). While subcutaneous BoNT/A treatment inhibited infection-induced CGRP release, intrathecal BoNT/A treatment did not alter this CGRP release (Figure 6J). These results indicate that rather than central pain neurotransmission, peripheral neuropeptide release is likely a key modulator of host defense.
CGRP released by neurons inhibits neutrophil-mediated killing of bacteria
We next asked whether nociceptor neurons could affect the opsonophagocytic killing of S. pyogenes by mouse neutrophils. In the presence of cultured nociceptors, the killing of S. pyogenes by mouse neutrophils was significantly inhibited (Figure 7A). Pre-treatment of neurons with BoNT/A reversed the suppressive effect of DRG neurons on the capacity of neutrophils to kill S. pyogenes (Figure 7A). CGRP receptor antagonists CGRP8–37 and BIBN4096, when added to DRG neurons together with neutrophils, each prevented the suppressive effects of DRG neurons on neutrophil killing of S. pyogenes. BoNT/A, CGRP8–37, and BIBN4096 did not have direct effects on S. pyogenes growth or viability, indicated that they acted on neural-immune signaling (Figure S7A–S7B). We also observed that mouse CGRP inhibited murine neutrophil killing of S. pyogenes (Figure 7B), and human CGRP inhibited the killing of S. pyogenes by human whole blood (Figure 7C). CGRP inhibited the activity of the bactericidal enzyme myeloperoxidase (MPO) in neutrophil supernatants in a dose-dependent manner in the presence of S. pyogenes (Figure S7C).
Figure 7. BoNT/A and CGRP antagonism block neural modulation of immunity to treat bacterial invasion.

(A) DRG neurons were pretreated with BoNT/A for 24 h, or with CGRP antagonists (CGRP8–37 or BIBN4096) immediately before co-incubation with mouse neutrophils and S. pyogenes M1 for 1 h. Bacterial survival was measured as the multiplication factor of surviving colonies/starting inoculum (n=3–4 replicates/group). (B) Mouse neutrophils were incubated with S. pyogenes M1 in presence of CGRP or vehicle for 1 h, and bacterial survival measured (n=4/group). (C) Human whole blood was incubated with S. pyogenes M1 in presence of CGRP or vehicle for 3 h, and bacterial survival measured (n=3/group). (D) Representative images of lesions at day 8 (left) and dermonecrosis size (right) of mice treated 2 h after S. pyogenes M1 injection (5×10⁶ cfu) with vehicle, BoNT/A, or BIBN4096 (n=6–7/group). (E–G) Mice were treated subcutaneously with BoNT/A or vehicle at day 2 and day 9 following flank injection of S. pyogenes M1 (5×10⁶ cfu). Representative images show lesions before and after treatment (E). Dermonecrotic lesions (F) and abscess sizes (G) were measured over time (n=10/group). Blue dots show injection sites at day 2 and day 9. Arrows show BoNT/A treatments. Statistical analysis: (A–C) One-way ANOVA, Tukey post-tests. (D–G) Two-way ANOVA, Bonferroni post-tests. (A–C,F–G) *p<0.05 **p<0.01 ***p<0.01 ****p<0.0001. (D) BIBN4096 vs veh: *p<0.05 **p<0.01 ***p<0.001 ****p<0.0001, BoNT/A vs veh: †p<0.05 ††p<0.01 †††p<0.001 ††††p<0.0001. ns=not significant. Mean±SEM. See Figure S7 for related data.
BoNT/A injection and CGRP receptor antagonism treats infection
We next explored the therapeutic potential of BoNT/A treatment and CGRP receptor antagonism for S. pyogenes invasive infection. Local BoNT/A or systemic BIBN4096 treatments, when administrated 2 h after infection, were associated with increased bacterial clearance in the skin (Figure S7D), smaller dermonecrotic lesions (Figure 7D) and reduced abscesses compared to mice treated with vehicle alone (Figure S7E). BoNT/A or BIBN4096 increased the recruitment of neutrophils to the infected area compared to infected, untreated mice (Figure S7F).
We next determined if BoNT/A administration at later time points could treat infection. At the 48 h time point, when large lesions were evident, mice were injected with BoNT/A or vehicle at sites around the lesion (Figure 7E). These injections halted the progression of S. pyogenes invasion, leading to less dermonecrosis and a rapid decrease in abscess size (Figure 7F–7G). A second BoNT/A injection at day 9 post-infection did not appear to further accelerate resolution of dermonecrotic lesions or abscesses but may have a beneficial effect on weight recovery (Figure S7G).
DISCUSSION
The goals of the present investigation were to determine mechanisms of pain associated with S. pyogenes invasion and role of neurons in host defense. We found that pain during infection depended on bacterial production of the toxin SLS. SLS triggered neural release of CGRP into infected tissues, which inhibited neutrophil recruitment and bactericidal activity, facilitating S. pyogenes survival. These data indicate that S. pyogenes hijacks pain and neural modulation of immunity to drive bacterial invasion. Blocking neuro-immunological signaling using BoNT/A or a CGRP antagonist were identified as strategies to treat infections.
The molecular basis of pain in necrotizing fasciitis
“Pain out of proportion” to physical findings is a hallmark of necrotizing fasciitis. In a survey of clinical parameters, pain was the best predicting factor for distinguishing necrotizing fasciitis from cellulitis (Borschitz et al., 2015). Though pain correlates with disease severity, its underlying mechanisms were unknown. We find that SLS critically mediates pain in mouse models of S. pyogenes necrotizing fasciitis. This role was revealed using several strategies: 1) comparison of pain produced by wt and isogenic mutant strains lacking SLS (sagA) from two clinical isolates; 2) antibody-mediated neutralization of SLS; and 3) plasmid complementation of SLS in isogenic mutants to restore neuronal activation. SLS-mediated spontaneous pain reflexes in mice maybe analogous to stabbing, sporadic pain experienced by humans during infection. SLS-mediated mechanical hyperalgesia maybe analogous to pressure-induced pain of infected tissues. SLS did not contribute to heat hyperalgesia, a pain modality that requires further investigation.
SLO and SLS are both implicated in S. pyogenes evasion of host defenses (Flaherty et al., 2015; Lin et al., 2009; Sierig et al., 2003). SLS is a small oxygen-stable, pore-forming peptide from the thiazole/oxazole-modified microcin family and member of a class of post-translationally modified virulence peptides that occur across several species of pathogenic bacteria (Nizet et al., 2000). SLO, by contrast, is a relatively large oxygen-labile toxin and member of cholesterol-dependent cytolysins (Tweten et al., 2015). We show that SLS, but not SLO, is responsible for the pain of necrotizing fasciitis. We also found that SLS showed more selectivity for TRPV1 neurons at lower bacterial concentrations but activated most DRG neurons at higher concentrations. A recent study showed that SLS activates Band3, an anion exchanger in erythrocytes (Higashi et al, 2015). We do not find Band3 in sensory neurons in transcriptional datasets (Chiu et al, 2014). Thus, the basis of SLS selectivity for TRPV1 neurons remain unclear.
S. pyogenes infection induced significant nerve loss within the lesion site but not the loss of DRG cell bodies. This finding may relate to necrotizing fasciitis, where intense early pain transitions to local loss of sensation at later time points (Buchanan and Haserick, 1970; Wilson and Haltalin, 1973). The degree of pain and nerve loss is likely a balance between SLS activity and membrane repair. Host cells activate membrane repair processes like microvesicle shedding and lysosomal fusion in response to streptolysins and other PFTs (Romero et al, 2017). Given that SLS is a highly damaging molecule, it may be evolutionarily beneficial for nociceptors to detect SLS and produce pain. Alternatively, S. pyogenes could selectively target nociceptors to suppress immunity for its advantage.
Nociceptor neurons suppress immunity and bacterial killing
Neuro-immune interactions at barrier surfaces play a major role in tissue inflammation (Veiga-Fernandes and Mucida, 2016). In the skin, crosstalk between sensory neurons, keratinocytes and immune cells mediate itch in atopic and contact dermatitis (Oetjen et al., 2017; Wilson et al., 2013a, b; Liu et al., 2013). Nociceptors mediate dermal dendritic cell activation in host defense against C. albicans (Kashem et al., 2015), and in a mouse model of psoriasis (Gilbert and Ward, 2014; Riol-Blanco et al., 2014). Lung-innervating sensory neurons modulate innate lymphoid cells and T cells to drive allergic airway inflammation (Caceres et al., 2009; Talbot et al., 2015). In the gut, enteroendocrine cells sense bacterial metabolites and signal to sensory neurons (Bellono et al., 2017). Gut-intrinsic enteric neurons and extrinsic sympathetic neurons also crosstalk with muscularis macrophages to regulate gut motility and macrophage tissue-specific programming (Muller et al, 2014; Gabanyi et al., 2016).
Here, we find that nociceptors suppress neutrophil recruitment and function to drive the progression of S. pyogenes invasive infection. Neutrophils are the most abundant leukocytes in the blood where they remain in a mature state, poised to migrate towards tissues to control pathogen spread. S. pyogenes virulence relies on its capacity to inhibit or resist neutrophils (Okumura and Nizet, 2014). The extent of neutrophil infiltration during human necrotizing fasciitis is variable. A study of biopsies from patients with S. pyogenes soft tissue infections showed positive correlation between bacterial load and neutrophil density (Thulin et al., 2006), but surgical exploration in necrotizing fasciitis sometimes revealed thin grayish “dishwater” fluid with few neutrophils despite the presence of large numbers of bacteria (Stevens and Bryant, 2017). S. pyogenes produces the proteases ScpC (or SpyCEP) and ScpA to cleave chemotactic factors that mediate neutrophil recruitment, such as CXCL8/IL-8 and C5a. S. pyogenes strains lacking expression of these proteases have profoundly attenuated virulence due increased neutrophilic influx (Ji et al., 1996; Kurupati et al., 2010). SLO also silences neutrophil function by damaging phagolysosomal membranes and inducing cell death (Sierig et al., 2003). Our observation that SLS drives pain and neuromodulation of neutrophil killing implies a functional synergism between these toxins in defeating neutrophil function.
Neural suppression of immunity during bacterial invasion may seem counterproductive for host defense. As pain accompanies inflammation, it is possible that neuromodulation of immunity evolved as a feedback mechanism to limit injury from excessive inflammation. In the case of S. pyogenes infection, SLS hijacks this neuroimmune communication by stimulating neuropeptide release and consequently blocking host defense.
A potential strategy to treat S. pyogenes invasion and necrotizing fasciitis
Necrotizing fasciitis is a life-threatening condition in which treatment with surgical debridement, antibiotic therapy, and intensive supportive care have only limited efficacy, and mortality remains unacceptably high. Our work identifies three approaches as potential therapies: 1) Neutralizing SLS with a specific antibody, 2) BoNT/A to inhibit CGRP release, and 3) BIBN4096 to inhibit CGRP receptor signaling. BoNT/A is currently used in cosmetic dermatology and treatment of migraine (Grando and Zachary, 2017). Neutralizing anti-CGRP antibodies and CGRP receptor antagonists are also being developed for migraine (Petersen et al., 2005; Tso and Goadsby, 2017).
BoNT/A has been shown previously to act on nociceptors to block pain transmission (reviewed in Matak and Lacković, 2014). We now find that BoNT/A can also block neuronal suppression of the local immune response, unrelated to pain perception. It is important to note that BoNT/A could also act on other cell-types including skin-innervating cholinergic and sympathetic neurons (Grando and Zachary, 2017), that may in turn modulate immune function (Chavan et al., 2017). BoNT/A may also target epithelial cells and skin immune cells (Grando and Zachary, 2017).
CGRP could similarly mediate functions in S. pyogenes infection beyond suppression of neutrophil function. In the skin, the CGRP receptor complex (Ramp1/Calcrl) is expressed by vascular endothelial cells, smooth muscle cells, keratinocytes, fibroblasts, and some immune cells (Granstein et al., 2015; Pinho-Ribeiro et al., 2017). CGRP acts on vascular cells to induce vasodilation, mediates keratinocyte proliferation to accelerate wound healing, and modulates Langerhans cells and dermal dendritic cells to polarize Th2 responses. It remains to be determined whether these other cell-types contribute to neural suppression of host defense.
We found that BoNT/A injections after the development of dermonecrosis blunted the progression of S. pyogenes invasion in mice. There are important differences in S. pyogenes pathogenesis between mouse and human (Olsen and Musser, 2010), as humans are the only natural hosts of S. pyogenes. Despite this limitation, mouse models of soft tissue infection have been utilized to demonstrate the role of major virulence determinants such as surface M protein and the hyaluronic acid capsular polysaccharide (Ashbaugh et al, 1998; Schrager et al., 1996). Of particular relevance to our work, soft tissue infection models in mice support a role in virulence for SLS (Betschel et al., 1998; Datta et al., 2005). SLS also mediates infection of human oropharyngeal keratinocytes and macrophages (Bastiat-Sempe et al., 2014; O’Seaghdha and Wessels, 2013). Future studies beyond murine models are needed to investigate the translational potential of our findings in enhancing host immunity against bacterial invasion.
In conclusion, neurons and their signaling to the immune system have a major impact on the outcome of bacterial soft tissue infection. BoNT/A and CGRP antagonists may be repurposed for treatment of infections due to S. pyogenes and perhaps other bacterial pathogens. Targeting the peripheral nervous system could provide therapeutic approaches in invasive infections including necrotizing fasciitis.
STAR METHODS
CONTACT FOR REAGENT AND RESOURCE SHARING
All unique reagents and resources will be made readily available upon request to the Lead Contact, Dr. Isaac Chiu (isaac_chiu@hms.harvard.edu).
EXPERIMENTAL MODEL AND SUBJECT DETAIL
Human blood donors
Blood samples were collected by a trained phlebotomist from three healthy adult volunteers of either sex at Boston Children’s Hospital with approval from the hospital’s Institutional Review Board (protocol X04-01-008). Written informed consent was obtained from all volunteers. No further demographic data was collected from the volunteers. Blood collected was from a single donor per experiment and was not pooled.
Animals
All animal experiments were approved by the Institutional Animal Care and Use Committee (IACUC) at Harvard Medical School and were conducted in accordance with National Institutes of Health (NIH) animal research guidelines. C57BL6/J, B6(Cg)-Rag2tm1.1Cgn/J, B6N.129S2-Casp1tm1Flv/J, B6.129P2(SJL)-Myd88tm1.1Defr/J, B6.129-Trpv1tm1(cre)Bbm/J, B6.129P2-Gt(ROSA)26Sortm1(DTA)Lky/J, and B6.129X1-Trpv1tm1Jul/J mice were purchased from Jackson Laboratories (Bar Harbor, ME). Mice were bred and housed in individually ventilated micro isolator cages within a full barrier, specific pathogen-free animal facility at Harvard Medical School under a 12 h light/dark cycle with ad libitum access to food and water. B6.129-Trpv1tm1(cre)Bbm/J heterozygous (+/−) mice were bred with B6.129P2-Gt(ROSA)26Sortm1(DTA)Lky/J homozygous (+/+) mice to generate nociceptor-ablated Trpv1-Cre/Dta (Trpv1-Cre+/−/Dta+/−) mice and control littermates (Trpv1-Cre−/−/Dta+/−). Both male and female age-matched mice from 6 to 14 weeks of age were used for all experiments in this study. Male and female mice were similarly susceptible to Streptococcus pyogenes infection. Individual animal health status was routinely monitored by Harvard Center for Comparative Medicine veterinary staff. Additionally, one cage containing two sentinel animals was maintained on each rack. These sentinel cages were supplied with pooled samples of soiled bedding from regular colony animals at every cage change. All cage changes were performed in Class II biosafety change stations. Animal sentinels were tested quarterly for pinworms, fur mites, Sendai virus, Pneumonia virus of mice, Mouse hepatitis virus, GD-7 virus, Minute virus of mice, Mycoplasma pulmonis, Mouse parvovirus, Epizootic diarrhea of infant mice, Reo-3 virus, and annually for ectromelia virus and lymphocytic choriomeningitis virus. Only healthy animals were used for experiments. Euthanasia was performed by CO2 inhalation.
Bacterial strains and culture
All procedures related to bacterial strains and infectious disease work were approved by the Committee on Microbiological Safety (COMS) at Harvard medical school and were conducted under Biosafety Level 2 protocols and guidelines. All Streptococcus pyogenes strains used in this study are listed in the Key Resources Table. S. pyogenes 854 M-type 1 was originally isolated from a patient with retroperitoneal abscess (Gryllos et al, 2008). S. pyogenes 950771 M3 serotype strain is a clinical isolate obtained from a patient with necrotizing fasciitis and sepsis (Ashbaugh et al, 1998). These founder bacterial strains were mutated to generate isogenic mutant strains (see Methods Details). Bacteria were grown on Tryptic Soy Agar (TSA) plates supplemented with 5% Sheep Blood (BD Biosciences, Cat# 221239), or grown in liquid culture in Todd-Hewitt Broth (Sigma, Cat# T1438) supplemented with 0.2% yeast extract (Sigma, Cat# Y1625) (THY broth) at 37°C with 5% CO2. When required, THY broth was supplemented with spectinomycin (50 µg/mL, Sigma, Cat# S4014). For storage, bacterial glycerol frozen stocks (20% glycerol, Sigma, Cat# G5516) of S. pyogenes strains were prepared and kept at −80°C until use.
Primary cells culture
Murine DRG neurons were obtained from healthy naïve animals as described in Dorsal root ganglia neuron dissection and culture. Mouse neutrophils were isolated from mouse bone marrow as described in Neutrophil isolation and killing assays.
DRG neurons were maintained under sterile conditions in a humidified incubator at 37°C and 5% CO2. For calcium imaging experiments, DRG neurons were incubated for 12–24h in 35 mm laminin (20 µg/mL, Thermo Fisher, Cat# 23017015)-coated sterile cell culture dishes (VWR International, Cat# 10062-888) containing 2 mL of neurobasal-A medium (Thermo Fisher, Cat# 21103049), B-27 supplement (Thermo Fisher, Cat# 1704044), penicillin/streptomycin (100 units/mL and 100 µg/mL, Thermo Fisher, Cat# 15140122), L-glutamine (2 mM, Thermo Fisher, Cat# 25030081) and mouse NGF (50 ng/mL, Thermo Fisher, Cat# 50385MNAC50).
For the experiments involving in vitro CGRP release assays by neurons, or co-incubation of DRG neurons with neutrophils, DRG neurons were first incubated for one week in laminin (20 µg/mL, Thermo Fisher, Cat# 23017015)-coated sterile flat bottom 96-wells plates (Thermo Fisher, Cat# 08-772-53) containing 200 µL of neurobasal-A medium (Thermo Fisher, Cat# 21103049), B-27 supplement (Thermo Fisher, Cat# 1704044), penicillin/streptomycin (100 units/mL and 100 µg/mL, Thermo Fisher, Cat# 15140122), L-glutamine (2 mM, Thermo Fisher, Cat# 25030081), mouse NGF (50 ng/mL, Thermo Fisher, Cat# 50385MNAC50), and cytosine arabinoside (10 µM, Sigma, Cat# C6645). Half of the medium was replaced with fresh media every two days. At day 7, neurons were stimulated for CGRP assays or co-cultured with neutrophils for experiments as described in Neuronal stimulation and CGRP release and in Neutrophil isolation and killing assays sections.
Skin biopsies
Skin punch biopsies were collected as described in the section “CGRP release assay from skin explants” from the flank area injected with vehicle or bacteria. Samples were collected under sterile conditions, rapidly transferred to sterile 24-well cell culture plates (Genesee Scientific, Cat# 25-107) containing 1 mL of DMEM (Thermo Fisher, Cat# 11995073) at 32°C and immediately used for experiments.
METHOD DETAILS
Generation of isogenic mutant S. pyogenes strains
The slo-negative derivatives of the S. pyogenes 854 and 950771 were generated by allelic exchange as described previously (Love et al., 2012; Bricker et al., 2002). Genomic DNA for use as a PCR template was prepared from an overnight culture of S. pyogenes as follows: Cells from a 10 mL overnight culture were harvested by centrifugation at 10,000 rpm and resuspended in 1 mL of STE buffer (100 mM NaCl, 10 mM EDTA, 10 mM Tris, pH 8.0) containing mutanolysin (50 µg, Sigma). This suspension was incubated at 37°C with agitation for 2 h at which point DNase-free RNase (10 µg; Sigma) and N-Lauroylsarcosine (0.5% (v/v), Sigma) were added. After a further 10 min incubation at 37°C, pronase was added (10 mg, Sigma) and the mixture was incubated at 37°C for a further 10 min. S. pyogenes genomic DNA was precipitated by mixing with an equal volume of phenol:chloroform (1:1), followed by centrifugation at 12,000 rpm. The pellet was washed with ice-cold ethanol and then washed and dissolved in TE buffer (10 mM Tris, pH 8.0, 1 mM EDTA). For PCR, 1 µL of genomic DNA template in a 50 µL PCR reaction mixture was used. PCR products corresponding to the 5' and 3' ends of slo were produced using the primer pairs 5′-CCCTCTAGAGGTAACCTTGTTACTGCTAATGC-3' and 5′-CCCGGATCCCAGTGACAGAGTCAATGATGG-3' (441 bp product) and 5′-CCCGAATTCGCGGGTGTCAATAACAGAACTG-3' and 5′-CCCGGTACCCCATATGGGCTCAGGGTTGATC-3' (367 bp product), respectively. All PCR reactions were performed using Phusion High-Fidelity PCR Master Mix (New England Biolabs). The products were directionally cloned into the temperature-sensitive shuttle vector pJRS233 (provided by June Scott) (Perez-Casal et al., 1993) using unique XbaI, BamHI, EcoRI and Asp718 restriction endonuclease sites (underlined) incorporated into the PCR primers. The final construct representing the slo sequence with an 818 bp internal deletion was cloned into pJRS233 at the XbaI and Asp718 sites. The resultant plasmid, pJsloΔ was verified by DNA sequencing (Genewiz) using the primers pJRSseqF (5'-GGGATGTGCTGCAAGGCG-3') and pJRSseqR (5'-ACGACAGGTTTCCCGACTG-3'), which recognize regions outside the 5' and 3' termini of the pJRS233 multiple cloning site.
The pJsloΔ plasmid was introduced into competent E. coli DH5α cells (New England Biolabs) by transformation according to the manufacturer’s instructions. This plasmid was purified using the Plasmid midi- or maxi-prep kits (Qiagen) and transformed into electrocompetent S. pyogenes cells. Plasmid integration followed by allelic exchange was allowed to occur at the permissive temperature (Perez-Casal et al., 1993). Mutants were verified by PCR of the slo gene using the first and forth primers listed above and Phusion® High-Fidelity PCR Master Mix (New England Biolabs).
SLS was inactivated in S. pyogenes 854 and 950771 by deletion of sagA (Sierig et al., 2003). DNA fragments corresponding to regions at the 5' (359 bp) and 3' (392 bp) termini of sagA were generated using the primer pairs 5′-CGCGGATCCCACATAGTTATTGATAGAAT-3' and 5′-TCCAGGAGCAACTTGAGTTG-3' (5') and 5′-CAACTCAAGTTGCTCCTGGACAAGGTGGTAGCGGAAGTTA-3' and 5′-GCGAAGCTTGTAATCCGATAAGGACAAGT-3' (3'). These fragments have overlapping ends at the 3' and 5' ends, respectively to permit a subsequent overlap PCR, using the first and fourth primers listed above. The resultant PCR product harbored an internal 60-bp deletion in sagA. This product was directionally cloned into pJRS233 using the unique BamHI and HindIII restriction endonuclease sites included in the PCR primers (underlined), to generate pJsagAΔ in E. coli strain DH5α. Plasmid pJsagAΔ was purified and used to generate 950771ΔsagA and 854ΔsagA as described above for Δslo. Mutants were identified by their lack of beta hemolysis on blood agar and verified by PCR analysis of the sagA locus. To generate ΔsloΔsagA mutants, pJsagAΔ was introduced to 950771Δslo or 854Δslo by allelic replacement as described above.
For complementation studies, the sagA gene including a 780 bp promoter region upstream (Nizet et al., 2000) was cloned using the primer pair 5'-CCGGAATTCGGCCCAAGAACGGAGTGTAT-3' and 5'-GGAGCATGCTTATTTACCTGGCGTATAACTTCCG-3'. This product was directionally cloned using EcoRI and SphI (underlined in primer sequence) into pDL278, to generate pSagA. Plasmid pSagA was purified and introduced into ΔsagA and ΔsloΔsagA backgrounds by electroporation and maintained by selection using spectinomycin (Sigma). Positive transformants were verified by PCR and their restoration of beta hemolysis on blood agar medium.
Streptolysin O activity
SLO activity was measured by determination of hemolytic titers of bacterial supernatants of S. pyogenes taken at early stationary phase. Supernatants were filtered through a 0.45 mm membrane, Dithiothreitol added at 6 mM and incubated at 37°C for 30 min. Sheep erythrocytes was prepared by diluting fresh defibrinated sheep blood (Northeast Lab Services) in PBS and the suspension was added to each bacterial culture sample. After 30 min incubation at 37°C, cell mixtures were centrifuged, and absorbance measured at 550 nm. Hemolytic units correspond to the reciprocal of the dilution of supernatant that yielded 50% lysis, where 100% lysis corresponds to that caused by 1% Triton X-100. Hemolytic activities were also determined after pre-treatment of samples with the SLO inhibitor, cholesterol (cholesterol–methyl-β-cyclodextrin, Sigma) at a concentration of 250 µg/mL (estimated cholesterol concentration, 10 µg/mL).
General experimental design
All in vivo experiments were performed in both male and female age-matched littermates. Pain behavioral tests were performed by blinded observers that were unaware of treatment groups and genotypes. Treatment groups of mice were randomized and evenly distributed across both male and female littermates in cages. Treatments were performed by blinded investigators unaware of the contents of syringes or other administration devices. In experiments involving transgenic mice, littermates with different genotypes were cohoused for the duration of experiments. Quantification and analysis of microscopy images were performed by a blinded investigator unaware of groups and genotypes.
Animal numbers for pain behavioral analysis and infection outcome measurements were estimated based on pilot studies of S. pyogenes infections in our lab and based on standard numbers used in the field based on publications on pain and bacterial infection work. For pain behavioral tests, we used at least 4 mice per group. For lesion size and pain behavioral experiments, mice that did not survive the entire time-course of analysis were excluded from analysis. For bacterial infections and analysis (demornecrotic lesion size, abscess size, and weight loss following infection), we used at least 5 mice per group. For histology, bacterial load recovery analysis, flow cytometry, ex vivo, and in vitro experiments, we used at least 3 biological replicates per group. All statistical analysis was performed using Graphpad Prism (v. 7.02). For specific numbers of replicates used for each experiment, please see the section Quantification and Stastitical Analysis.
Bacterial infections
S. pyogenes strains were grown overnight on TSA plates supplemented with 5% Sheep Blood (BD Biosciences, Cat# 221239) at 37°C with 5% CO2. The next morning, bacterial colonies were picked and inoculated into THY broth (Todd-Hewitt Broth, Sigma, Cat# T1438, with 0.2% yeast extract, Sigma, Cat# Y1625), incubated for 3 h at 37°C without shaking until growth reached mid-exponential phase, and resuspended in fresh medium to A600nm of 0.6. Bacterial cells were collected by centrifugation at 800g for 15 min, washed once in PBS, and then resuspended in PBS at different estimated concentrations for injection. Before injection of bacteria, mice were lightly anesthetized by inhalation of isoflurane (Patterson Veterinary) 3% in oxygen using a precision vaporizer. For hind paw infections, a single dose of 5×10⁵ – 5×10⁸ cfu of S. pyogenes in 20 µL PBS was administered by intraplantar injection of the right hind paw using a 0.5 cc syringe fitted with a 31-gauge needle (BD Biosciences). For flank infections, 5×10⁶ cfu of S. pyogenes in 50 µL PBS was injected subcutaneously into the flank previously shaved using a hair clipper (Patterson Veterinary). In some cases, hair removal cream (Nair) was also applied for hair removal prior to infection. The bacterial suspension was kept on ice until use, and the inoculum was confirmed by quantitative culture of an aliquot of the final suspension prior to injection. Injections of bacteria or vehicle were performed by an investigator blinded to the content of syringes. Syringes were previously assigned to specific animals by an investigator aware of the groups in order to distribute groups across multiple cages.
Bacterial load recovery analysis
Mice were euthanized by CO2 inhalation and rapidly used for tissue dissection. During necropsy of mice, total hind paw tissues including epidermis, dermis, and subcutaneous tissue to the tendons, or flank tissue encompassing the injection site including epidermis, dermis, and subcutaneous tissue, or spleens were dissected and weighed. Tissues were then transferred to 2 mL eppendorf tubes containing 5 mm stainless steel beads (Qiagen, Cat# 69989) and 1 mL of ice-cold sterile distilled water. Tissues were homogenized using a TissueLyser II (Qiagen) for 10 min at 30 Hz. To determine bacterial load recovery, serial dilutions were made and plated on TSA plates with 5% Sheep Blood plates (BD Biosciences, Cat# 221239), and colonies were counted after overnight incubation at 37°C with 5% CO2.
Pain behavioral tests
Spontaneous pain behaviors were evaluated by quantifying the time that mice spent 1) lifting/licking the hind paw and 2) the number of paw flinches that occurred over a 1 h time period immediately after infection. Data was collected in 5-minute intervals. For mechanical and heat hyperalgesia tests, mice were allowed to habituate to the apparatus during 2 h and for three consecutive days before the beginning of measurements. After habituation, baseline measurements were obtained on two consecutive days prior to infection. Pain intensity to mechanical stimulus (mechanical hyperalgesia) was measured using von Frey monofilaments. Briefly, mice were placed on an elevated wire framework and a series of von Frey monofilaments with different pressure intensities (from 0.007g to 4g) were applied to the plantar surface of the infected hind paw. The threshold of pain was determined as the lowest pressure filament that induced a response (paw withdrawal) in five out of ten applications. To measure pain sensitivity to a heat stimulus (heat hyperalgesia), mice were placed on the temperature-controlled (29°C) glass plate of a Hargreaves apparatus (Model 390G, IITC Life Science). A radiant heat source (active intensity 23%) was used to stimulate the infected paw by gradually increasing the temperature of the plantar surface. The threshold of pain was determined as the latency (in seconds) to evoke a response of paw withdrawal. The mean of three measurements was determined for each animal at each time point. An exposure limit of 40 s was used to prevent tissue damage. Data from mice that did not survive until the end of the tests were not included in the analysis. Pain behavior tests were performed by blinded observers that were unaware of the treatments, groups, and genotypes.
Lesion size measurement
One day prior to subcutaneous injection with S. pyogenes, mice were lightly anesthetized by inhalation of isoflurane (Patterson Veterinary) 3% in oxygen using a precision vaporizer, and the flank area was shaved using a hair clipper. Abscess sizes and dermonecrotic skin lesions were measured daily with a digital caliper (VWR International, Cat# 62379-531) for 14 days after injection, and area calculated with the formula A=(π/2)(length)(width). Mice were also anesthetized with isoflurane 3% in oxygen during the measurements. Data from mice that did not survive until the end of the tests were not included in the analysis.
In vivo BoNT/A and BIBN4096 treatments
Botulinum neurotoxin A (BoNT/A, List Biological Labs, Cat# 130B) intrathecal or local subcutaneous pre-treatments were used that were able to distinguish the contribution of pain perception from peripheral neuropeptide release. Mice were subsequently infected with M1 S. pyogenes in the footpad for pain behavioral assays or in the flank for dermonecrotic lesion measurements. For intrathecal pre-treatments, BoNT/A (25 pg in 5 µL PBS) or vehicle (5 µL PBS) was injected at the level of L4–L6 segments of spinal cord 24 h before infection with S. pyogenes. For local pre-treatments, different groups of mice received a subcutaneous BoNT/A injection (25 pg in 5 µL PBS) or vehicle (5 µL PBS) in the footpad, or they received BoNT/A (25 pg in 100 µL PBS) or vehicle (100 µL PBS) in the for flank skin at the anticipated site of infection 6 days before infection. We also evaluated whether BoNT/A or CGRP antagonist (BIBN4096, Tocris, Cat# 4561) was able to treat S. pyogenes infection. For these experiments, mice were infected in the flank skin with S. pyogenes M1. 2 h after infection, we performed subcutaneous injection of BoNT/A (25 pg in 50 µL PBS) at the site of infection or intraperitoneal injection of CGRP receptor antagonist BIBN4096 (30 mg/kg). In another set of experiments to determine therapeutic potential, BoNT/A or vehicle was administered locally in mice infected with S. pyogenes at day 2 after flank skin infection, and again at day 9 after infection. For this experiment, BoNT/A (25 pg in 100 µL PBS) or vehicle (100 µL PBS) was distributed in 5 applications of 20 uL each around the borders of the lesion at day 2 and at day 9. The injection sites were marked using a blue marker at each day of injection. BoNT/A was administered using a Hamilton syringe (Hamilton Company, Cat# 7636-01) fitted with a 32 gauge needle (Hamilton Company, Cat# 7803-04). S. pyogenes M1 wt was used at the following doses for the experiments described above: 5×10⁶ cfu for flank infections and lesion size measurements, 5×10⁷ cfu for foot pad infections and hyperalgesia studies, and 5×10⁸ cfu for foot pad infections and spontaneous lifting/licking/flinching tests.
Histology
Mice were euthanized by CO2 inhalation and intracardially perfused with 30 mL of ice-cold PBS, followed by 30 mL of PBS/4% paraformaldehyde (PFA, Sigma, Cat# P6148). Infected hind paw and flank lesion samples were dissected, post-fixed for 12 h at 4°C in PBS/4% paraformaldehyde solution, embedded in paraffin, sectioned, and stained using hematoxylin and eosin (H&E) or Brown and Brenn Gram stains by the Harvard Medical School Rodent Histopathology Core. Stained sections were imaged by light microscopy on an Eclipse Ti-S/L100 inverted microscope (Nikon), and images collected by NIS-Elements AR software.
Immunostaining and microscopy
For immunofluorescence staining, hind paw skin tissues and dorsal root ganglion (DRG) tissues were dissected from mice previously euthanized by CO2 inhalation and intracardially perfused with 30 mL of PBS, followed by 30 mL of PBS/4% PFA (Sigma, Cat# P6148). Samples were post-fixed in PBS/4% PFA solution at 4°C for 12 h, cryoprotected in PBS/30% sucrose (Sigma, Cat# S0389) for 3 days at 4°C, embedded in Optimal Cutting Temperature (OCT, Sakura Finetek, Cat# 4583), and stored at −80°C until processing. Cryosections (20 µm for DRG, 40 µm for skin) were cut onto Superfrost Plus slides (Thermo Fisher) before immunostaining. Hind paw skin or DRG sections were stained with mouse or rabbit anti-beta III tubulin (Tuj1, Abcam, 1:500), rabbit anti-CGRP (Sigma, 1:10,000), mouse anti-NF200 (MilliporeSigma, 1:1000), mouse anti-PGP9.5 (Abcam, 1:500), or guinea pig anti-TRPV1 (MilliporeSigma, 1:1000), followed by Alexa 594 donkey anti-mouse IgG (Abcam, 1:500), DyLight 488 donkey anti-rabbit IgG (Abcam, 1:500) or goat anti-guinea pig IgG (Sigma, 1:500). Stained sections were mounted in Vectashield mounting medium (Vector Labs, Cat# H1000), with addition of DAPI (BioLegend, Cat# 422801) for skin samples. Fluorescence imaging was performed using a FV1000 laser-scanning confocal microscope (Olympus). Data were collected using Olympus Fluoview software. Samples were imaged with z-stacks of 1 µm steps and 20 µm (for DRG) or 40 µm (for skin) total thickness; maximum projection images were exported for analysis.
Quantification of DRG neurons
DRG samples were collected, sectioned, stained, and imaged as described in the section Immunostaining and microscopy. Maximum projection images (3 fields per sample) obtained for each channel were exported for analysis. The number of TRPV1, CGRP, or NF200 positive neurons, and the total number of neurons (βIII-tubulin positive) field were quantified by an investigator blinded for the groups. Percentage of TRPV1, CGRP, or NF200 positive neurons out of the total neurons (βIII-tubulin positive) was determined for each sample as the average of 3 fields.
RTX mediated ablation of nociceptor neurons
Resiniferatoxin (RTX, Sigma-Aldrich), a potent capsaicin analog, was used to deplete TRPV1-positive nociceptors. Male and female 4-week-old C57BL/6 mice were lightly anesthetized by inhalation of isoflurane (Patterson Veterinary) 3% in oxygen using a precision vaporizer. Three RTX escalating doses (30 µg/kg, 70 µg/kg, 100 µg/kg, diluted in PBS with 1.2% DMSO and 0.06% Tween-80) were subcutaneously injected over the flank of anesthetized mice on three consecutive days, as adapted from established protocols (Riol-Blanco et al., 2014). Control littermates were injected with vehicle solution on the same days (PBS with 1.2% DMSO and 0.06% Tween-80). Mice were used for infection experiments four weeks after the last injection of RTX. Vehicle and RTX treated mice were housed together before and during the experiments. Efficiency of RTX treatment in depleting TRPV1-positive nociceptors was confirmed by counting the number of TRPV1-positive neurons in the DRG by microscopy. DRG samples were collected, sectioned, and stained as described in the section Immunostaining and microscopy, and quantified as described in the section Quantification of DRG neurons.
Dorsal root ganglia neuron dissection and culture
Adult, 7 – 13 wk old male and female mice were euthanized by CO2 inhalation. Dorsal root ganglia (DRG) were dissected from all segments of the spinal cord and transferred to neurobasal medium (Thermo Fisher) supplemented with B-27 (Thermo Fisher) and penicillin/streptomycin (Thermo Fisher). DRGs were enzymatically dissociated by incubating in 2 mL of HEPES-buffered saline (Sigma) containing collagenase A (1 mg/kg, Sigma) and dispase II (2.4 U/mL, Roche Applied Sciences) for 20 min at 37°C. Supernatant was carefully removed, replaced with 2 mL of fresh collagenase A/dispase II solution and incubated for 20 min at 37°C again. Cells were transferred to a tube containing 10 mL of DMEM/10% FBS (Thermo Fisher), centrifuged for 1 min at 200g at 4°C, and resuspended in 800 µL of DMEM/10% FBS containing DNase I (150U/mL, Thermo Fisher). DRG cells were dissociated with fire-polished glass Pasteur pipettes (VWR International) with decreasing tip diameters to create single-cell suspensions. Cells were resuspended in 2 mL of neurobasal medium (Life Technologies), and then centrifuged (260g, 10 min) after overlaying on a 10% bovine serum albumin (BSA) gradient (diluted in Neurobasal medium from a 30% BSA solution in PBS, Sigma). Supernatant was removed and resulting pellet resuspended in neurobasal medium for plating. For calcium imaging, cells were plated onto 35 mm laminin-coated (Thermo Fisher) cell culture dishes (2,000 cells per dish) in neurobasal-A medium plus 50 ng/mL nerve growth factor (Thermo Fisher); DRG neurons were used for calcium imaging 12 – 24 h after plating. For co-incubation with neutrophils and CGRP release experiments, 5,000 DRG neurons were seeded per well in laminin-coated flat bottom 96-wells plates and incubated with neurobasal-A medium plus 50 ng/mL nerve growth factor (Thermo Fisher) and cytosine arabinoside (10 µM, Sigma) for one week; half of the medium was replaced with fresh media every two days.
Calcium imaging and data analysis
Cultured DRG neurons were washed and loaded with 5 µM Fura-2 AM (Thermo Fisher) in Neurobasal-A medium for 30 min at 37°C, then washed twice and imaged in Krebs-Ringer solution (Boston BioProducts). DRG neurons were imaged using an Eclipse Ti-S/L100 inverted microscope (Nikon) and Zyla sCMOS camera (Andor). An ultraviolet light source (Lambda XL lamp, Sutter Instrument) was used for excitation of Fura-2-AM by alternating 340 nm and 380 nm wavelengths. NIS-elements software (Nikon) was used to image, process and analyze 340/380 ratiometric images from neurons. An increase in 340/380 ratio of 10% or more from baseline levels was considered a positive response to a ligand. For calcium imaging experiments, cell size for individual DRG neurons (measured as area in µm2) was determined using NIS-elements software by marking individual cells using the Region of Interest tool in combination with the Automated Measurement tool (Nikon). The percentage of bacteria-responsive cells or bacteria-unresponsive cells from 3 separate neuronal fields/condition was determined and binned into four groups for analysis based on their cell body area (<149, 150–249, 250–349, and >350 µm2).
S. pyogenes supernatant for neuronal stimulation
S. pyogenes strains were grown overnight on TSA plates with 5% sheep blood (BD Biosciences) at 37°C in 5% CO2. Bacterial colonies were picked and inoculated into liquid cultures of THY broth, grown for 3 h at 37°C without shaking until mid-exponential phase, and bacterial density estimated by A600nm. Bacterial cells were collected by centrifugation, washed, and then resuspended (5×10⁸–5×10¹⁰ cfu per mL) in phenol red-free neurobasal-A medium plus 6% BSA (Sigma) and incubated at 37°C for 1 h, centrifuged for 15 min at 800g, and the supernatant filtered with a 20 µm cell strainer. For calcium imaging, DRG neurons were stimulated with 200 µL of the filtrate, representing bacterial supernatant. For CGRP release assay, 50 µL of bacterial supernatant was used.
Neuronal stimulation and CGRP release
DRG neurons (5,000 per well) were cultured for one week in Neurobasal-A medium containing 50 ng/mL nerve growth factor and cytosine arabinoside as described in the sections Dorsal root ganglia neuron dissection and culture. One group of neurons was treated with 25 pg (in 200 uL of Neurobasal-A medium) of Botulinum neurotoxin A (BoNT/A) for 24 h prior to neuronal stimulation. The neuronal culture medium was removed from all wells, and 200 µL of fresh neurobasal-A medium was added to the wells. Filtered supernatants from S. pyogenes M1 854 strain or isogenic mutant strains were collected at the day of the test as described in the section S. pyogenes supernatant for neuronal stimulation. Immediately before stimulation, 50 µL of cell culture supernatant was removed and 50 µL of bacterial supernatant or control medium (neurobasal-A medium + 6% BSA) was added to the wells. Cells were incubated for 30 min at 37°C and with 5% of CO2 and then 50 µL of supernatant were collected to determine CGRP concentration. A CGRP Enzyme Linked Immunosorbent kit (Cayman Chemical) was used to quantify CGRP according to manufacturer`s instructions.
Neutrophil isolation and killing assays
Following euthanasia, femurs and tibias were dissected from mice. Bone marrow cells were flushed out using PBS/1 mM EDTA (Sigma) in a syringe and a 21 gauge needle. Cells were then strained through a 100 µm cell strainer, centrifuged for 5 min at 300g, resuspended in 3 mL of red blood cell lysis buffer (eBioscience) and incubated for 15 min at room temperature. PBS (22 mL) was added and the cells were centrifuged for 5 min at 300g. Supernatant was removed, and the cells were resuspended in neurobasal-A medium (Thermo Fisher) with 10% fetal bovine serum (FBS) at a maximum concentration of 1×10⁸ cells/mL. Neutrophils were isolated using an immune magnetic negative selection kit according to manufacturer’s instructions (EasySep mouse neutrophil enrichment kit and EasySep Magnet, StemCell). Half of the final neutrophil suspension solution was saved to collect the supernatant. This supernatant was added to the conditions where neutrophils were absent (control conditions) instead of fresh media to control for effects of used cell media on bacterial growth.
For opsonophagocytic killing assays, mouse neutrophils were used immediately after isolation. S. pyogenes (5×10³ cfu) M1 wt strain was mixed with mouse neutrophils (5×10⁵ cells per well) in 200 µL of neurobasal-A medium containing 10% of fresh mouse serum. As described before, neutrophil filtered supernatant was added to the control conditions (without neutrophils). CGRP (1 µM, GenScript) or the antagonists CGRP8–37 (1 µM, GenScript) or BIBN4096 (1 µM, Tocris) were added to the cultures immediately before S. pyogenes. For neuron-neutrophil co-incubation experiments, neutrophils and bacteria were added to the plates containing 5×10³ DRG neurons and incubated under the same conditions. One group of DRG neurons was treated with 25 pg (200 µL) of BoNT/A 24 h before the assay. Some wells of neuron-neutrophil co-cultures were treated with the antagonists CGRP8–37 (1 µM, GenScript) or BIBN4096 (1 µM, Tocris) at the time of neutrophil addition.
For all conditions described for neutrophil opsonophagocytic killing assays, plates were incubated for 1h at 37°C with gently shaking (150 rpm). The amount of extracellular and intracellular bacteria was determined after resuspension in ice-cold ddH2O by serial dilution plating on TSA plates with sheep blood agar (BD Biosciences), and bacterial colonies were counted after overnight incubation at 37°C in 5% CO2. The multiplication factor of net bacterial growth was calculated as the number of cfu recovered/ number of cfu added to wells.
Neutrophil myeloperoxidase activity (MPO) assay
Mouse neutrophils were isolated from mouse bone marrow using EasySep mouse neutrophil enrichment kit and EasySep Magnet according to manufacturer’s instructions (StemCell). These neutrophils (5×10⁵ cells per well) were then treated with CGRP (0.01–1 µM, GenScript) or vehicle (PBS), immediately prior to mixture with S. pyogenes (5×10³ cfu) M1 wt strain or vehicle (PBS) in 200 µL of neurobasal-A medium containing 10% of fresh mouse serum. Serum was obtained after coagulation of whole mouse blood. Plates were incubated for 30 min at 37°C with gently shaking (150 rpm), and supernatant collected for MPO activity measurements. Supernatants (50 µL) were added to 200 µL of 50 mM phosphate buffer solution (pH 6.0) containing 0.167 mg/mL of peroxidase substrate o-dianisidine dihydrochloride (Santa Cruz Biotech) and 0.05% hydrogen peroxide (Santa Cruz Biotech) and incubated for 30 min at room temperature. MPO activity was determined spectrophotometrically by measuring the increase in absorbance at 450 nm.
Lancefield assay
Human blood phagocytosis assays (Lancefield bactericidal test) were performed as described previously with slight modifications (Gryllos et al., 2008). S. pyogenes M1 wt strain was cultured to OD600 of 0.15 in L3 medium at 37°C with 5% CO2 and diluted in sterile PBS. Quantitative cultures of the bacterial suspension were performed to allow precise quantification of the starting inoculum. Whole human blood (10 mL/tube) was collected into heparin-containing tubes (BD Vacutainer™, Fisher Scientific) Approximately 20–200 S. pyogenes cfu were inoculated into heparinized whole blood obtained from three healthy donors supplemented with human CGRP (10 or 100 nM) and incubated for 3 h at 37°C with end-over-end rotation. Bacterial survival was quantified as multiplication factor of number of surviving colonies relative to the starting inoculum. Each condition was tested in triplicate.
CGRP release assay from skin explants
Skin punch biopsies (12 mm) were collected from the uninfected or infected flank skin samples of euthanized mice, and rapidly transferred to 24-well plates containing 1 mL of DMEM. Explants were incubated at 32°C with gentle shaking (150 rpm) for 30 min. After incubation, the bath supernatant from the organ cultures was collected, and assayed to determine CGRP concentration with the CGRP EIA kit (Cayman Chemical) according to manufacturer`s instructions.
Flow cytometry
Flank tissue samples of dermonecrotic lesions were dissected 24 h after infection, minced and incubated for 2 h (37°C, shaking) in 2 mL of HEPES-buffered saline (Sigma) containing collagenase A (1 mg/kg, Roche Applied Sciences) and dispase II (2.4 U/mL, Roche Applied Sciences). After incubation, cells were gently dissociated using a 16G needle attached to a 10 mL sterile syringe, filtered through a 70 µm mesh, and mixed with 20 mL of washing buffer constituted by HBSS (Thermo Fisher) and 0.5% BSA (Sigma). Cells were centrifuged for 5 min at 300g, supernatant was discarded, and the pellet was resuspended in 500 µL of washing buffer. The cell suspension was incubated on ice with mouse FcR Blocking Reagent (Miltenyi Biotec) for 10 min, and then incubated for 30 min on ice with the following antibodies: anti-CD45-APC/Cy7 (1:200, Biolegend), anti-Ly6G-A488 (1:200, Biolegend), anti-Ly6C-PercP/Cy5.5 (1:200, Biolegend), anti-CD11b-BV605 (1:200, Biolegend), and Fixable Viability Dye eFluor-506 (1:1,200, Thermo Fisher). Cells were centrifuged for 5 min at 300g and the pellet resuspended in 500 µL of washing buffer/2% PFA. Flow cytometry was performed on a LSR II flow cytometer (BD Biosciences). Flow cytometry data were collected and exported using BD FACSDiva software (BD Biosciences). FACS data were analyzed and plotted using FlowJo software (FlowJo LLC).
QUANTIFICATION AND STATISTICAL ANALYSIS
Statistical analysis was performed, and results plotted using Graphpad Prism version 7.02 software. Data were represented as means±standard error of the mean (SEM) throughout the figures. The types of statistical analysis performed were based on standards in the fields of pain analysis and bacterial infection. Statistical comparisons of two groups for a single variable with normal distributions were analyzed by unpaired t-test. Statistical comparisons of three or more groups at a single time point were analyzed by One-way ANOVA with Tukey post-tests. Statistical comparisons of two or more groups with two independent variables were analyzed with Two-way ANOVA with Bonferroni post-tests. Statistical analysis of changes in two or more groups compared at multiple time points were analyzed by Two-way Repeated Measures ANOVA with Bonferroni post-tests performed at each time point. Below, we supply the exact details about the numbers of biological replicates, and types of statistical analysis used for the experiments found in each figure of the manuscript:
For Figure 1. (C) 4 mice per group were used for infection with M1 strain, and 9–11 mice per group were used for infection with M3 strain. (D) 8–9 mice per group were used for infection with M1 strain, and 7–10 mice per group were used for infection with M3 strain. (E) 8–9 mice per group were used for infection with M1 strain, and 7–9 mice per group were used for infection with M3 strain. (F) 3–4 plates containing 2,000 DRG neurons were used for each condition. One field per plate was imaged with a 20× objective and used for analysis. DRG neurons were obtained from a single mouse, and equally distributed across the groups tested. Statistical analysis: (C) One-way ANOVA, Tukey post-tests. (D–E) Two-way ANOVA, Bonferroni post-tests. (F) Two-way ANOVA, Bonferroni post-tests. (C, F) *p<0.05 **p<0.01 ***p<0.001 ****p<0.0001. (D, E) veh vs 5×10⁷ cfu: ***p<0.001 ****p<0.0001, veh vs 5×10⁶ cfu: †p<0.05 ††p<0.01 †††p<0.001 ††††p<0.0001, veh vs 5×10⁵ cfu: §§p<0.01 §§§§p<0.0001.
For Figure 2. (A) 3–4 plates containing DRG neurons (2,000 cells per plate) from the same mouse were used for each condition. (C) 3 plates containing DRG neurons (2,000 cells per plate) from the same mouse were used for each condition. (D) 3 plates containing DRG neurons (2,000 cells per plate) from the same mouse were used for each condition. One field per plate was imaged with a 20× objective and used for analysis. (E) 5 wells containing DRG neurons (5,000 cells per well) were used for each condition. DRG neurons were obtained from 4 mice, pooled and equally distributed across the groups. Statistical analysis: (A) Two-way ANOVA, Bonferroni post-tests. (D, E) One-way ANOVA, Tukey post-tests. *p<0.05 ***p<0.001 ****p<0.0001.
For Figure 3. (A, B) 8 mice per group were used for infection with M1 strains, and 12 mice per group were used for infection with M3 strains. (C) 10 mice per group were used. (D) 9–10 mice per group were used. (E) 4–5 mice per group were used. (F) 8 mice per group were used. Statistical analysis: (A, B, E, F) One-way ANOVA, Tukey post-tests, **p<0.01 ***p<0.001 ****p<0.0001; (C, D) Two-way ANOVA, Bonferroni post-tests, ΔsagA vs wt *p<0.05 ***p<0.001 ****p<0.0001, ΔsloΔsagA vs wt ††††p<0.0001.
For Figure 4. (A) 7–8 mice per group were used. (B) 5 mice per group were used. (C, D) 5 mice per group were used. (F) 14–16 mice per group were used. (H) 15 mice per group were used. Statistical analysis: (A–H) two-way ANOVA, Bonferroni post-tests. *p<0.05 **p<0.01 ***p<0.001 ****p<0.0001. (B) Trpv1-Cre/Dta (ipsi) vs Control (ipsi). (D) RTX (ipsi) vs Veh (ipsi).
For Figure 5. (B, D) 4 mice per group were used. (E) 4–5 mice per group were used. (G, H) 3 mice per group were used. Statistical analysis: (B, D, E, H) Two-way ANOVA, Bonferroni post-tests. (G) One-way ANOVA, Tukey post-tests. *p<0.05 **p<0.01 ***p<0.001 ****p<0.0001.
For Figure 6. (C) 10 mice per group were used. (D) 5–6 mice per group were used. (G, H) 6 mice per group were used. (I) 5 wells containing DRG neurons (5,000 cells per well) were used for each condition. DRG neurons were obtained from 2 mice, pooled, and equally distributed across the groups. (J) 3 mice per group were used to obtain skin punch biopsies, one biopsy per mouse. Statistical analysis: (C, D, G, H) Two-way ANOVA, Bonferroni post-tests. (I, J) One-way ANOVA, Tukey post-tests. *p<0.05 **p<0.01 ***p<0.001 ****p<0.0001.
For Figure 7. (A) 3–4 wells per group were used. DRG neurons (5,000 cells per well) were obtained from 2 mice, pooled, and equally distributed across the groups. Neutrophils (5×10⁵ cells per well) were obtained from 4 mice, pooled, and equally distributed across the groups. (B) 4 wells per group were used. Neutrophils (5×10⁵ cells per well) were obtained from 2 mice, pooled, and equally distributed across the groups. (C) 3 samples of human blood, obtained from 3 different donors, were used for all conditions. Each sample was tested in triplicate, and samples from different donors were not pooled. (D) 6–7 mice per group were used. (F, G) 10 mice per group were used. Statistical analysis: (A–C) One-way ANOVA, Tukey post-tests. (D–G) Two-way ANOVA, Bonferroni post-tests. (A–C,F–G) *p<0.05 **p<0.01 ***p<0.01 ****p<0.0001. (D) BIBN4096 vs veh: *p<0.05 **p<0.01 ***p<0.001 ****p<0.0001, BoNT/A vs veh: †p<0.05 ††p<0.01 †††p<0.001 ††††p<0.0001.
For Figure S1. (A) 10 mice per group were used for infection with M1 strain, and 8–10 mice per group were used for infection with M3 strain. (B) 9–10 mice per group were used for infection with M1 strain, and 14–16 mice per group were used for infection with M3 strain. (C) 4 mice per group (time point) were used. (D) 8–12 mice per group were used. (E) 4 mice per group were used for infection with M1 strain, and 9–11 mice per group were used for infection with M3 strain (F) 3 mice per group were used, and 3 imaging fields of each mouse were used to quantify the average percentage. Statistical analysis: (A, D) Two-way ANOVA with Bonferroni post-tests (C, E, F) One-way ANOVA with Tukey post-tests. (A, C, D, E, F) *p < 0.05, **p < 0.01, ***p < 0.001, ****p < 0.0001.
For Figure S2. (A) 5–6 mice per group were used. (B) 3 plates containing DRG neurons (2,000 cells per plate) from the same mouse were used for each condition. (C) 4 plates containing DRG neurons (2,000 cells per plate) from the same mouse were used for each condition. (D) 3 plates containing DRG neurons (2,000 cells per plate) from the same mouse were used for each condition. Statistical analysis: (A) Two-way ANOVA with Bonferroni post-tests. (B, C, D) One-way ANOVA with Tukey post-tests, *p < 0.05, **p < 0.01, ***p < 0.001, ****p < 0.0001.
For Figure S3. (A) 3–6 wells containing DRG neurons (5,000 cells per well) were used for each condition. DRG neurons were obtained from 4 mice, pooled, and equally distributed across the groups. (B) 3 samples per group were used. (C, D) 8–12 mice per group were used. (E) 4–5 mice per group were used. Statistical analysis: (A–E) One-way ANOVA with Tukey post-tests. *p < 0.05, **p < 0.01, ***p < 0.001, ****p < 0.0001.
For Figure S4. (A, C, D) 7 mice per group were used. (B) 4 mice per group were used. (E) 4–5 mice per group were used. (F) 3–5 mice per group were used, and 3 imaging fields of each mouse were used to quantify the average percentage. (G) 5 mice per group were used. (H) 3–4 mice per group were used and 3 imaging fields of each mouse were used to quantify the average percentage. Statistical analysis: (A, C, D) Two-way ANOVA with Bonferroni post-tests. (B) One-way ANOVA with Tukey post-tests. (E, F, G, H) Unpaired t-tests. **p < 0.01, ***p < 0.001, ****p < 0.0001.
For Figure S5. (A) 14–16 mice per group were used. (C) 4 mice per group were used. (D) 3–4 mice per group were used to confirm neutrophil depletion. (E) 7–11 mice per group were used. (F) 7–11 mice per group were used for Abscess area measurements, and 10–11 mice per group were used for Mortality (Kaplan-Meier survival curves). Statistical analysis: (A, E, F) two-way ANOVA with Bonferroni post-tests, (C) one-way ANOVA with Tukey post-tests. (A, C) vehicle vs RTX = *p < 0.05, **p < 0.01, ***p < 0.001, ****p < 0.0001. (E, F) RTX + IgG vs RTX + Gr1 = *p < 0.05, **p < 0.01, ***p < 0.001, ****p < 0.0001.
For Figure S6. (A) 5–10 mice per group were used. (B) 6 mice per group were used. (C) 5 mice per group were used. (D) 6 mice per group were used. (E) 4–6 mice per group were used. (F) 5–10 mice per group were used. Statistical analysis: (A, C, E, F) two-way ANOVA with Bonferroni post-tests, (B, D) unpaired t-test. *p < 0.05, **p < 0.01, ***p < 0.001, ****p < 0.0001.
For Figure S7. (A) 4 wells per group were used. Neutrophils (5×10⁵ cells per well) were obtained from 4 mice, pooled, and equally distributed across the groups. (B) 4 wells per group were used. Neutrophils (5×10⁵ cells per well) were obtained from 2 mice, pooled, and equally distributed across the groups. (C) 3–4 wells per group were used. Neutrophils (5×10⁵ cells per well) were obtained from 4 mice, pooled, and equally distributed across the groups. (D) 6 mice per group were used. (E) 6–7 mice per group were used. (F) 4–5 mice per group were used. (G) 10 mice per group were used. Statistical analysis: (A, C, D, F) One-way ANOVA with Tukey post-tests, (B) Unpaired t-test, (E, G) Two-way ANOVA with Bonferroni post-tests. *p < 0.05, **p < 0.01, ****p < 0.0001. (E) BIBN4096 vs vehicle = **p < 0.01, ****p < 0.0001; BoNT/A vs vehicle (†p < 0.05, ††p < 0.01, ††††p < 0.0001).
Supplementary Material
(A) Weight changes over time in mice injected with 5×10⁷ cfu of vehicle or M1 S. pyogenes (n=10 mice/group), and vehicle or M3 S. pyogenes (n=8–10 mice/group). (B) Kaplan-Meier survival curves for mice infected with 5×10⁵–5×10⁷ cfu of M1 S. pyogenes (n=9–10 mice/group) or M3 S. pyogenes (n=14–16 mice/group). (C) Bacterial load recovery from cutaneous/ subcutaneous tissue of paw samples collected at different time points after infection with S. pyogenes M1 (5×10⁷ cfu) determined by quantitative culture (Log cfu plotted, n=4 samples/time point). (D) Time course of lifting/licking behavior in mice following injection of S. pyogenes M3 (5×10⁸ cfu, n=8 mice) or vehicle (n=12 mice). (E) Spontaneous flinches quantified over 1 h time period after injection of vehicle or different doses (5×10⁶–5×10⁷ cfu) S. pyogenes M1 (n=4 mice/group) or S. pyogenes M3 (n=9–11 mice/group). (F) DRG neuron analysis following S. pyogenes infection. Mice were injected in the footpad with M1 S. pyogenes (5×10⁷ cfu). L4–L6 DRG were isolated at 48 h or 72 h post-injection to the infection site, or from naïve, uninfected mice and analyzed for proportions of TRPV1+ (green, top), CGRP+ (green, center), or NF200+ (green, bottom) cells out of total βIII-tubulin+ neurons (blue), with each data point used representing a single mouse, obtained as an average of at least three imaging fields per mouse. (Naïve: n=3 mice, 48 h: n=3 mice, 72 h: n=3). Scale bars, 100 µm. (G) Mice were injected with vehicle or with M1 S. pyogenes; skin tissues were isolated 72 h post-injection and stained for PGP9.5 (green), CGRP (red) or DAPI (blue). White dotted lines delineate skin border. Representative low and high magnification images of skin lesion center, bordering region, and a skin sample remote from the injection site are shown for S. pyogenes infected mice. High magnification images on right are of yellow inset areas in left images. Scale bars, 100 µm. Statistical analysis: (A, D) Two-way ANOVA with Bonferroni post-tests (C, E, F) One-way ANOVA with Tukey post-tests. (A, C, D, E, F) *p < 0.05, **p < 0.01, ***p < 0.001, ****p < 0.0001. ns=not significant. Error bars, mean ± SEM.
(A) Mice lacking inflammatory mediators or immune cells were compared to wild-type controls for induction of heat hyperalgesia (top row) and mechanical hyperalgesia (bottom row), as measured by the latency to response in the Hargreaves radiant heat test, at different time points after infection with S. pyogenes M1 (5×10⁷ cfu). Comparisons are, from left to right: 1) ibuprofen-treated mice (50 mg/kg) vs. vehicle-treated mice, 2) Casp1−/− mice (Caspase-1 deficient mice) vs. wt mice; 3) Myd88−/− mice (Myeloid differentiation factor 88-deficient mice) vs. wt mice, 4) Gr1 antibody-treated mice vs. Rat IgG-treated mice, and 5) Rag2−/− mice (Recombination activating gene 2-deficient mice) vs. wt mice (n=5–6 mice/genotype or treatment group). (B) S. pyogenes supernatant preferentially activates smaller size DRG neurons. DRG neurons were stimulated with supernatant from M1 S. pyogenes at three concentrations and imaged by Fura-2 calcium imaging. Cell size was determined by marking individual bacteria-responsive cells or bacteria-unresponsive cells from 3 separate neuronal fields/condition, and binning by cell body area. (C–D) DRG neurons were stimulated with medium or filtered bacterial supernatant from M1 S. pyogenes strains grown in neurobasal medium (with BSA) at two different concentrations (C, 5×10⁹ cfu/mL) or (D, 5×10¹⁰ cfu/mL). Strains used included wt, isogenic mutants lacking SLS (ΔsagA), SLS and SLO (ΔsloΔsagA), or complemented with sagA (ΔsagA+pDL:sagA, ΔsloΔsagA+pDL:sagA). Data analyzed out of total DRG neurons responding to bacterial supernatant (left), or Cap+ or Cap− subsets responding to bacterial supernatant (right). Statistical analysis: (A) Two-way ANOVA with Bonferroni post-tests. (B, C, D) One-way ANOVA with Tukey post-tests, *p < 0.05, **p < 0.01, ***p < 0.001, ****p < 0.0001. ns=not significant. Mean ± SEM.
(A) Lactate dehydrogenase (LDH) release from DRG neurons after 20 minutes of stimulation with S. pyogenes M1 supernatant (n=3–6 samples/group). (B) SLO hemolytic activity of filtered bacterial supernatants of S. pyogenes measured on sheep erythrocytes in PBS after 30 minute incubation at 37°C. Hemolytic units correspond to the reciprocal of the dilution of supernatant that yielded 50% lysis, where 100% lysis corresponds to that caused by 1% Triton X-100. Hemolytic activities were also determined after pre-treatment of samples with SLO inhibitor, cholesterol at 250 µg/mL (n=3 samples/group). (C) Tissue swelling of mouse hind paws was measured using a digital caliper 1 h after injection with S. pyogenes (5×10⁸ cfu) M1 (left panel), or M3 (right panel) wt bacteria or isogenic mutants deficient in production of SLS (ΔsagA), SLO (Δslo), or both SLO and SLS (ΔsloΔsagA). Swelling was determined as change in thickness from baseline to 1 h after bacterial injection (n=8–12 mice/group). (D) Bacterial load recovery (plotted as log cfu) was determined in hind paw tissue samples 1 h after injection with S. pyogenes (5×10⁸ cfu) M1 (left panel), or M3 (right panel) (n=8–12 mice/group). (E) Acute flinching behaviors are inhibited by anti-SLS but not control rabbit IgG. Mice were injected with anti-SagA (anti-SLS) peptide antibody or control rabbit IgG at the time of injection with S. pyogenes M1 (5×10⁸ cfu). Spontaneous flinches were quantified for 1 h post-injection. Statistical analysis: (A–E) One-way ANOVA with Tukey post-tests. *p < 0.05, **p < 0.01, ***p < 0.001, ****p < 0.0001. ns=not significant. Mean ± SEM.
(A–D) Mice were infected in the flank skin with wt, ΔsagA, and ΔsagA+pDL:sagA bacterial strains (5×10⁶ cfu M1 S. pyogenes). (A) Dermonecrotic lesion size over time (n = 7 mice/group), (B) bacterial load recovery at day 9 (n = 4 mice/group), (C) abscess size over time (n = 7 mice/group), and (D) weight loss over time were measured after infection (n = 7 mice/group). In A, left pictures show representative images of the injection site in mice infected with wt, ΔsagA, and ΔsagA+pDL:sagA at day 8 post-injection. (E) Spontaneous pain behaviors (licking/lifting or flinches over 1 h post-injection) were compared between Trpv1-Cre+/−/Dta+/− mice or control littermates (Trpv1-Cre−/−/Dta+/−) following injection with M1 S. pyogenes (5×10⁸ cfu, n = 4–5 mice per group). (F) Representative pictures of lumbar DRG sections from Trpv1-Cre/Dta or control littermates stained for TRPV1 (green), CGRP (green) and βIII tubulin (blue). Percentage of TRPV1+ or CGRP+ neurons out of total βIII-tubulin+ neurons was quantified (n=3–5 mice/group). (G) Spontaneous pain behaviors (licking/lifting or flinches over 1 h) were compared between RTX and vehicle-treated mice following injection with M1 S. pyogenes (5×10⁸ cfu, n = 5 mice/group). (H) Mice were treated with RTX or vehicle over three days (see Methods for details). Representative images of lumbar DRG sections from RTX-treated or vehicle-treated mice stained for TRPV1 (green), CGRP (green), and βIII tubulin (blue). Percentage of TRPV1+ or CGRP+ neurons out of total βIII-tubulin+ neurons was quantified (n=3–4 mice/group). Statistical analysis: (A, C, D) Two-way ANOVA with Bonferroni post-tests. (B) One-way ANOVA with Tukey post-tests. (E, F, G, H) Unpaired t-tests. **p < 0.01, ***p < 0.001, ****p < 0.0001. nd=not detected. ns=not significant. Mean ± SEM.
(A) Abscess area measurements after subcutaneous injection with S. pyogenes M1 (5×10⁶ cfu) in the flank of RTX-treated nociceptor deficient mice or vehicle-treated control mice (n=14–16 mice/group). (B) Gram staining of flank tissue samples collected at day 3 after injection with S. pyogenes M1 (5×10⁶ cfu) from vehicle-treated mice (upper panel) or RTX-treated mice (lower panel). In samples from vehicle-treated animals, more bacteria accumulation was observed compared to RTX-treated animals (arrows). Scale bars, 50 µm. (C) Spleen weights were increased in S. pyogenes M1 (5×10⁶ cfu) infected vehicle-treated mice compared to RTX-treated mice at day 14 after infection (n=4 spleens/group). (D) Representative FACS plots showing depletion of neutrophils (CD11b+Ly6G+) in skin lesions isolated from Gr1-treated, RTX-treated mice but not control rat IgG-treated, RTX-treated mice. (E–F) Neutrophil depletion with Gr1 antibody abolishes the protective effects of RTX-mediated nociceptor ablation in S. pyogenes infection. (E) Dermonecrotic lesion size and weight loss were measured over 14 days after injection of S. pyogenes M1 (5×10⁶ cfu) in RTX-treated or vehicle-treated control mice receiving Gr1 antibody (125 µg i.p.) or rat IgG control (125 µg i.p.) (n=7–11 mice/group). (F) Abscess area measurements (n=7–11 mice/group) and Kaplan-Meier survival curves (n=10–11 mice/group) in RTX-treated or vehicle-treated control mice receiving Gr1 antibody (125 µg i.p.) or rat IgG control (125 µg i.p.). Statistical analysis: (A, E, F) two-way ANOVA with Bonferroni post-tests, (C) one-way ANOVA with Tukey post-tests. (A, C) vehicle vs RTX = *p < 0.05, **p < 0.01, ***p < 0.001, ****p < 0.0001. (E, F) RTX + IgG vs RTX + Gr1 = *p < 0.05, **p < 0.01, ***p < 0.001, ****p < 0.0001. Mean ± SEM.
(A) BoNT/A local injection at the site of infection blocks S. pyogenes infection. BoNT/A (25 pg in 100 µL) was injected 6 days prior to injection of S. pyogenes M1 (5×10⁶ cfu). Abscess size was measured daily in the flank skin for 14 days (n=5–10 mice/group). (B–C) Local injection of BoNT/A at the site of infection does not block central pain perception. (B) Spontaneous pain behaviors (paw licking/lifting and flinches) quantified over 1 h after injection with S. pyogenes M1 (5×10⁸ cfu) in mice injected subcutaneously 6 days prior to infection with BoNT/A (25 pg in 5 µL) or vehicle alone at the site of bacterial injection (n=6 mice/group). (C) Heat hyperalgesia and mechanical hyperalgesia after infection with S. pyogenes M1 (5×10⁷ cfu) in mice injected subcutaneously 6 days prior to infection with BoNT/A (25 pg in 5 µL) or vehicle alone at the site of bacterial injection (n=5 mice/group). (D–E) Intrathecal injection of BoNT/A blocks pain transmission. (D) Acute spontaneous pain behaviors (paw licking/lifting and flinches) quantified over 1 h after injection with S. pyogenes M1 (5×10⁸ cfu) were quantified in mice treated intrathecally 24 h prior to infection with BoNT/A (25 pg in 5 µL) or vehicle alone (n=6 mice/group). (E) Heat hyperalgesia, the sensitivity to pain evoked by radiant heat (Hargreaves test) and mechanical hyperalgesia, sensitivity to pain evoked by mechanical pressure (von Frey test), were analyzed in mice treated intrathecally with BoNT/A (25 pg in 5 µL) or vehicle 24 h prior to infection with S. pyogenes M1 (5×10⁷ cfu). An additional baseline measurement was performed immediately before infection to ensure the injections did not produce changes in basal threshold (n=4–6 mice/group). (F) Intrathecal administration of BoNT/A does not affect the outcome of S. pyogenes infection. BoNT/A was injected intrathecally (25 pg in 5 µL) 24 h prior to infection with S. pyogenes M1 (5×10⁶ cfu); abscess area was measured daily in mice infected for 14 days (n=5–10 mice/group). Statistical analysis: (A, C, E, F) two-way ANOVA with Bonferroni post-tests, (B, D) unpaired t-test. *p < 0.05, **p < 0.01, ***p < 0.001, ****p < 0.0001. Mean ± SEM.
(A–B) S. pyogenes M1 bacteria were incubated with CGRP8–37 (1 µM), BIBN4096 (1 µM) or CGRP (1 µM) for 1 h in neurobasal medium. Viable bacteria were enumerated by quantitative cultures and quantified as a multiplication factor of surviving colonies relative to starting inoculum (n=4 biological replicates/condition). Similar experiments were conducted for bacteria in neurobasal medium with or without BoNT/A (25 pg in 200 µL) (n=4 biological replicates/condition). (C) Myeloperoxidase (MPO) activity of neutrophils is decreased by CGRP treatment. Mouse neutrophils were incubated in the presence of M1 S. pyogenes and different concentrations of CGRP for 30 minutes at 37°C. Neutrophil supernatant was collected and MPO activity measured (n=3–4 biological replicates/condition). (D) BoNT/A injection or BIBN4096 treatment during infection decreases flank skin and spleen bacterial burdens. Mice infected with S. pyogenes (5×10⁶ cfu M1) were treated with single BoNT/A local injection (25 pg in 50 µL) or BIBN4096 systemic injection (30 mg/kg) 2 h after subcutaneous injection of bacteria. At 9 days after injection of bacteria, flank skin and spleens were isolated, and bacterial load recovery determined (n=6 mice/group). (E) BoNT/A injection or BIBN4096 treatment after infection significantly decreases abscess formation but not weight loss following S. pyogenes infection. Mice were injected with S. pyogenes M1 (5×10⁶ cfu) in the flank followed by post-treatment with either BoNT/A (25 pg in 50 µL) or BIBN4096 (30 mg/kg) 2 h after infection. Abscess area and body weight were measured daily for 14 days (n=6–7 mice/group). (F) Flow cytometry of neutrophil (CD11b+Ly6G+ gates) recruitment in necrotizing lesions 1 day after S. pyogenes M1 injection (5×10⁶ cfu) in mice treated with vehicle, BoNT/A local injection (25 pg in 50 µL), or BIBN4096 systemic injection (30 mg/kg) 2 h after subcutaneous injection of bacteria (n=4–5 mice/group). (G) Mice were treated subcutaneously with BoNT/A or vehicle at day 2 and day 9 following flank injection of S. pyogenes M1 (5×10⁶ cfu), and weight loss was measured over time (n=10 mice/group). Arrows show BoNT/A treatments. Statistical analysis: (A, C, D, F) One-way ANOVA with Tukey post-tests, (B) Unpaired t-test, (E, G) Two-way ANOVA with Bonferroni post-tests. *p < 0.05, **p < 0.01, ****p < 0.0001. (E) BIBN4096 vs vehicle = **p < 0.01, ****p < 0.0001; BoNT/A vs vehicle (†p < 0.05, ††p < 0.01, ††††p < 0.0001). ns=not significant. Mean ± SEM.
HIGHLIGHTS.
-
-
S. pyogenes produces pain during bacterial invasion through Streptolysin S (SLS).
-
-
SLS induces TRPV1 neurons to release the neuropeptide CGRP in infected tissues.
-
-
Neurons suppress neutrophil recruitment and bactericidal activity.
-
-
BoNT/A and CGRP antagonist block neural suppression of immunity to treat infection.
Acknowledgments
We thank Ernest Aw, Maria Izabella Alves, Yibing Wei, Pankaj Baral, Chad Araneo, Kaitlin Goldstein, Tammy Hshieh and Erica Alexandre for support. This work was supported by NIH grants DP2AT009499 and RO1AI130019 to IMC, RO1AI070926 and RO1AI029952 to MRW, RO1AI010085 and R21AI116808 to JBD, CAPES fellowship to FAPR, CNPq Researcher fellowship 307186/2017-2 to WAVJ.
Footnotes
Publisher's Disclaimer: This is a PDF file of an unedited manuscript that has been accepted for publication. As a service to our customers we are providing this early version of the manuscript. The manuscript will undergo copyediting, typesetting, and review of the resulting proof before it is published in its final citable form. Please note that during the production process errors may be discovered which could affect the content, and all legal disclaimers that apply to the journal pertain.
AUTHOR CONTRIBUTIONS
Conceptualization, FAPR, IMC, MRW; Construction of unique reagents and bacterial strains, JD, BB, MO; Experimentation and data analysis, FAPR, BB, RH, MO, NJY, KJB, MP; Writing-original draft, FAPR, IMC; Review/editing manuscript, FAPR, BB, WAVJ, MRW, IMC; Funding acquisition, WAVJ, MRW, IMC.
DECLARATION OF INTERESTS
FAPR, BB, NJY, MRW and IMC are co-inventors on patents that incorporate discoveries described in the manuscript.
References
- Abraira VE, Ginty DD. The Sensory Neurons of Touch. Neuron. 2013;79:618–639. doi: 10.1016/j.neuron.2013.07.051. [DOI] [PMC free article] [PubMed] [Google Scholar]
- Ashbaugh CD, Warren HB, Carey VJ, Wessels MR. Molecular analysis of the role of the group A streptococcal cysteine protease, hyaluronic acid capsule, and M protein in a murine model of human invasive soft-tissue infection. J. Clin. Invest. 1998;102:550–560. doi: 10.1172/JCI3065. [DOI] [PMC free article] [PubMed] [Google Scholar]
- Bastiat-Sempe B, Love JF, Lomayesva N, Wessels MR. Streptolysin O and NAD-glycohydrolase prevent phagolysosome acidification and promote group A Streptococcus survival in macrophages. MBio 5. 2014:e01690–14. doi: 10.1128/mBio.01690-14. [DOI] [PMC free article] [PubMed] [Google Scholar]
- Basbaum AI, Bautista DM, Scherrer G, Julius D. Cellular and molecular mechanisms of pain. Cell. 2009;139:267–284. doi: 10.1016/j.cell.2009.09.028. [DOI] [PMC free article] [PubMed] [Google Scholar]
- Bellono NW, Bayrer JR, Leitch DB, Castro J, Zhang C, O’Donnell TA, Brierley SM, Ingraham HA, Julius D. Enterochromaffin Cells Are Gut Chemosensors that Couple to Sensory Neural Pathways. Cell. 2017;170:185–198.e16. doi: 10.1016/j.cell.2017.05.034. [DOI] [PMC free article] [PubMed] [Google Scholar]
- Bentley CC, Hakansson A, Christianson J, Wessels MR. Extracellular group A Streptococcus induces keratinocyte apoptosis by dysregulating calcium signalling. Cell. Microbiol. 2005;7:945–955. doi: 10.1111/j.1462-5822.2005.00525.x. [DOI] [PubMed] [Google Scholar]
- Betschel SD, Borgia SM, Barg NL, Low DE, De Azavedo JCS. Reduced Virulence of Group A Streptococcal Tn916 Mutants That Do Not Produce Streptolysin S. Infect. Immun. 1998;66:1671–1679. doi: 10.1128/iai.66.4.1671-1679.1998. [DOI] [PMC free article] [PubMed] [Google Scholar]
- Binshtok AM, Wang H, Zimmermann K, Amaya F, Vardeh D, Shi L, Brenner GJ, Ji R-R, Bean BP, Woolf CJ, et al. Nociceptors are interleukin-1beta sensors. J. Neurosci. 2008;28:14062–14073. doi: 10.1523/JNEUROSCI.3795-08.2008. [DOI] [PMC free article] [PubMed] [Google Scholar]
- Binz T, Blasi J, Yamasaki S, Baumeister A, Link E, Südhof TC, Jahn R, Niemann H. Proteolysis of SNAP-25 by types E and A botulinal neurotoxins. J. Biol. Chem. 1994;269:1617–1620. [PubMed] [Google Scholar]
- Borschitz T, Schlicht S, Siegel E, Hanke E, von Stebut E, Goldberg E. Improvement of a Clinical Score for Necrotizing Fasciitis: “Pain Out of Proportion” and High CRP Levels Aid the Diagnosis. PLoS One. 2015;10:e0132775. doi: 10.1371/journal.pone.0132775. [DOI] [PMC free article] [PubMed] [Google Scholar]
- Bricker AL, Cywes C, Ashbaugh CD, Wessels MR. NAD+-glycohydrolase acts as an intracellular toxin to enhance the extracellular survival of group A streptococci. Mol. Microbiol. 2002;44:257–269. doi: 10.1046/j.1365-2958.2002.02876.x. [DOI] [PubMed] [Google Scholar]
- Buchanan CS, Haserick JR. Necrotizing fasciitis due to group A beta-hemolytic streptococci. Arch. Dermatol. 1970;101:664–668. [PubMed] [Google Scholar]
- Caceres AI, Brackmann M, Elia MD, Bessac BF, del Camino D, D’Amours M, Witek JS, Fanger CM, Chong Ja, Hayward NJ, et al. A sensory neuronal ion channel essential for airway inflammation and hyperreactivity in asthma. Proc. Natl. Acad. Sci. U. S. A. 2009;106:9099–9104. doi: 10.1073/pnas.0900591106. [DOI] [PMC free article] [PubMed] [Google Scholar]
- Chavan SS, Pavlov VA, Tracey KJ. Mechanisms and Therapeutic Relevance of Neuro-immune Communication. Immunity. 2017;46:927–942. doi: 10.1016/j.immuni.2017.06.008. [DOI] [PMC free article] [PubMed] [Google Scholar]
- Chiu IM, Heesters BA, Ghasemlou N, Von Hehn CA, Zhao F, Tran J, Wainger B, Strominger A, Muralidharan S, Horswill AR, et al. Bacteria activate sensory neurons that modulate pain and inflammation. Nature. 2013;501:52–57. doi: 10.1038/nature12479. [DOI] [PMC free article] [PubMed] [Google Scholar]
- Chiu IM, Barrett LB, Williams EK, Strochlic DE, Lee S, Weyer AD, Lou S, Bryman GS, Roberson DP, Ghasemlou N, et al. Transcriptional profiling at whole population and single cell levels reveals somatosensory neuron molecular diversity. Elife. 2014;3 doi: 10.7554/eLife.04660. [DOI] [PMC free article] [PubMed] [Google Scholar]
- Cole JN, Barnett TC, Nizet V, Walker MJ. Molecular insight into invasive group A streptococcal disease. Nat. Rev. Microbiol. 2011;9:724–736. doi: 10.1038/nrmicro2648. [DOI] [PubMed] [Google Scholar]
- Dale JB, Chiang EY, Hasty DL, Courtney HS. Antibodies against a synthetic peptide of SagA neutralize the cytolytic activity of streptolysin S from group A streptococci. Infect. Immun. 2002;70:2166–2170. doi: 10.1128/IAI.70.4.2166-2170.2002. [DOI] [PMC free article] [PubMed] [Google Scholar]
- Datta V, Myskowski SM, Kwinn LA, Chiem DN, Varki N, Kansal RG, Kotb M, Nizet V. Mutational analysis of the group A streptococcal operon encoding streptolysin S and its virulence role in invasive infection. Mol. Microbiol. 2005;56:681–695. doi: 10.1111/j.1365-2958.2005.04583.x. [DOI] [PubMed] [Google Scholar]
- Flaherty RA, Puricelli JM, Higashi DL, Park CJ, Lee SW. Streptolysin S Promotes Programmed Cell Death and Enhances Inflammatory Signaling in Epithelial Keratinocytes during Group A Streptococcus Infection. Infect. Immun. 2015;83:4118–4133. doi: 10.1128/IAI.00611-15. [DOI] [PMC free article] [PubMed] [Google Scholar]
- Gabanyi I, Muller PA, Feighery L, Oliveira TY, Costa-Pinto FA, Mucida D. Neuro-immune Interactions Drive Tissue Programming in Intestinal Macrophages. Cell. 2016;164:378–391. doi: 10.1016/j.cell.2015.12.023. [DOI] [PMC free article] [PubMed] [Google Scholar]
- Gilbert E, W N. Efficacy of botulinum neurotoxin type A for treating recalcitrant plaque psoriasis. J. Drugs Dermatol. 2014;13:1407–1408. [PubMed] [Google Scholar]
- Grando SA, Zachary CB. THE NON-NEURONAL AND NON-MUSCULAR EFFECTS OF BOTULINUM TOXIN: A Graceful Opportunity for a Deadly Molecule to Treat a Human Disease in the Skin and Beyond. Br. J. Dermatol. 2017 doi: 10.1111/bjd.16080. [DOI] [PubMed] [Google Scholar]
- Granstein RD, Wagner JA, Stohl LL, Ding W. Calcitonin gene-related peptide: key regulator of cutaneous immunity. Acta Physiol. (Oxf) 2015;213:586–594. doi: 10.1111/apha.12442. [DOI] [PMC free article] [PubMed] [Google Scholar]
- Gryllos I, Tran-Winkler HJ, Cheng M-F, Chung H, Bolcome R, Lu W, Lehrer RI, Wessels MR, Wessels MR. Induction of group A Streptococcus virulence by a human antimicrobial peptide. Proc. Natl. Acad. Sci. U. S. A. 2008;105:16755–16760. doi: 10.1073/pnas.0803815105. [DOI] [PMC free article] [PubMed] [Google Scholar]
- Higashi DL, Biais N, Donahue DL, Mayfield JA, Tessier CR, Rodriguez K, Ashfeld BL, Luchetti J, Ploplis VA, Castellino FJ, et al. Activation of band 3 mediates group A Streptococcus streptolysin S-based beta-haemolysis. Nat. Microbiol. 2016;1:15004. doi: 10.1038/nmicrobiol.2015.4. [DOI] [PubMed] [Google Scholar]
- Hou Q, Barr T, Gee L, Vickers J, Wymer J, Borsani E, Rodella L, Getsios S, Burdo T, Eisenberg E, et al. Keratinocyte expression of calcitonin gene-related peptide β: Implications for neuropathic and inflammatory pain mechanisms. Pain. 2011;152:2036–2051. doi: 10.1016/j.pain.2011.04.033. [DOI] [PMC free article] [PubMed] [Google Scholar]
- Hunskaar S, Fasmer OB, Hole K. Formalin test in mice, a useful technique for evaluating mild analgesics. J. Neurosci. Methods. 1985;14:69–76. doi: 10.1016/0165-0270(85)90116-5. [DOI] [PubMed] [Google Scholar]
- Ji Y, McLandsborough L, Kondagunta A, Cleary PP. C5a peptidase alters clearance and trafficking of group A streptococci by infected mice. Infect. Immun. 1996;64:503–510. doi: 10.1128/iai.64.2.503-510.1996. [DOI] [PMC free article] [PubMed] [Google Scholar]
- Kashem SW, Riedl MS, Yao C, Honda CN, Vulchanova L, Kaplan DH. Nociceptive Sensory Fibers Drive Interleukin-23 Production from CD301b+ Dermal Dendritic Cells and Drive Protective Cutaneous Immunity. Immunity. 2015;43:515–526. doi: 10.1016/j.immuni.2015.08.016. [DOI] [PMC free article] [PubMed] [Google Scholar]
- Krämer HH, Angerer C, Erbguth F, Schmelz M, Birklein F. Botulinum Toxin A reduces neurogenic flare but has almost no effect on pain and hyperalgesia in human skin. J. Neurol. 2003;250:188–193. doi: 10.1007/s00415-003-0971-x. [DOI] [PubMed] [Google Scholar]
- Kurupati P, Turner CE, Tziona I, Lawrenson RA, Alam FM, Nohadani M, Stamp GW, Zinkernagel AS, Nizet V, Edwards RJ, et al. Chemokine-cleaving Streptococcus pyogenes protease SpyCEP is necessary and sufficient for bacterial dissemination within soft tissues and the respiratory tract. Mol. Microbiol. 2010;76:1387–1397. doi: 10.1111/j.1365-2958.2010.07065.x. [DOI] [PMC free article] [PubMed] [Google Scholar]
- Lee W-H, Shin TJ, Kim HJ, Lee J-K, Suh H-W, Lee SC, Seo K. Intrathecal Administration of Botulinum Neurotoxin Type A Attenuates Formalin-Induced Nociceptive Responses in Mice. Anesth. Analg. 2011;112:228–235. doi: 10.1213/ANE.0b013e3181ffa1d7. [DOI] [PubMed] [Google Scholar]
- Leitch HA, Palepu A, Fernandes CM. Necrotizing fasciitis secondary to group A streptococcus. Morbidity and mortality still high. Can. Fam. Physician. 2000;46:1460–1466. [PMC free article] [PubMed] [Google Scholar]
- Lin A, Loughman JA, Zinselmeyer BH, Miller MJ, Caparon MG. Streptolysin S inhibits neutrophil recruitment during the early stages of Streptococcus pyogenes infection. Infect. Immun. 2009;77:5190–5201. doi: 10.1128/IAI.00420-09. [DOI] [PMC free article] [PubMed] [Google Scholar]
- Liu B, Escalera J, Balakrishna S, Fan L, Caceres AI, Robinson E, Sui A, McKay MC, McAlexander MA, Herrick CA, et al. TRPA1 controls inflammation and pruritogen responses in allergic contact dermatitis. FASEB J. 2013;27:3549–3563. doi: 10.1096/fj.13-229948. [DOI] [PMC free article] [PubMed] [Google Scholar]
- Love JF, Tran-Winkler HJ, Wessels MR. Vitamin D and the human antimicrobial peptide LL-37 enhance group a streptococcus resistance to killing by human cells. MBio. 2012;3:e00394–12. doi: 10.1128/mBio.00394-12. [DOI] [PMC free article] [PubMed] [Google Scholar]
- Martinon F, Burns K, Tschopp J. The inflammasome: a molecular platform triggering activation of inflammatory caspases and processing of proIL-beta. Mol. Cell. 2002;10:417–426. doi: 10.1016/s1097-2765(02)00599-3. [DOI] [PubMed] [Google Scholar]
- Meng J, Wang J, Lawrence G, Dolly JO. Synaptobrevin I mediates exocytosis of CGRP from sensory neurons and inhibition by botulinum toxins reflects their anti-nociceptive potential. J. Cell Sci. 2007;120:2864–2874. doi: 10.1242/jcs.012211. [DOI] [PubMed] [Google Scholar]
- Mishra SK, Tisel SM, Orestes P, Bhangoo SK, Hoon MA. TRPV1-lineage neurons are required for thermal sensation. EMBO J. 2011;30:582–593. doi: 10.1038/emboj.2010.325. [DOI] [PMC free article] [PubMed] [Google Scholar]
- Molloy EM, Cotter PD, Hill C, Mitchell DA, Ross RP. Streptolysin S-like virulence factors: the continuing sagA. Nat. Rev. Microbiol. 2011;9:670–681. doi: 10.1038/nrmicro2624. [DOI] [PMC free article] [PubMed] [Google Scholar]
- Muller PA, Koscso B, Rajani GM, Stevanovic K, Berres ML, Hashimoto D, Mortha A, Leboeuf M, Li XM, Mucida D, et al. Crosstalk between muscularis macrophages and enteric neurons regulates gastrointestinal motility. Cell. 2014;158:300–313. doi: 10.1016/j.cell.2014.04.050. [DOI] [PMC free article] [PubMed] [Google Scholar]
- Nizet V. Streptococcal beta-hemolysins: genetics and role in disease pathogenesis. Trends Microbiol. 2002;10:575–580. doi: 10.1016/s0966-842x(02)02473-3. [DOI] [PubMed] [Google Scholar]
- Nizet V, Beall B, Bast DJ, Datta V, Kilburn L, Low DE, De Azavedo JC. Genetic locus for streptolysin S production by group A streptococcus. Infect. Immun. 2000;68:4245–4254. doi: 10.1128/iai.68.7.4245-4254.2000. [DOI] [PMC free article] [PubMed] [Google Scholar]
- Oetjen LK, Mack MR, Feng J, Whelan TM, Niu H, Guo CJ, Chen S, Trier AM, Xu AZ, Tripathi SV, et al. Sensory Neurons Co-opt Classical Immune Signaling Pathways to Mediate Chronic Itch. Cell. 2017;171:217–228.e13. doi: 10.1016/j.cell.2017.08.006. [DOI] [PMC free article] [PubMed] [Google Scholar]
- Olsen RJ, Musser JM. Molecular Pathogenesis of Necrotizing Fasciitis. Annu. Rev. Pathol. Mech. Dis. 2010;5:1–31. doi: 10.1146/annurev-pathol-121808-102135. [DOI] [PubMed] [Google Scholar]
- O’Seaghdha M, Wessels MR. Streptolysin O and its co-toxin NAD-glycohydrolase protect group A Streptococcus from Xenophagic killing. PLoS Pathog. 2013;9:e1003394. doi: 10.1371/journal.ppat.1003394. [DOI] [PMC free article] [PubMed] [Google Scholar]
- Okumura CYM, Nizet V. Subterfuge and Sabotage: Evasion of Host Innate Defenses by Invasive Gram-Positive Bacterial Pathogens. Annu. Rev. Microbiol. 2014;68:439–458. doi: 10.1146/annurev-micro-092412-155711. [DOI] [PMC free article] [PubMed] [Google Scholar]
- Perez-Casal J, Price JA, Maguin E, Scott JR. An M protein with a single C repeat prevents phagocytosis of Streptococcus pyogenes: use of a temperature-sensitive shuttle vector to deliver homologous sequences to the chromosome of S. pyogenes. Mol. Microbiol. 1993;8:809–819. doi: 10.1111/j.1365-2958.1993.tb01628.x. [DOI] [PubMed] [Google Scholar]
- Petersen KA, Lassen LH, Birk S, Lesko L, Olesen J. BIBN4096BS Antagonizes Human α-calcitonin Gene Related Peptide–induced Headache and Extracerebral Artery Dilatation*. Clin. Pharmacol. Ther. 2005;77:202–213. doi: 10.1016/j.clpt.2004.10.001. [DOI] [PubMed] [Google Scholar]
- Pinho-Ribeiro FA, Verri WA, Chiu IM. Nociceptor Sensory Neuron–Immune Interactions in Pain and Inflammation. Trends Immunol. 2017;38 doi: 10.1016/j.it.2016.10.001. [DOI] [PMC free article] [PubMed] [Google Scholar]
- Ralph AP, Carapetis JR. Group a streptococcal diseases and their global burden. Curr. Top. Microbiol. Immunol. 2013;368:1–27. doi: 10.1007/82_2012_280. [DOI] [PubMed] [Google Scholar]
- Riol-Blanco L, Ordovas-Montanes J, Perro M, Naval E, Thiriot A, Alvarez D, Paust S, Wood JN, von Andrian UH. Nociceptive sensory neurons drive interleukin-23-mediated psoriasiform skin inflammation. Nature. 2014;510:157–161. doi: 10.1038/nature13199. [DOI] [PMC free article] [PubMed] [Google Scholar]
- Rainsford KD. Fifty years of ibuprofen: advancing pain and fever management. Int. J. Clin. Pract. 2013;67:1–2. doi: 10.1111/ijcp.12050. [DOI] [PubMed] [Google Scholar]
- Romero M, Keyel M, Shi G, Bhattacharjee P, Roth R, Heuser JE, Keyel PA. Intrinsic repair protects cells from pore-forming toxins by microvesicle shedding. Cell Death Differ. 2017;24:798–808. doi: 10.1038/cdd.2017.11. [DOI] [PMC free article] [PubMed] [Google Scholar]
- Schrager HM, Rheinwald JG, Wessels MR. Hyaluronic acid capsule and the role of streptococcal entry into keratinocytes in invasive skin infection. J. Clin. Invest. 1996;98:1954–1958. doi: 10.1172/JCI118998. [DOI] [PMC free article] [PubMed] [Google Scholar]
- Shinkai Y, Rathbun G, Lam KP, Oltz EM, Stewart V, Mendelsohn M, Charron J, Datta M, Young F, Stall AM. RAG-2-deficient mice lack mature lymphocytes owing to inability to initiate V(D)J rearrangement. Cell. 1992;68:855–867. doi: 10.1016/0092-8674(92)90029-c. [DOI] [PubMed] [Google Scholar]
- Sierig G, Cywes C, Wessels MR, Ashbaugh CD. Cytotoxic effects of streptolysin o and streptolysin s enhance the virulence of poorly encapsulated group a streptococci. Infect. Immun. 2003;71:446–455. doi: 10.1128/IAI.71.1.446-455.2003. [DOI] [PMC free article] [PubMed] [Google Scholar]
- Stevens DL, Bryant AE. Necrotizing Soft-Tissue Infections. N. Engl. J. Med. 2017;377:2253–2265. doi: 10.1056/NEJMra1600673. [DOI] [PubMed] [Google Scholar]
- Takahashi K, Nakanishi S, Imamura S. Direct effects of cutaneous neuropeptides on adenylyl cyclase activity and proliferation in a keratinocyte cell line: Stimulation of cyclic AMP formation by CGRP and VIP/PHM, and inhibition by NPY through G protein-coupled receptors. J. Invest. Dermatol. 1993;101:646–651. doi: 10.1111/1523-1747.ep12371670. [DOI] [PubMed] [Google Scholar]
- Talbot S, Abdulnour R-EE, Burkett PR, Lee S, Cronin SJF, Pascal MA, Laedermann C, Foster SL, Tran JV, Lai N, et al. Silencing Nociceptor Neurons Reduces Allergic Airway Inflammation. Neuron. 2015;87:341–354. doi: 10.1016/j.neuron.2015.06.007. [DOI] [PMC free article] [PubMed] [Google Scholar]
- Thulin P, Johansson L, Low DE, Gan BS, Kotb M, McGeer A, Norrby-Teglund A. Viable group A streptococci in macrophages during acute soft tissue infection. PLoS Med. 2006;3:371–379. doi: 10.1371/journal.pmed.0030053. [DOI] [PMC free article] [PubMed] [Google Scholar]
- Tso AR, Goadsby PJ. Anti-CGRP Monoclonal Antibodies: the Next Era of Migraine Prevention? Curr. Treat. Options Neurol. 2017;19:27. doi: 10.1007/s11940-017-0463-4. [DOI] [PMC free article] [PubMed] [Google Scholar]
- Tweten RK, Hotze EM, Wade KR. The Unique Molecular Choreography of Giant Pore Formation by the Cholesterol-Dependent Cytolysins of Gram-Positive Bacteria. Annu. Rev. Microbiol. 2015;69:323–340. doi: 10.1146/annurev-micro-091014-104233. [DOI] [PMC free article] [PubMed] [Google Scholar]
- Veiga-Fernandes H, Mucida D. Neuro-Immune Interactions at Barrier Surfaces. Cell. 2016;165:801–811. doi: 10.1016/j.cell.2016.04.041. [DOI] [PMC free article] [PubMed] [Google Scholar]
- Wilson HD, Haltalin KC. Acute necrotizing fasciitis in childhood. Report of 11 cases. Am. J. Dis. Child. 1973;125:591–595. doi: 10.1001/archpedi.1973.04160040087018. [DOI] [PubMed] [Google Scholar]
- Wilson SR, Thé L, Batia LM, Beattie K, Katibah GE, McClain SP, Pellegrino M, Estandian DM, Bautista DM. The Epithelial Cell-Derived Atopic Dermatitis Cytokine TSLP Activates Neurons to Induce Itch. Cell. 2013a;155:285–295. doi: 10.1016/j.cell.2013.08.057. [DOI] [PMC free article] [PubMed] [Google Scholar]
- Wilson SR, Nelson AM, Batia L, Morita T, Estandian D, Owens DM, Lumpkin EA, Bautista DM. The Ion Channel TRPA1 Is Required for Chronic Itch. J. Neurosci. 2013b;33:9283–9294. doi: 10.1523/JNEUROSCI.5318-12.2013. [DOI] [PMC free article] [PubMed] [Google Scholar]
- Yamamoto M, Sato S, Hemmi H, Hoshino K, Kaisho T, Sanjo H, Takeuchi O, Sugiyama M, Okabe M, Takeda K, et al. Role of Adaptor TRIF in the MyD88-Independent Toll-Like Receptor Signaling Pathway. Science. 2003;301:640–643. doi: 10.1126/science.1087262. [DOI] [PubMed] [Google Scholar]
Associated Data
This section collects any data citations, data availability statements, or supplementary materials included in this article.
Supplementary Materials
(A) Weight changes over time in mice injected with 5×10⁷ cfu of vehicle or M1 S. pyogenes (n=10 mice/group), and vehicle or M3 S. pyogenes (n=8–10 mice/group). (B) Kaplan-Meier survival curves for mice infected with 5×10⁵–5×10⁷ cfu of M1 S. pyogenes (n=9–10 mice/group) or M3 S. pyogenes (n=14–16 mice/group). (C) Bacterial load recovery from cutaneous/ subcutaneous tissue of paw samples collected at different time points after infection with S. pyogenes M1 (5×10⁷ cfu) determined by quantitative culture (Log cfu plotted, n=4 samples/time point). (D) Time course of lifting/licking behavior in mice following injection of S. pyogenes M3 (5×10⁸ cfu, n=8 mice) or vehicle (n=12 mice). (E) Spontaneous flinches quantified over 1 h time period after injection of vehicle or different doses (5×10⁶–5×10⁷ cfu) S. pyogenes M1 (n=4 mice/group) or S. pyogenes M3 (n=9–11 mice/group). (F) DRG neuron analysis following S. pyogenes infection. Mice were injected in the footpad with M1 S. pyogenes (5×10⁷ cfu). L4–L6 DRG were isolated at 48 h or 72 h post-injection to the infection site, or from naïve, uninfected mice and analyzed for proportions of TRPV1+ (green, top), CGRP+ (green, center), or NF200+ (green, bottom) cells out of total βIII-tubulin+ neurons (blue), with each data point used representing a single mouse, obtained as an average of at least three imaging fields per mouse. (Naïve: n=3 mice, 48 h: n=3 mice, 72 h: n=3). Scale bars, 100 µm. (G) Mice were injected with vehicle or with M1 S. pyogenes; skin tissues were isolated 72 h post-injection and stained for PGP9.5 (green), CGRP (red) or DAPI (blue). White dotted lines delineate skin border. Representative low and high magnification images of skin lesion center, bordering region, and a skin sample remote from the injection site are shown for S. pyogenes infected mice. High magnification images on right are of yellow inset areas in left images. Scale bars, 100 µm. Statistical analysis: (A, D) Two-way ANOVA with Bonferroni post-tests (C, E, F) One-way ANOVA with Tukey post-tests. (A, C, D, E, F) *p < 0.05, **p < 0.01, ***p < 0.001, ****p < 0.0001. ns=not significant. Error bars, mean ± SEM.
(A) Mice lacking inflammatory mediators or immune cells were compared to wild-type controls for induction of heat hyperalgesia (top row) and mechanical hyperalgesia (bottom row), as measured by the latency to response in the Hargreaves radiant heat test, at different time points after infection with S. pyogenes M1 (5×10⁷ cfu). Comparisons are, from left to right: 1) ibuprofen-treated mice (50 mg/kg) vs. vehicle-treated mice, 2) Casp1−/− mice (Caspase-1 deficient mice) vs. wt mice; 3) Myd88−/− mice (Myeloid differentiation factor 88-deficient mice) vs. wt mice, 4) Gr1 antibody-treated mice vs. Rat IgG-treated mice, and 5) Rag2−/− mice (Recombination activating gene 2-deficient mice) vs. wt mice (n=5–6 mice/genotype or treatment group). (B) S. pyogenes supernatant preferentially activates smaller size DRG neurons. DRG neurons were stimulated with supernatant from M1 S. pyogenes at three concentrations and imaged by Fura-2 calcium imaging. Cell size was determined by marking individual bacteria-responsive cells or bacteria-unresponsive cells from 3 separate neuronal fields/condition, and binning by cell body area. (C–D) DRG neurons were stimulated with medium or filtered bacterial supernatant from M1 S. pyogenes strains grown in neurobasal medium (with BSA) at two different concentrations (C, 5×10⁹ cfu/mL) or (D, 5×10¹⁰ cfu/mL). Strains used included wt, isogenic mutants lacking SLS (ΔsagA), SLS and SLO (ΔsloΔsagA), or complemented with sagA (ΔsagA+pDL:sagA, ΔsloΔsagA+pDL:sagA). Data analyzed out of total DRG neurons responding to bacterial supernatant (left), or Cap+ or Cap− subsets responding to bacterial supernatant (right). Statistical analysis: (A) Two-way ANOVA with Bonferroni post-tests. (B, C, D) One-way ANOVA with Tukey post-tests, *p < 0.05, **p < 0.01, ***p < 0.001, ****p < 0.0001. ns=not significant. Mean ± SEM.
(A) Lactate dehydrogenase (LDH) release from DRG neurons after 20 minutes of stimulation with S. pyogenes M1 supernatant (n=3–6 samples/group). (B) SLO hemolytic activity of filtered bacterial supernatants of S. pyogenes measured on sheep erythrocytes in PBS after 30 minute incubation at 37°C. Hemolytic units correspond to the reciprocal of the dilution of supernatant that yielded 50% lysis, where 100% lysis corresponds to that caused by 1% Triton X-100. Hemolytic activities were also determined after pre-treatment of samples with SLO inhibitor, cholesterol at 250 µg/mL (n=3 samples/group). (C) Tissue swelling of mouse hind paws was measured using a digital caliper 1 h after injection with S. pyogenes (5×10⁸ cfu) M1 (left panel), or M3 (right panel) wt bacteria or isogenic mutants deficient in production of SLS (ΔsagA), SLO (Δslo), or both SLO and SLS (ΔsloΔsagA). Swelling was determined as change in thickness from baseline to 1 h after bacterial injection (n=8–12 mice/group). (D) Bacterial load recovery (plotted as log cfu) was determined in hind paw tissue samples 1 h after injection with S. pyogenes (5×10⁸ cfu) M1 (left panel), or M3 (right panel) (n=8–12 mice/group). (E) Acute flinching behaviors are inhibited by anti-SLS but not control rabbit IgG. Mice were injected with anti-SagA (anti-SLS) peptide antibody or control rabbit IgG at the time of injection with S. pyogenes M1 (5×10⁸ cfu). Spontaneous flinches were quantified for 1 h post-injection. Statistical analysis: (A–E) One-way ANOVA with Tukey post-tests. *p < 0.05, **p < 0.01, ***p < 0.001, ****p < 0.0001. ns=not significant. Mean ± SEM.
(A–D) Mice were infected in the flank skin with wt, ΔsagA, and ΔsagA+pDL:sagA bacterial strains (5×10⁶ cfu M1 S. pyogenes). (A) Dermonecrotic lesion size over time (n = 7 mice/group), (B) bacterial load recovery at day 9 (n = 4 mice/group), (C) abscess size over time (n = 7 mice/group), and (D) weight loss over time were measured after infection (n = 7 mice/group). In A, left pictures show representative images of the injection site in mice infected with wt, ΔsagA, and ΔsagA+pDL:sagA at day 8 post-injection. (E) Spontaneous pain behaviors (licking/lifting or flinches over 1 h post-injection) were compared between Trpv1-Cre+/−/Dta+/− mice or control littermates (Trpv1-Cre−/−/Dta+/−) following injection with M1 S. pyogenes (5×10⁸ cfu, n = 4–5 mice per group). (F) Representative pictures of lumbar DRG sections from Trpv1-Cre/Dta or control littermates stained for TRPV1 (green), CGRP (green) and βIII tubulin (blue). Percentage of TRPV1+ or CGRP+ neurons out of total βIII-tubulin+ neurons was quantified (n=3–5 mice/group). (G) Spontaneous pain behaviors (licking/lifting or flinches over 1 h) were compared between RTX and vehicle-treated mice following injection with M1 S. pyogenes (5×10⁸ cfu, n = 5 mice/group). (H) Mice were treated with RTX or vehicle over three days (see Methods for details). Representative images of lumbar DRG sections from RTX-treated or vehicle-treated mice stained for TRPV1 (green), CGRP (green), and βIII tubulin (blue). Percentage of TRPV1+ or CGRP+ neurons out of total βIII-tubulin+ neurons was quantified (n=3–4 mice/group). Statistical analysis: (A, C, D) Two-way ANOVA with Bonferroni post-tests. (B) One-way ANOVA with Tukey post-tests. (E, F, G, H) Unpaired t-tests. **p < 0.01, ***p < 0.001, ****p < 0.0001. nd=not detected. ns=not significant. Mean ± SEM.
(A) Abscess area measurements after subcutaneous injection with S. pyogenes M1 (5×10⁶ cfu) in the flank of RTX-treated nociceptor deficient mice or vehicle-treated control mice (n=14–16 mice/group). (B) Gram staining of flank tissue samples collected at day 3 after injection with S. pyogenes M1 (5×10⁶ cfu) from vehicle-treated mice (upper panel) or RTX-treated mice (lower panel). In samples from vehicle-treated animals, more bacteria accumulation was observed compared to RTX-treated animals (arrows). Scale bars, 50 µm. (C) Spleen weights were increased in S. pyogenes M1 (5×10⁶ cfu) infected vehicle-treated mice compared to RTX-treated mice at day 14 after infection (n=4 spleens/group). (D) Representative FACS plots showing depletion of neutrophils (CD11b+Ly6G+) in skin lesions isolated from Gr1-treated, RTX-treated mice but not control rat IgG-treated, RTX-treated mice. (E–F) Neutrophil depletion with Gr1 antibody abolishes the protective effects of RTX-mediated nociceptor ablation in S. pyogenes infection. (E) Dermonecrotic lesion size and weight loss were measured over 14 days after injection of S. pyogenes M1 (5×10⁶ cfu) in RTX-treated or vehicle-treated control mice receiving Gr1 antibody (125 µg i.p.) or rat IgG control (125 µg i.p.) (n=7–11 mice/group). (F) Abscess area measurements (n=7–11 mice/group) and Kaplan-Meier survival curves (n=10–11 mice/group) in RTX-treated or vehicle-treated control mice receiving Gr1 antibody (125 µg i.p.) or rat IgG control (125 µg i.p.). Statistical analysis: (A, E, F) two-way ANOVA with Bonferroni post-tests, (C) one-way ANOVA with Tukey post-tests. (A, C) vehicle vs RTX = *p < 0.05, **p < 0.01, ***p < 0.001, ****p < 0.0001. (E, F) RTX + IgG vs RTX + Gr1 = *p < 0.05, **p < 0.01, ***p < 0.001, ****p < 0.0001. Mean ± SEM.
(A) BoNT/A local injection at the site of infection blocks S. pyogenes infection. BoNT/A (25 pg in 100 µL) was injected 6 days prior to injection of S. pyogenes M1 (5×10⁶ cfu). Abscess size was measured daily in the flank skin for 14 days (n=5–10 mice/group). (B–C) Local injection of BoNT/A at the site of infection does not block central pain perception. (B) Spontaneous pain behaviors (paw licking/lifting and flinches) quantified over 1 h after injection with S. pyogenes M1 (5×10⁸ cfu) in mice injected subcutaneously 6 days prior to infection with BoNT/A (25 pg in 5 µL) or vehicle alone at the site of bacterial injection (n=6 mice/group). (C) Heat hyperalgesia and mechanical hyperalgesia after infection with S. pyogenes M1 (5×10⁷ cfu) in mice injected subcutaneously 6 days prior to infection with BoNT/A (25 pg in 5 µL) or vehicle alone at the site of bacterial injection (n=5 mice/group). (D–E) Intrathecal injection of BoNT/A blocks pain transmission. (D) Acute spontaneous pain behaviors (paw licking/lifting and flinches) quantified over 1 h after injection with S. pyogenes M1 (5×10⁸ cfu) were quantified in mice treated intrathecally 24 h prior to infection with BoNT/A (25 pg in 5 µL) or vehicle alone (n=6 mice/group). (E) Heat hyperalgesia, the sensitivity to pain evoked by radiant heat (Hargreaves test) and mechanical hyperalgesia, sensitivity to pain evoked by mechanical pressure (von Frey test), were analyzed in mice treated intrathecally with BoNT/A (25 pg in 5 µL) or vehicle 24 h prior to infection with S. pyogenes M1 (5×10⁷ cfu). An additional baseline measurement was performed immediately before infection to ensure the injections did not produce changes in basal threshold (n=4–6 mice/group). (F) Intrathecal administration of BoNT/A does not affect the outcome of S. pyogenes infection. BoNT/A was injected intrathecally (25 pg in 5 µL) 24 h prior to infection with S. pyogenes M1 (5×10⁶ cfu); abscess area was measured daily in mice infected for 14 days (n=5–10 mice/group). Statistical analysis: (A, C, E, F) two-way ANOVA with Bonferroni post-tests, (B, D) unpaired t-test. *p < 0.05, **p < 0.01, ***p < 0.001, ****p < 0.0001. Mean ± SEM.
(A–B) S. pyogenes M1 bacteria were incubated with CGRP8–37 (1 µM), BIBN4096 (1 µM) or CGRP (1 µM) for 1 h in neurobasal medium. Viable bacteria were enumerated by quantitative cultures and quantified as a multiplication factor of surviving colonies relative to starting inoculum (n=4 biological replicates/condition). Similar experiments were conducted for bacteria in neurobasal medium with or without BoNT/A (25 pg in 200 µL) (n=4 biological replicates/condition). (C) Myeloperoxidase (MPO) activity of neutrophils is decreased by CGRP treatment. Mouse neutrophils were incubated in the presence of M1 S. pyogenes and different concentrations of CGRP for 30 minutes at 37°C. Neutrophil supernatant was collected and MPO activity measured (n=3–4 biological replicates/condition). (D) BoNT/A injection or BIBN4096 treatment during infection decreases flank skin and spleen bacterial burdens. Mice infected with S. pyogenes (5×10⁶ cfu M1) were treated with single BoNT/A local injection (25 pg in 50 µL) or BIBN4096 systemic injection (30 mg/kg) 2 h after subcutaneous injection of bacteria. At 9 days after injection of bacteria, flank skin and spleens were isolated, and bacterial load recovery determined (n=6 mice/group). (E) BoNT/A injection or BIBN4096 treatment after infection significantly decreases abscess formation but not weight loss following S. pyogenes infection. Mice were injected with S. pyogenes M1 (5×10⁶ cfu) in the flank followed by post-treatment with either BoNT/A (25 pg in 50 µL) or BIBN4096 (30 mg/kg) 2 h after infection. Abscess area and body weight were measured daily for 14 days (n=6–7 mice/group). (F) Flow cytometry of neutrophil (CD11b+Ly6G+ gates) recruitment in necrotizing lesions 1 day after S. pyogenes M1 injection (5×10⁶ cfu) in mice treated with vehicle, BoNT/A local injection (25 pg in 50 µL), or BIBN4096 systemic injection (30 mg/kg) 2 h after subcutaneous injection of bacteria (n=4–5 mice/group). (G) Mice were treated subcutaneously with BoNT/A or vehicle at day 2 and day 9 following flank injection of S. pyogenes M1 (5×10⁶ cfu), and weight loss was measured over time (n=10 mice/group). Arrows show BoNT/A treatments. Statistical analysis: (A, C, D, F) One-way ANOVA with Tukey post-tests, (B) Unpaired t-test, (E, G) Two-way ANOVA with Bonferroni post-tests. *p < 0.05, **p < 0.01, ****p < 0.0001. (E) BIBN4096 vs vehicle = **p < 0.01, ****p < 0.0001; BoNT/A vs vehicle (†p < 0.05, ††p < 0.01, ††††p < 0.0001). ns=not significant. Mean ± SEM.