

Abstract
In the presented work, raw materials (fruits and leaves) and in vitro biomass of a highly productive Schisandra chinensis Sadova No. 1 cultivar (SchS) were evaluated for the production of therapeutically useful schisandra lignans (SL). In vitro cultures of SchS were initiated, followed by extensive optimization studies focused on maximizing secondary metabolite production, with the aim of establishing a sustainable source of SL. Different cultivation systems (agar, agitated, bioreactor), experiment times (10, 20, 30, 40, 50 and 60 days) and plant growth regulators (6-benzyladenine—BA and 1-naphthaleneacetic acid—NAA, from 0 to 3 mg/l) in Murashige-Skoog (MS) medium were tested. Moreover, an elicitation procedure was applied to bioreactor-grown microshoots in order to increase SL production. Validated HPLC-DAD protocol enabled to detect fourteen SL in the extracts from in vitro and in vivo materials. The main compounds in the in vitro cultures were as follows: schisandrin (max. 176.3 mg/100 g DW), angeloylgomisin Q (max. 85.1 mg/100 g DW), gomisin A (max. 71.4 mg/100 g DW) and angeloylgomisin H (max. 67.0 mg/100 g DW). The highest total SL content (490.3 mg/100 g DW) was obtained in extracts from the biomass of agar cultures cultivated for 30 days on the MS medium variant containing 3 mg/l BA and 1 mg/l NAA. This amount was 1.32 times lower than in fruit extracts (646.0 mg/100 g DW) and 2.04 times higher than in leaf extracts (240.7 mg/100 g DW). The study demonstrated that SchS is a rich source of SL, thus proving its value for medical, cosmetic and food industry.
Electronic supplementary material
The online version of this article (10.1007/s00253-018-8981-x) contains supplementary material, which is available to authorized users.
Keywords: Chinese magnolia vine cultivar, Schisandra lignans, In vitro cultures, Agar culture, Agitated culture, Bioreactor culture, Elicitation
Introduction
Schisandra chinensis (Turcz.) Baill.—the Chinese magnolia vine, or schisandra (Sch)—is a pharmacopoeial species of documented therapeutic importance (Szopa et al. 2017a). The raw material is the schisandra fruit—Schisandrae chinensis fructus; it has monographs not only in the pharmacopoeias of Asian countries (Central Pharmaceutical Affairs Council 2002; Chinese Pharmacopoeia Commission 2005; Committee of the Japanese Pharmacopoeia 2006), but also in the European (European Directorate for the Quality of Medicines 2017) and American Pharmacopoeias (Upton et al. 2011), as well as in the International Pharmacopoeia published by the WHO (World Health Organization 2007). Sch fruits exhibit many valuable biological activities, e.g. hepatoprotective, adaptogenic and ergogenic, antitumour, immunostimulant, anti-inflammatory, anti-ulcer, antioxidant and detoxifying, and also antiviral and antimicrobial. Extracts from the fruit have a positive effect on the functioning of the cardiovascular and respiratory systems, and show anti-osteoporotic and anti-obesity activities (Hancke et al. 1999; Szopa et al. 2017a). They are also used in cosmetic industry as antioxidant, immunostimulant and antiphlogistic agent (Szopa et al. 2016a). The valuable pharmacological and cosmetological properties are determined by the unique chemical composition of Sch. The main group of secondary metabolites which are unique to this species and responsible for its biological activities is dibenzocyclooctadiene lignans, also called ‘schisandra lignans’ (SL) (Opletal et al. 2004).
Hitherto, we have analysed SL in fruit and leaf extracts from Sch (Szopa and Ekiert 2011). Moreover, different types of Sch in vitro cultures (agar, agitated, stationary liquid and bioreactor-grown), were analysed which can be considered as a potential alternative source of aforementioned compounds (Szopa et al. 2016b, 2017b, 2018).
In the present study, a cultivated variety of S. chinensis, namely S. chinensis cv. Sadova No. 1 (further referred to as ‘SchS’), was investigated for SL production. SchS is a Ukrainian cultivar of Sch, which was selected by Ivan Shaitan in the M. M. Grishko National Botanical Garden in Kiev. The SchS cultivar entered the State Register of Plants in Ukraine in 1998 (Shaitan 2005). It was created from selected seeds of wild Sch specimens growing in Primorsk. The resulting plants are characterized by vigorously growing shoots and large clusters of fruits. The fruits have a sour taste, juicy flesh and bright red juice. As compared to original species, the Sadova cultivar is more productive and resistant to harsh climate events (Shaitan 2005). However, according to the data revealed by literature review, little is known about the chemical composition of SchS. The fruits of SchS were shown to contain ascorbic acid, sugars and organic acids (Shaitan 2005), but there are no data on the levels of the main group of schisandra secondary metabolites, i.e. SL. Given the above, aims of the current study were formulated: firstly, to evaluate SL content in leaves and fruits of SchS, following to establish in vitro cultures of SchS for sustainable production of SL.
The biotechnological experiments (upstream procedures) included culture initiation and optimization of the growth conditions in terms of selecting the culture type (agar, agitated, bioreactor—Plantform temporary immersion system), culture duration (10, 20, 30 40, 50, 60 days) and plant growth regulators (PGRs) used (BA and NAA; in the concentration range from 0 to 3 mg/l) in Murashige and Skoog medium (MS, (Murashige and Skoog 1962)). Moreover, in order to increase the production of SL, the elicitation strategy with yeast extract was performed on microshoots cultivated in a Plantform bioreactor.
The high-performance liquid chromatography with diode array detection (HPLC-DAD) was selected for all phytochemical analyses (downstream procedures) which included validation of the method as far as determination of SL was concerned.
To the best of our knowledge, this is the first report describing a phytochemical analysis of SL in fruit and leaf extracts of SchS. Moreover, innovative biotechnological approach was employed in order to establish sustainable production of SL.
Materials and methods
Origin of plant material
The plant material for the study was a specimen of the parent plant—Schisandra chinensis Sadova No. 1 (SchS) growing in a commercial nursery, Clematis—Źródło Dobrych Pnączy Spółka z o.o.—is a limited partnership company with its registered office in Pruszków (ul. Duchnicka 27, 05-800 Pruszków, Poland) (http://www.clematis.com.pl/). The plant was taxonomically verified by the scientific staff of the Clematis arboretum. The plant material consisted of the leaves and fruits of SchS harvested in August 2015. After harvesting, the leaves and fruits were preserved by lyophilization (Labconco lyophilizer).
In vitro cultures
Initiation of in vitro cultures
The material for establishment of in vitro cultures consisted of apical buds (obtained in spring 2015) from the SchS specimen described above (section ‘Origin of plant material’). The plant material was treated with 70% ethanol (30 s); then, it was disinfected with a 0.1% HgCl2 solution for 10 min, washed three times with sterile water and inoculated onto the standard MS (Murashige and Skoog 1962) medium with 0.8% (w/v) agar (plant agar, Duchefa), 3% (w/v) sucrose, 1 mg/l BA (6-benzyladenine) and 0.5 mg/l NAA (1-naphthaleneacetic acid). After approx. 8-weeks, viable, green microshoot cultures were established. The in vitro cultures were maintained at 25 ± 2 °C under continuous artificial illumination at 2.75 W/m2 (LF-40 W lamp, daylight, Piła) and subcultured at 4-week intervals.
Experimental in vitro cultures
Agar microshoot cultures
The study involved cultivating microshoots of SchS. Two types of cultures were tested: stationary (agar) and agitated (liquid). In the stationary system, shoot cultures (Fig. 1; Online resource) were maintained on different variants of the standard MS (Murashige and Skoog 1962) medium with 0.8% (w/v) agar (plant agar, Duchefa) and 3% (w/v) sucrose. The tested media differed with respect to the concentrations of plant growth regulators (PGRs)—BA and NAA (mg/l): 0.1 and 2 (variant B), 0.5 and 2 (variant C), 2 and 0.5 (variant D), 2 and 1 (variant E), 2 and 2 (variant F) and 3 and 1 (variant G). The medium combination without PGRs (control) was designated as variant A. The inoculum was 0.5 g of shoots, taken from the previously established microshoot culture (section ‘Initiation of in vitro cultures’) on the 30th day of the growth cycle. The experimental cultures were maintained in Magenta™ vessels (Sigma, product No. V8630) containing 30 ml of MS medium. Microshoots were grown under continuous white light (2.75 W/m2), at 25 ± 2 °C, over 60-day growth periods. The biomass was collected at 10-day intervals, after 10, 20, 30, 40, 50 and 60 days of the experiment.
Fig. 1.


Morphological appearance of S. chinensis cv. Sadova microshoots grown for 10–60 days on different MS (Murashige and Skoog) agar media variants: A—control (without PGRs), B—0.1 mg/l BA and 2 mg/l NAA, C—0.5 mg/l BA and 2 mg/l NAA, D—2 mg/l BA and 0.5 mg/l NAA, E—2 mg/l BA and 1 mg/l NAA, F—2 mg/l BA and 2 mg/l NAA, G—3 mg/l BA and 1 mg/l NAA
Agitated microshoot cultures
Agitated microshoot cultures (Fig. 2) were cultivated in 300 ml Erlenmeyer flasks containing 100 ml of MS medium, on a rotary shaker (Altel) at 140 rpm. The inoculum was composed of 1.5 g microshoot sections (prepared as described in ‘Agar microshoot cultures’). The agitated cultures were maintained on two variants (F and G, as described in ‘Agar microshoot cultures’) of the standard liquid MS (Murashige and Skoog 1962) medium with 3% (w/v) sucrose and containing respectively: 2 mg/l BA and 2 mg/l NAA—variant F, and 3 mg/l BA and 1 mg/l NAA—variant G (the choice of growth regulator compositions was made due to the fact that these variants had the best growth and production results for agar cultures).
Fig. 2.

Morphological appearance of S. chinensis cv. Sadova agitated microshoots grown for 10–60 days in different liquid media variants: F—2 mg/l BA and 2 mg/l NAA, G—3 mg/l BA and 1 mg/l NAA
The nutrient media and biomass samples from the agitated cultures were collected at 10-day intervals on 10, 20, 30, 40, 50 and 60 day of the culture. SchS microshoots were grown under continuous white light (2.75 W/m2), at of 25 ± 2 °C.
Bioreactor cultures
SchS shoots were grown for 30 days in the Plantform temporary immersion system (Plant Form, Sweden) (Fig. 3), following the protocol described previously (Szopa et al. 2017b). The bioreactor was inoculated at 15/500 (g/ml) microshoots to medium ratio (variant G of MS medium of 3 mg/l BA and 1 mg/l NAA) (the best growth and production medium for SchS microshoots). The immersion cycle was set to 5 min every 1.5 h, at 1.0 vvm aeration rate.
Fig. 3.

S. chinensis cv. Sadova microshoots grown for 30 days in temporary immersion system (Plantform bioreactor) on MS medium variant G (3 mg/l BA and 1 mg/l NAA)
For the Plantform bioreactor experiments, an elicitation with 1000 mg/l of yeast extract (YE) (plant cell culture tested, Sigma-Aldrich), added on day 20 of the 30-day growth period, was applied, according to elicitation protocol described previously (Szopa et al. 2018). The YE for the elicitor treatments was steam-sterilized (120 °C, 20 min, 1 bar) prior to use. For elicitation, one of the side hose nipples of the Plantform bioreactor was used as an inlet port. Samples of the microshoots and the media were collected on day 30 of the experiment.
Chromatographic assays
Extraction
For the preparation of methanolic extracts, 0.3 g portions of lyophilized (Labconco lyophilizer) and pulverized matrices (intact plant material and biomass from in vitro cultures) were weighed out. The material was subjected to extraction with 5-ml methanol (STANLAB, Poland) by sonication in an ultrasonic bath (POLSONIC 2, Poland) for 30 min. Freeze-dried samples of the experimental media from agitated and bioreactor cultures were also subjected to extraction in this manner. The obtained extracts were filtered through sterilizing syringe filters (0.22 μm, Millex®GP, Millipore) prior to HPLC analysis.
Phytochemical analysis
Analysis of dibenzocyclooctadiene lignans (SL) was performed by HPLC-DAD according to the method originally developed by Zhang et al. (Zhang et al. 2009) for Sch fruits, and subsequently adapted for Sch in vitro cultures in the course of our previous work (Szopa et al. 2016b). The Hitachi LaChrom Elite® HPLC system was used equipped with a DAD detector L-2455, column oven L-2350 and autosampler L-2200r. Separation was performed using a Kinetex™ C-18 analytical column (150 × 4.6 mm, 2.6-μm particle size; Phenomenex, USA) at 30 °C. The mobile phase consisted of acetonitrile (A) and water (B), with a flow-rate of 0.8 ml/min. The gradient program was as follows: 0–4 min, 40–45; 4–12 min, 45–50; 12–16 min, 50–68; 16–20 min, 68–75; 20–25 min, 75–95 (% B), with a hold time of 15 min; injection volume was 5 μl. Detection wavelength was set at 225 nm. Identification and quantification were made by comparison of UV spectra and retention times with nine standards: gomisin A, deoxyschisandrin, schisandrin and γ-schisandrin (ChromaDex®, USA), gomisin G and schisantherin A (PhytoLab GmbH & Co. KG, Germany), schisandrin C, schisantherin B and schisanthenol (ChemFaces Biochemical Co. Ltd., China). Additionally, based on our previous studies (Szopa et al. 2016b), quantification of five tentatively identified compounds, schisandrin B, benzoylgomisin P, angeloyl-/tigloylgomisin H, angeloyl-/tigloylgomisin Q, schisantherin D (or one of its stereoisomers—benzoylgomisin O or benzoylisogomisin O) (based on HPLC-DAD-ESI/MS analyses), was performed using the calibration curve for schisandrin, as the main component of the group of SL. The representative HPLC-UV chromatogram (λ = 225 nm) of a methanol extract of SchS biomass cultivated in vitro was presented in Fig. 4.
Fig. 4.
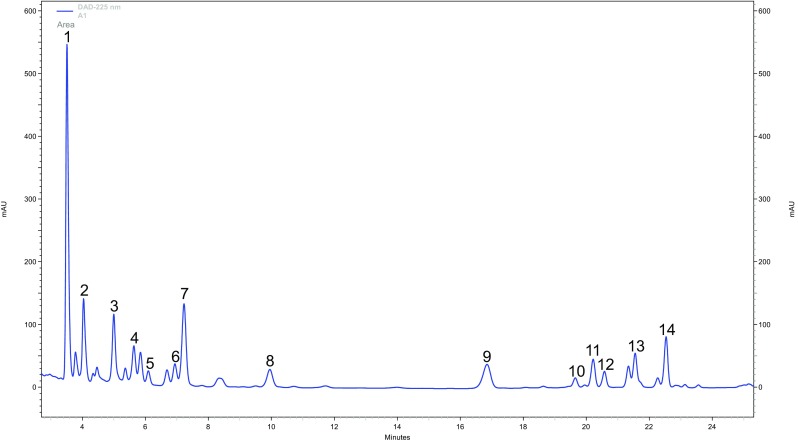
The representative HPLC-UV chromatogram (λ = 225 nm) of a methanol extract of S. chinensis cv. Sadova biomass cultivated in vitro. SL: 1—schisandrin, 2—gomisin, 3—angeloyl-/tigloylgomisin, 4—angeloyl-/tigloylgomisin Q, 5—gomisin G, 6—schisantherin A, 7—schisantherin B, 8—schisanthenol, 9—deoxyschisandrin, 10—schisandrin B, 11—γ-schisandrin, 12—benzoylgomisin P, 13—schisandrin, 14—schisantherin D
Validation
Validation of the HPLC-DAD method was performed by determination of accuracy, precision, linearity, limit of detection and limit of quantification (European Medicines Agency 2005).
Accuracy
Accuracy was determined based on sample analysis of known concentrations and comparing the results obtained by a validated method with true values, followed by calculation of the recovery percentage. Determinations were performed at three concentration levels: 80, 100 and 120%, for each of them three repetitions were done.
Precision
Precision of the method was determined at three levels of substance concentrations in reference solutions: 50, 100 and 150%. For each level of concentration, three repetitions were done.
Linearity
Linearity was determined by comparing the relationship between peak area and a concentration of the tested substances (mg/ml). Two series of assays in the following concentration range were made for deoxyschisandrin: from 0.0039 to 1.0000 mg/ml, for γ-schisandrin: from 0.0013 to 1.0000 mg/ml and in the following concentration ranges: 0.0200 to 0.2000 mg/ml for other SL.
Limit of detection and limit of quantification
The limit of detection (LOD) and limit of quantification (LOQ) were determined from the linearity in the following concentration ranges: from 0.0039 to 0.0312 mg/ml for deoxyschisandrin, from 0.0013 to 0.0050 mg/ml for γ-schisandrin and from 0.0200 to 0.1000 mg/ml for other SL, using the following formulas: LOD = 3.3 × Sy/a, LOQ = 10 × Sy/a, where Sy is the estimation error and a is the slope.
Statistical analysis
The data presented, were organized with independent samples (three replications). Analyses and measurements of each sample were performed in triplicate and average values were used for statistical evaluation. The significant differences in the individual and total contents of estimated SL contents were compared with the one-way analysis of variance (one-way ANOVA). For comparison and contrast between different amounts, post hoc Tukey HSD (honestly significant difference) test was used. Outcomes demonstrating p < 0.05 were considered statistically significant. Data analysis was performed using STATISTICA 13 PL (StatSoft) software.
The experiments have been repeated thrice. The results were presented as mean ± standard deviation (SD). The STATISTICA version 13 PL software package (StatSoft) was used for the analysis.
Results
Validation setup
The validation results presented in Table 1 indicate that the proposed HPLC-DAD method is characterized by high sensitivity; LOD for deoxyschisandrin is 0.0089 mg/ml, 0.0050 mg/ml for schisandrin, 0.0120 mg/ml for gomisin A, 0.0048 mg/ml for γ-schisandrin, 0.0044 mg/ml for schisandrin C, 0.0095 mg/ml for schisanthenol, 0.0151 mg/ml for schisantherin B, 0.0103 mg/ml for gomisin G and 0.0093 mg/ml for schisantherin A. LOQ was estimated at 0.0269, 0.0151, 0.0372, 0.0145, 0.0133, 0.0288, 0.0457, 0.0312, 0.0185 and 0.0282 mg/ml, respectively. Percentage recovery of the studied compounds presented as mean values for three concentration levels is high and ranges from 95.77 to 103.90%. Satisfactory precision determined for three concentration levels is confirmed by the values of variability coefficients RSD which are in the range from 0.21 to 2.96%. Linearity of the tested substances was preserved in a wide range: from 0.0039 to 1.0000 mg/ml for deoxyschisandrin, from 0.0013 to 1.0000 mg/ml for γ-schisandrin and in the following concentration ranges: 0.0200 to 0.2000 mg/ml for other substances.
Table 1.
Validation of the developed methods with statistical evaluation for HPLC method
| Validation parameters | Schisandrin | Gomisin A | Gomisin G | Schisantherin A | Schisantherin B | Schisanthenol | Deoxy-schisandrin | γ-Schisandrin | Schisandrin C |
|---|---|---|---|---|---|---|---|---|---|
|
t
R
[min] |
3.373 | 3.833 | 5.693 | 6.073 | 7.133 | 7.533 | 16.273 | 20.093 | 20.293 |
| LOD [mg/ml] |
0.0050 Sy = 159,600 a = 105,634,056 |
0.0120 Sy = 581,800 a = 156,478,588 |
0.0103 Sy = 554,300 a = 177,487,349 |
0.0093 Sy = 211,000 a = 14,907,025 |
0.0151 Sy = 550,000 a = 120,405,034 |
0.0095 Sy = 448,300 a = 155,693,204 |
0.0089 Sy = 541,700 a = 201,407,288 |
0.0048 Sy = 451,300 a = 309,168,100 |
0.0044 Sy = 195,200 a = 147,188,677 |
| LOQ [mg/ml] |
0.0151 | 0.0372 | 0.0312 | 0.0282 | 0.0457 | 0.0288 | 0.0269 | 0.0145 | 0.0133 |
| Recovery 80% [%] |
= 98.70 Sx = 0.721 RSD = 0.73% |
= 101.77 Sx = 0.416 RSD = 0.41% |
= 96.17 Sx = 0.666 RSD = 0.69% |
= 103.60 Sx = 0.656 RSD = 0.63% |
= 100.30 Sx = 0.656 RSD = 0.65% |
= 10,197 Sx = 0.351 RSD = 0.34% |
= 96.50 Sx = 0.458 RSD = 0.47% |
= 98.97 Sx = 0.702 RSD = 0.71% |
= 101.77 Sx = 0.306 RSD = 0.30% |
| Recovery 100% [%] |
= 102.93 Sx = 0.305 RSD = 0.30% |
= 101.73 Sx = 0.208 RSD = 0.20% |
= 95.77 Sx = 0.451 RSD = 0.47% |
= 102.10 Sx = 0.781 RSD = 0.76% |
= 101.60 Sx = 0.400 RSD = 0.39% |
= 101.63 Sx = 0.577 RSD = 0.57% |
= 103.07 Sx = 0.751 RSD = 0.73% |
= 102.90 Sx = 0.520 RSD = 0.50% |
= 101.90 Sx = 0.400 RSD = 0.39% |
| Recovery 120% [%] |
= 98.60 Sx = 0.794 RSD = 0.80% |
= 99.33 Sx = 0.666 RSD = 0.67% |
= 99.43 Sx = 1.050 RSD = 1.06% |
= 103.57 Sx = 0.404 RSD = 0.39% |
= 101.10 Sx = 0.500 RSD = 0.49% |
= 98.67 Sx = 0.289 RSD = 0.29% |
= 103.00 Sx = 1.389 RSD = 1.35% |
= 101.97 Sx = 0.351 RSD = 0.34% |
= 99.00 Sx = 0.624 RSD = 0.63% |
| Precision 50% c [mg/ml] |
= 0.0513 Sx = 0.00059 RSD = 1.14% |
= 0.0507 Sx = 0.00058 RSD = 1.14% |
= 0.0585 Sx = 0.00026 RSD = 0.45% |
= 0.0605 Sx = 0.00117 RSD = 1.93% |
= 0.0509 Sx = 0.00016 RSD = 0.32% |
= 0.0503 Sx = 0.000675 RSD = 1.34% |
= 0.0509 Sx = 0.00026 RSD = 0.52% |
= 0.0618 Sx = 0.00045 RSD = 0.73% |
= 0.0493 Sx = 0.00055 RSD = 1.11% |
| Precision 100% c [mg/ml] |
= 0.1004 Sx = 0.00051 RSD = 0.51% |
= 0.1121 Sx = 0.00332 RSD = 2.96% |
= 0.1181 Sx = 0.00185 RSD = 1.57% |
= 0.1002 Sx = 0.00038 RSD = 0.19% |
= 0.1075 Sx = 0.00134 RSD = 1.25% |
= 0.1101 Sx = 0.00044 RSD = 0.40% |
= 0.1080 Sx = 0.00195 RSD = 1.80% |
= 0.1286 Sx = 0.00067 RSD = 0.52% |
= 0.1043 Sx = 0.00176 RSD = 1.68% |
| Precision 150% c [mg/ml] |
= 0.1491 Sx = 0.00055 RSD = 0.37% |
= 0.1503 Sx = 0.00051 RSD = 0.34% |
= 0.1588 Sx = 0.00112 RSD = 0.71% |
= 0.1491 Sx = 0.00342 RSD = 2.30% |
= 0.1500 Sx = 0.00032 RSD = 0.21% |
= 0.1492 Sx = 0.00056 RSD = 0.37% |
= 0.1472 Sx = 0.00407 RSD = 2.76% |
= 0.1562 Sx = 0.00067 RSD = 0.34% |
= 0.1489 Sx = 0.00069 RSD = 0.46% |
| Linearity |
p = 89,385,107⋅c+244,667 r = 0.99123 |
p = 157,638,344⋅c−321,533 r = 0.99855 |
p = 177,427,247⋅c−261,938 r = 0.99499 |
p = 66,683,463⋅c+909,038 r = 0.99801 |
p = 131,735,836⋅c−189,436 r = 0.99794 |
p = 192,658,623⋅c−1,571,419 r = 0.99418 |
p = 125,167,085⋅c+1,309,458 r = 0.99910 |
p = 317,038,545⋅c+4,655,729 r = 0.99851 |
p = 156,110,000⋅c−591,466 r = 0.999592 |
tR retention time, mean value, Sx standard deviation, RSD relative standard deviation, c concentration [mg/ml], Sy standard error of the estimate, a the slope of regression line
Phytochemical analysis of plant material
Fruits
The SchS fruit extracts were found to contain all of the 14 lignans analysed. The concentrations of the individual compounds varied within a broad range from 2.6 to 166.8 mg/100 g DW (dry weight). In quantitative terms, the dominant metabolites were as follows: schisandrin (166.8 mg/100 g DW), γ-schisandrin (96.2 mg/100 g DW), gomisin A (72.4 mg/100 g DW), angeloylgomisin H (71.6 mg/100 g DW) and schisantherin B (56.8 mg/100 g DW). The total SL content in fruit extracts was 646.0 mg/100 g DW (Table 2).
Table 2.
Schisandra lignans contents (mg/100 g DW±SD) in fruit and leaves extracts of S. chinensis cv. Sadova and S. chinensis
| Lignans | S. chinensis cv. Sadova | S. chinensis* | ||
|---|---|---|---|---|
| Fruits | Leaves | Fruits | Leaves | |
| Schisandrin | 166.8 ± 11.0bcd | 55.1 ± 3.6acd | 132.4 ± 9.4abd | 29.7 ± 1.4abc |
| Gomisin A | 72.4 ± 12.2bcd | 12.5 ± 3.7acd | 109.4 ± 8.3abd | 34.5 ± 2.2abc |
| Angeloyl-/tigloylgomisin H | 71.6 ± 8.3bcd | 31.4 ± 1.5acd | 161.9 ± 10.1abd | 51.2 ± 5.8abc |
| Angeloyl-/tigloylgomisin Q | 24.5 ± 6.3bcd | 13.4 ± 0.4acd | 52.3 ± 4.9abd | 8.2 ± 1.1abc |
| Gomisin G | 4.8 ± 0.4bcd | 1.9 ± 0.3acd | 46.1 ± 3.1ab | 49.1 ± 2.9ab |
| Schisantherin A | 19.5 ± 2.3bcd | 3.5 ± 0.2acd | 25.5 ± 2.5ab | 25.9 ± 3.1ab |
| Schisantherin B | 56.8 ± 8.2bcd | 4.6 ± 0.5acd | 4.7 ± 1.0ad | 3.4 ± 0.3abc |
| Schisanthenol | 2.6 ± 0.2bcd | 1.4 ± 0.2acd | 3.6 ± 0.4abd | 2.7 ± 0.5bc |
| Deoxyschisandrin | 31.2 ± 2.5bcd | 16.1 ± 2.7acd | 60.7 ± 5.2abd | 41.1 ± 3.8abc |
| Schisandrin B | 58.9 ± 3.5bd | 11.9 ± 2.1acd | 56.8 ± 3.1bc | 21.8 ± 1.3abc |
| γ-Schisandrin | 96.2 ± 4.0bcd | 24.5 ± 1.7ac | 66.5 ± 2.5abd | 22.3 ± 2.0ac |
| Benzoylgomisin P | 12.4 ± 1.9bd | 23.0 ± 2.8acd | 13.4 ± 0.4ab | 14.4 ± 1.1ab |
| Schisandrin C | 7.0 ± 0.2bd | 10.1 ± 0.3ac | 6.1 ± 1.1abd | 10.9 ± 1.3ac |
| Schisantherin D | 21.3 ± 2.3bcd | 31.3 ± 2.3acd | 15.2 ± 0.9abd | 7.8 ± 0.4abc |
| Total content | 646.0 ± 63.3bcd | 240.7 ± 22.3acd | 754.6 ± 52.8abd | 322.8 ± 27.1abc |
*According to Szopa et al. 2016b
ap < 0.05 vs. S. chinensis cv. Sadova Fruits
bp < 0.05 vs. S. chinensis cv. Sadova Leaves
cp < 0.05 vs. S. chinensis Fruits
dp < 0.05 vs. S. chinensis Leaves
Leaves
The SchS leaf extracts were found to contain all of the 14 lignans analysed. The concentrations of the individual compounds varied within a broad range from 1.4 to 55.1 mg/100 g DW. The main metabolites were as follows: schisandrin (55.1 mg/100 g DW), angeloylgomisin H (31.4 mg/100 g DW), schisantherin D (31.3 mg/100 g DW) and γ-schisandrin (24.5 mg/100 g DW). The total SL content in leaf extracts was 240.7 mg/100 g DW (Table 2).
Phytochemical analysis of in vitro cultures
Agar microshoot cultures
Microshoots growing on the six agar variants of MS medium, containing different concentrations of PGRs, especially on variants F and G, were characterized by a large number of microshoots and a dark green color of the leaves. The shoots growing on variant A of MS medium (control without PGRs) had a smaller number of microshoots and a pale green colour (Fig. 1). The resulting values of the growth index (Gi) ranged from 2.3 to 8.7, depending on the medium variant and culture duration. The highest values were obtained for microshoots cultivated for 60 days on variant G of the medium (Table 3).
Table 3.
Changes in growth index–Gi (calculated according to the formula: Gi = [(Dw1 − Dw0)/Dw0] where Dw1 is the dry weight of microshoots at the end of experiment and Dw0 is the dry weight of the inoculum), of S. chinensis cv. Sadova biomass from all tested in vitro systems (agar, agitated and Plantform bioreactor-grown cultures). Values represent the mean ± SD of four samples
| Type of S. chinensis cv. Sadova microshoot cultures | MS medium variant* | Culture growth period | |||||
|---|---|---|---|---|---|---|---|
| 10 days | 20 days | 30 days | 40 days | 50 days | 60 days | ||
| Agar | A | 2.7 ± 0.1cdef | 2.9 ± 0.2cdef | 3.5 ± 0.1abef | 3.5 ± 0.4abef | 3.8 ± 0.3abcdf | 3.9 ± 0.6abcde |
| B | 2.5 ± 0.1bcdef | 3.8 ± 0.3acdef | 4.4 ± 0.2abdef | 4.0 ± 0.6abcef | 5.2 ± 0.5abcdf | 5.7 ± 0.3abcde | |
| C | 2.5 ± 0.3bcdef | 4.1 ± 0.2acdef | 3.7 ± 0.5abef | 3.7 ± 0.2abef | 7.2 ± 0.2abcdf | 5.7 ± 0.3abcde | |
| D | 2.5 ± 0.1bcdef | 3.5 ± 0.5adef | 3.5 ± 0.2adef | 4.1 ± 0.5abcef | 4.9 ± 0.1abcdf | 6.3 ± 0.8abcde | |
| E | 2.3 ± 0.2bcdef | 2.8 ± 0.2acdef | 3.1 ± 0.3abdef | 5.0 ± 0.6abced | 6.1 ± 0.1abcdf | 5.8 ± 0.3abcde | |
| F | 2.5 ± 0.1bcdef | 3.2 ± 0.6acdef | 3.6 ± 0.3abdef | 5.6 ± 0.8abcef | 5.3 ± 0.2abcdf | 6.8 ± 0.7abcde | |
| G | 2.8 ± 0.1bcdef | 3.4 ± 0.5acdef | 4.8 ± 0.6abdef | 6.8 ± 0.2abcef | 7.1 ± 0.1abcdf | 8.7 ± 0.6abcde | |
| Agitated | F | 1.9 ± 0.1bcdef | 2.3 ± 0.2acdf | 2.9 ± 0.4abdef | 3.4 ± 0.5abcef | 2.3 ± 0.1acdf | 7.5 ± 0.4abcde |
| G | 1.4 ± 0.1bcdef | 2.5 ± 0.2acef | 2.2 ± 0.6abdef | 2.6 ± 0.09abcef | 4.4 ± 0.2abcdf | 4.1 ± 0.2abcde | |
| Plantform | G | nt | nt | 4.6 ± 0.9 4.7 ± 0.1** |
nt | nt | nt |
nt not tested
*See ‘Materials and methods’; **Gi of microshoots after elicitor (YE) treatment
ap < 0.05 vs. 10-day growth period
bp < 0.05 vs. 20-day growth period
cp < 0.05 vs. 30-day growth period
dp < 0.05 vs. 40-day growth period
ep < 0.05 vs. 50-day growth period
fp < 0.05 vs. 60-day growth period
The experiments on the accumulation of SL in SchS agar cultures were carried out on six variants of MS medium with different concentrations of PGRs: BA and NAA (variants B–G), and a medium containing no PGRs as control conditions (variant A). The PGRs applied in the tested variants of MS medium as well as the duration of the culture cycle significantly influenced the amounts of all the 14 lignans analysed in the cultured biomass.
Detailed data on the amounts of SL obtained on the tested MS media variants after each duration of the growth period is included in supplementary materials as Tables S1–S6 (Online resource). Based on the analyses, considerable differences in the amounts of individual compounds and in their total content were found depending on the combination of the PGRs used in the culture medium. The amounts of the individual SL varied within very wide limits, e.g. for schisandrin from 25.6 to 176.3 mg/100 g DW, for schisantherin B from 7.2 to 50.1 mg/100 g DW and for the total content from 125.3 to 490.3 mg/100 g DW (Table 4). Higher SL content was obtained in extracts from the biomass grown on variants B–G than in extracts of the biomass grown on variant A (Tables S1–S6). The quantitatively dominant lignans in extracts from the agar cultures were as follows: schisandrin (max. 176.3 mg/100 g DW, variant E, culture duration—30 days), angeloylgomisin Q (max. 85.1 mg/100 g DW, variant E, culture duration—50 days), schisantherin B (max. 50.1 mg/100 g DW, variant E, culture duration—10 days), gomisin A (max 49.6 mg/100 g DW, variant G, culture duration—30 days) and deoxyschisandrin (max. 34.1 mg/100 g DW, variant G, culture duration—30 days) (Table 4).
Table 4.
The comparison of schisandra lignans yielding in S. chinensis cv. Sadova agar microshoot cultures—changes in dependence on applied duration of growth period and media variants. Results correspond to Tables 2 and S1–S6
| Lignans | Content (mg/100 g DW) min.–max. | Increase (fold) | Optimal growth period (days) | Optimal medium variant* | Gi for optimal conditions |
|---|---|---|---|---|---|
| Schisandrin | 25.6–176.3 | 6.9 | 30 | E | 3.1 |
| Gomisin A | 8.7–49.6 | 5.7 | 30 | G | 4.8 |
| Angeloyl-/tigloylgomisin H | 13.5–67.0 | 5.0 | 10 | E | 2.3 |
| Angeloyl-/tigloylgomisin Q | 10.8–85.1 | 7.9 | 50 | E | 6.1 |
| Gomisin G | 3.7–20.5 | 5.5 | 50 | G | 7.1 |
| Schisantherin A | 1.2–13.7 | 11.7 | 10 | E | 2.3 |
| Schisantherin B | 7.2–50.1 | 6.9 | 10 | E | 2.3 |
| Schisanthenol | 0.2–3.2 | 14.0 | 50 | G | 7.1 |
| Deoxyschisandrin | 12.0–34.1 | 2.9 | 30 | G | 4.8 |
| Schisandrin B | 3.1–27.4 | 8.7 | 40 | G | 6.8 |
| γ-Schisandrin | 1.6–22.8 | 14.7 | 60 | D | 6.3 |
| Benzoylgomisin P | 4.4–39.8 | 9.0 | 50 | G | 7.1 |
| Schisandrin C | 1.9–18.4 | 9.5 | 60 | G | 8.7 |
| Schisantherin D | 2.9–58.7 | 20.0 | 10 | E | 2.3 |
| Total content | 125.3–490.3 | 4.6 | 30 | E | 4.8 |
*See ‘Materials and methods’
The maximum total SL content (574.4 mg/100 g DW) was found after 10 days of growth on variant E of the culture medium. However, the biomass growth during this period was low (Gi = 2.3). High production of SL (490.3 mg/100 g DW) was also found on the same MS medium variant in extracts from the microshoots harvested after 30 days, for which the Gi factor was higher (Gi = 4.8) (Tables 4 and S3). After that period, the observed increase in SL in the microshoot cultures was the highest (Fig. 5). High total amounts of lignans were also obtained in the microshoots after 30 days of their cultivation on variants E and F of MS medium. The lowest total SL content was found after 20 days of culture on variant C. Greater amounts of lignans were obtained in biomasses grown on the test variants D, E, F and G than on the control medium, variant A (containing no PGRs). The results on variants B and C were comparable with the control (Table 4, Fig. 5).
Fig. 5.

The dynamic of schisandra lignans accumulation in agar S. chinensis cv. Sadova microshoots cultures based on their total contents with relation to the duration of growth period and applied MS medium variants
Agitated microshoot cultures
The appearance of the biomass in the agitated shoot cultures depended on the variant of MS medium and the duration of the culture cycle. The largest increases in biomass were found after 60 days of culture on variant F, and the smallest after 10 days of culture on variant G (Fig. 2). Depending on the medium variant and culture duration, the obtained increases in dry biomass, expressed by the growth index (Gi), ranged from 1.4 to 7.5 times. The highest increases were obtained for cultures cultivated for 60 days on variant H (Table 3).
Based on the HPLC-DAD analyses, considerable differences were found in the amounts of the individual compounds as well as in their total amount, depending on the combination of PGRs used in the culture medium. The amounts of the individual SL varied within very wide limits, e.g. for schisandrin from 26.8 to 112.3 mg/100 g DW, for schisantherin B from 9.6 to 29.9 mg/100 g DW and for the total content from 112.0 to 414.8 mg/100 g DW (Table 5).
Table 5.
The comparison of schisandra lignans yielding in S. chinensis cv. Sadova agitated microshoot cultures—changes in dependence on applied duration of growth period and media variants. Results correspond to Tables 2 and S7–S12
| Lignans | Content (mg/100 g DW) min.–max. | Increase (fold) | Optimal growth period (days) | Optimal medium variant* | Gi for optimal conditions |
|---|---|---|---|---|---|
| Schisandrin | 26.8–112.3 | 4.2 | 30 | G | 2.2 |
| Gomisin A | 17.6–71.4 | 4.1 | 30 | G | 2.2 |
| Angeloyl-/tigloylgomisin H | 11.9–44.8 | 3.8 | 30 | G | 2.2 |
| Angeloyl-/tigloylgomisin Q | 4.0–31.2 | 7.9 | 30 | F | 2.9 |
| Gomisin G | 1.3–9.5 | 7.2 | 20 | G | 2.5 |
| Schisantherin A | 1.4–7.5 | 5.2 | 30 | G | 2.2 |
| Schisantherin B | 9.6–29.9 | 3.1 | 30 | G | 2.2 |
| Schisanthenol | 0.7–8.4 | 11.6 | 30 | G | 2.2 |
| Deoxyschisandrin | 12.4–27.3 | 2.2 | 20 | G | 2.5 |
| Schisandrin B | 0.1–11.5 | 114.9 | 30 | F | 2.9 |
| γ-Schisandrin | 1.3–10.5 | 8.0 | 20 | G | 2.5 |
| Benzoylgomisin P | 2.4–22.0 | 9.2 | 30 | F | 2.9 |
| Schisandrin C | 0.5–6.1 | 11.4 | 20 | F | 2.3 |
| Schisantherin D | 2.4–22.3 | 9.2 | 30 | G | 2.2 |
| Total content | 120.0–414.8 | 3.5 | 30 | G | 2.2 |
*See ‘Materials and methods’
The quantitatively dominant SL in extracts from the biomass of the agitated cultures were as follows: schisandrin (max. 112.3 mg/100 g DW, variant G, culture duration—30 days), gomisin A (max. 71.4 mg/100 g DW, variant G, culture duration—30 days), angeloylgomisin H (max. 44.8 mg/100 g DW, variant G, culture duration—30 days), angeloylgomisin Q (max. 31.2 mg/100 g DW, variant F, culture duration—30 days), schisantherin B (max. 29.9 mg/100 g DW, variant G, culture duration—30 days) and deoxyschisandrin (max. 27.3 mg/100 g DW, variant G, culture duration—20 days) (Tables S7–S12, and Table 5). Extracts from the culture media were found to contain only trace amounts of SL (less than 0.1 mg/l).
The maximum total SL content in extracts from agitated microshoot cultures was obtained after 30 days of cultivation on variant G (Table 5 and Fig. 6). The lowest total SL content was found after 60 days of cultivation on variant F medium. The 30-day growth period and application of variant G of MS medium yielded the most satisfactory results in terms of culture growth and SL accumulation (Fig. 6).
Fig. 6.

The dynamic of schisandra lignans accumulation in agitated S. chinensis cv. Sadova microshoots cultures based on their total contents with relation to the duration of growth period and applied MS medium variants
Bioreactor cultures
The best conditions determined on the basis of the results of SL accumulation obtained during the testing of agitated cultures were chosen for the bioreactor-grown microshoot cultures of SchS. The most favorable medium was the MS variant G and a 30-day growth period. Based on the observations of microshoot morphology, vital growth of tissue under cultivation in the temporary immersion system was found (Fig. 3). The growth increments, expressed as Gi, were high, equal to 4.6 (Table 6).
Table 6.
Schisandra lignans contents (mg/100 g DW±SD) in extracts from microshoots S. chinensis cv. Sadova cultivated in Plantform temporary immersion system on MS variant G for 30-day growth periods (n = 3). I—microshoots without elicitation; II—microshoots elicitated with 1 g/l of YE (yeast extract) on the 20th day of growth period
| Lignans | I | II | Increase (fold) |
|---|---|---|---|
| Schisandrin | 115.3 ± 1.4b | 144.4 ± 2.8a | 1.3 |
| Gomisin A | 27.9 ± 1.3b | 42.6 ± 0.7a | 1.5 |
| Angeloyl-/tigloylgomisin H | 30.0 ± 0.7b | 45.1 ± 9.6a | 1.5 |
| Angeloyl-/tigloylgomisin Q | 18.3 ± 0.2b | 22.3 ± 0.7a | 1.2 |
| Gomisin G | 9.5 ± 0.2b | 12.0 ± 1.6a | 1.3 |
| Schisantherin A | 4.1 ± 0.1b | 5.0 ± 0.2a | 1.2 |
| Schisantherin B | 35.6 ± 0.5b | 44.2 ± 4.6a | 1.2 |
| Schisanthenol | 1.1 ± 0.2 | 1.4 ± 0.5 | 1.4 |
| Deoxyschisandrin | 9.6 ± 0.2b | 13.2 ± 1.1a | 1.4 |
| Schisandrin B | 9.1 ± 0.2b | 11.0 ± 0.4a | 1.2 |
| γ-Schisandrin | 2.3 ± 0.1b | 2.8 ± 0.1a | 1.3 |
| Benzoylgomisin P | 12.3 ± 0.2b | 15.4 ± 0.5a | 1.3 |
| Schisandrin C | 16.6 ± 0.4b | 20.8 ± 0.6a | 1.3 |
| Schisantherin D | 22.0 ± 0.3b | 28.2 ± 0.5a | 1.3 |
| Total content | 313.5 ± 6.1b | 408.3 ± 23.9a | 1.3 |
ap < 0.05 vs. I—microshoots without elicitation
bp < 0.05 vs. II—microshoots elicitated with 1 g/l of YE (yeast extract) on the 20th day of growth period
The dominant compounds in extracts from the microshoots not subjected to elicitation were as follows: schisandrin (115.3 mg/100 g DW), schisantherin B (35.6 mg/100 g DW) and angeloylgomisin H (30.1 mg/100 g DW) (Table 6). The total SL content was 313.5 mg/100 g DW.
The experiment with Plantform bioreactor-grown microshoots was expanded to include elicitor treatments using 1 g/l YE on day 20 of biomass growth. In extracts from the elicited microshoots, the amounts of the individual compounds increased from 1.22- to 1.53-fold (Table 6). The dominant compounds were as follows: schisandrin (144.3 mg/100 g DW), schisandrin B (44.2 mg/100 g DW), gomisin A (42.6 mg/100 g DW) and angeloylgomisin H (45.1 mg/100 g DW). The total content was 408.3 mg/100 g DW, which was 1.30 times higher than in extracts from the microshoots not subjected to elicitation (Table 6). The Plantform culture media were found to contain only trace amounts of SL (less than 0.1 mg/l).
Discussion
The results of chromatographic analyses of SL in extracts from fruits and leaves of SchS showed that the qualitative composition of lignan fraction was the same as in the Sch plant matrices analysed by Szopa et al. (Szopa et al. 2016b). However, the two plants differed with respect to the amounts of individual compounds. Importantly, higher concentrations of the analysed SL were found in the schisandra cultivar. The amounts of SL in the extracts from fruits and leaves of SchS were 1.17- and 1.34-fold higher, respectively, than in the extracts from the basic species (Sch) which is widely distributed and utilized as a medicinal plant (Table 2).
The same lignans were dominant in extracts from the fruits of both plants, namely schisandrin, gomisin A, angeloylgomisin H and γ-schisandrin. However, the schisandrin and γ-schisandrin contents in SchS fruit extracts were respectively 1.26- and 1.45-fold higher, and those of gomisin A and angeloylgomisin H respectively 1.51- and 2.26-fold lower than in Sch fruit extracts. The schisantherin B content in SchS fruit extracts was 12-fold higher.
In extracts from the leaves of Sch and SchS, different lignans were shown to prevail. SchS leaf extracts were found to contain greater amounts of some of SL: 1.86 times more schisandrin and 4.02 times more schisantherin D (Table 2).
In the light of the presented comparative phytochemical studies, SchS proved to contain higher amounts of SL than the parent species (Sch). Given the fact that these compounds largely determine the therapeutic properties of Schisandra species, SchS can be proposed as a new raw material for pharmaceutical use. However, broader phytochemical studies are required to evaluate SchS for the presence of other biologically active metabolites like phenolics and polysaccharides. The results encourage further phytochemical studies on SchS.
Literature data confirm the fact that cultivated varieties of medicinal plant species are often more useful as a source of raw materials for pharmaceutical, cosmetic and dietary use. Cultivars are often characterized as being easier to grow, more resistant to external factors and more productive like Aronia melanocarpa cv. Galicjanka (Wangensteen et al. 2014), Cannabis sativa cv. Uso 11 (Sankari 2000), Vitis vinifera cvs. Palatina and Swenson Red (Elmer) (Corrales et al. 2008), or Zea mays cvs. Rugosa and Pioneer (Drew and Läuchli 1985). Many vegetable cultivars are characterized by high production of active ingredients—such as Anethum graveolens (26 various cvs.) with a high essential oil content (Bailer et al. 2001), Ipomoea batatas cvs. Lunyangwa, Semusa, Kenya, Zondeni and Mugamba with a high starch content (Tsakama et al. 2010), Daucus carota cvs. Kazan and Kamaran with a high carotenoid content (Czepa and Hofmann 2004). Levels of biologically active compounds have been studied in cultivars of other medicinal plants; analyses have demonstrated, for example, a high phenolic content and high radical scavenging potential of Arnica montana cv. Arbo (Spitaler et al. 2008) and Matricaria chamomilla cv. Bona (Ganzera et al. 2008), or high levels of isoflavones in Glycine max cv. Saeolkong (Lee et al. 2009). Our results for the cultivar of Chinese magnolia vine correspond with those findings.
Besides examining SchS raw materials for SL content, the current study involved establishing in vitro shoot cultures of the Sadova cultivar, with the aim of providing an alternative, sustainable source of the aforementioned compounds. So far, there have been only few reports on in vitro cultures of Sch, including the projects of the authors of this paper (Březinová et al. 2010; Kohda et al. 2012; Szopa and Ekiert 2012; Szopa et al. 2016b), whereas in vitro cultures of SchS has not been studied at all.
In general, microshoot cultures of SchS were shown to accumulate higher amounts of SL as compared with previous reports. For instance, Brezinová et al. (Březinová et al. 2010) estimated the following amounts of SL in embryogenic Sch cultures cultivated on a Westvaco agar medium (with 0.9 mg/l BA and 2.21 mg/l 2,4-D (2,4-dichlorophenoxyacetic acid)): γ-schisandrin (max. 13.9 mg/100 g DW), gomisin A (max. 11.9 mg/100 g DW), deoxyschisandrin (max. 9.6 mg/100 g DW), schisandrin C (max. 7.3 mg/100 g DW) and schisandrin (max. 0.9 mg/100 g DW). In comparison with these results, the amounts of SL obtained in our SchS agar microshoot cultures were respectively 1.64-, 4.16-, 3.54-, 2.51- and 195.90-fold higher (Table 3).
In a study conducted by Kohda et al. (Kohda et al. 2012), Sch callus cultures were grown on ½ MS medium enriched with kinetin (0.05 mg/l) and 2,4-D (0.2 mg/l). Only two of the six analysed lignans, namely gomisin A (max 0.05 mg/100 g DW) and gomisin F (max 0.04 mg/100 g DW), were found in the biomass. The amount of gomisin A obtained in extracts from our SchS agar microshoot cultures was 99.10 times higher (Table 4).
Comparing the results of this study on SchS with our previous work on Sch agar cultures (Szopa et al. 2016b), it was found that the qualitative composition of SL was the same, but the amounts of specific constituents were different. In SchS agar cultures, the amounts of the main SL, schisandrin, deoxyschisandrin and gomisin A, were respectively 3.15-, 1.12-, 1.91-fold greater than the amounts of these compounds obtained in Sch microshoots on the corresponding variants of the culture medium. Also, the present study found SchS microshoots to contain 62.61-, 32.71- and 14.26-fold greater amounts of schisantherin B, schisantherin A and gomisin G, respectively, in comparison with Sch. Moreover, in SchS cultures, the amounts of angeloylgomisin Q and angeloylgomisin H were respectively 1.66- and 2.51-fold greater than the amounts in Sch biomass. The maximum total SL content obtained in extracts from the biomass from SchS agar cultures was 2.41 times higher than in extracts from Sch agar cultures (Table 7).
Table 7.
Comparison of schisandra lignans contents (mg/100 g DW±SD) in agar, agitated and Plantform bioreactor microshoots cultures of S. chinensis cv. Sadova and S. chinensis on MS medium variant G, for 30 days
| Lignans | S. chinensis cv. Sadova | S. chinensis* | ||||
|---|---|---|---|---|---|---|
| Agar | Agitated | Bioreactor | Agar | Agitated | Bioreactor | |
| Schisandrin | 99.0 ± 7.1bcdef | 112.3 ± 6.8ade | 115.3 ± 1.4ade | 53.0 ± 0.2abcef | 38.0 ± 2.4abcdf | 118.6 ± 1.5abde |
| Gomisin A | 49.6 ± 1.6bcdef | 71.4 ± 6.9acde | 27.9 ± 1.3abdf | 25.9 ± 2.0abf | 24.4 ± 0.2abcf | 67.9 ± 2.6abcde |
| Angeloyl-/tigloylgomisin H | 54.3 ± 12.3bcde | 44.8 ± 1.9acdef | 30.0 ± 0.7abef | 26.7 ± 1.2abcf | 22.0 ± 0.3abcf | 53.5 ± 2.4bcde |
| Angeloyl-/tigloylgomisin Q | 67.7 ± 2.6bcdef | 30.6 ± 0.8acdef | 18.3 ± 0.2abdef | 51.2 ± 2.6abcef | 34.6 ± 0.4acdf | 100.1 ± 3.1abcde |
| Gomisin G | 10.7 ± 0.2bcdef | 6.5 ± 4.3acdef | 9.5 ± 0.2bdef | 1.4 ± 0.8abcf | 1.4 ± 0.1abcf | 2.7 ± 0.5abcde |
| Schisantherin A | 8.0 ± 0.3bcdef | 7.5 ± 0.2cdef | 4.1 ± 0.1abdef | 0.4 ± 0.2abcef | 3.1 ± 0.1abcde | 3.0 ± 0.1abcd |
| Schisantherin B | 33.8 ± 1.0bdef | 29.9 ± 1.4acdef | 35.6 ± 0.5bdef | 0.8 ± 0.1abcef | 3.4 ± 0.1abcdf | 9.9 ± 2.1abcde |
| Schisanthenol | 2.2 ± 0.1bcdef | 8.4 ± 1.9acdeg | 1.1 ± 0.2abd | 0.5 ± 0.1abcf | 1.0 ± 0.1abd | 1.3 ± 0.3abd |
| Deoxyschisandrin | 34.0 ± 0.8bcdef | 21.5 ± 0.5acdef | 9.6 ± 0.2abdef | 30.3 ± 1.9bcf | 27.6 ± 0.3abcf | 77.7 ± 4.9abcde |
| Schisandrin B | 22.4 ± 0.5bcdef | 0.4 ± 0.2acdef | 9.1 ± 0.2abdef | 14.5 ± 1.4abcef | 13.6 ± 0.2abcdf | 39.7 ± 3.4abcde |
| γ-Schisandrin | 16.8 ± 0.9bcdef | 5.7 ± 0.8acdef | 2.3 ± 0.1abdef | 8.1 ± 0.3abcef | 7.6 ± 0.2abcf | 22.4 ± 0.2abcdef |
| Benzoylgomisin P | 27.0 ± 2.5bcdef | 9.0 ± 0.3acdef | 12.3 ± 0.2abdef | 17.5 ± 0.9abcef | 13.7 ± 0.1abdf | 37.2 ± 0.9abcde |
| Schisandrin C | 12.4 ± 0.5bcdef | 4.9 ± 0.2acdef | 16.6 ± 0.4abdef | 2.4 ± 0.5abcf | 2.0 ± 0.1abcf | 5.1 ± 0.8acde |
| Schisantherin D | 52.4 ± 1.2bcdef | 22.3 ± 0.5adef | 22.0 ± 0.3adef | 5.3 ± 0.9abcef | 3.0 ± 0.2abcdf | 8.2 ± 0.8abcde |
| Total content | 490.3 ± 31.5bcdef | 375.1 ± 26.6acdef | 313.5 ± 6.1abdef | 237.9 ± 4.5abcef | 195.2 ± 9.5abcdf | 547.0 ± 12.5abcde |
*According to Szopa et al. 2017b
ap < 0.05 vs. S. chinensis cv. Sadova agar in vitro cultures
bp < 0.05 vs. S. chinensis cv. Sadova agitated in vitro cultures
cp < 0.05 vs. S. chinensis cv. Sadova bioreactor in vitro cultures
dp < 0.05 vs. S. chinensis agar in vitro cultures
ep < 0.05 vs. S. chinensis agitated in vitro cultures
fp < 0.05 vs. S. chinensis bioreactor in vitro cultures
In the study by Brezinová et al. (Březinová et al. 2010) conducted on Sch suspension cultures, the dominant compounds were gomisin N (max. 54.7 mg/100 g DW), γ-schisandrin (max. 55.0 mg/100 g DW) and schisandrin C (max. 20.9 mg/100 g DW) whereas deoxyschisandrin (4.9 mg/100 g DW), gomisin A (max. 4.4 mg/100 g DW) and schisandrin (max. 1.0 mg/100 g DW) accumulated in smaller amounts. The maximum concentrations of γ-schisandrin and schisandrin C in extracts from the biomass of SchS agitated cultures were respectively 5.23 and 3.41 times smaller, and those of deoxyschisandrin 5.57 times greater than in extracts from the biomass of Sch suspension cultures. The current study also found 112.31- and 16.23-fold higher levels of schisandrin and gomisin A, respectively (Table 7).
The comparison of our studies on agitated microshoot cultures of SchS and Sch demonstrated that both plants have the same qualitative composition of SL; however, differences were shown in the amounts of the specific lignans. The dominant compounds in Sch agitated cultures were schisandrin, deoxyschisandrin and gomisin A. The maximum amounts of schisandrin and gomisin A were respectively 2.66 and 2.58 times lower, and those of deoxyschisandrin 1.31 times higher than the amounts of these compounds obtained in SchS agitated cultures. The amounts of schisanthenol, schisantherin B and gomisin G obtained in extracts from SchS agitated cultures were respectively 6.53-, 5.24- and 4.98-fold higher compared with agitated cultures of S. chinensis. The amounts of angeloylgomisin Q and angeloylgomisin H in Sch agitated microshoot cultures were 1.42 times higher and 1.70 times lower, respectively, in comparison with SchS. Also, the amounts of schisantherin D and schisandrin B obtained with SchS were 4.27 and 2.02 times greater, respectively, than in Sch agitated cultures. The maximum total SL content obtained in extracts from the biomass from SchS agitated cultures was 1.69 times higher than in extracts from Sch agitated cultures (Table 7).
The bioreactor-grown SchS microshoots, in comparison with Sch microshoots cultivated under the same conditions (Szopa et al. 2017b), were found to contain greater amounts of three main SL: schisantherin B (3.62 times), schisandrin C (3.32 times) and schisantherin D (2.70 times) (Table 7). However, the total SL content in Plantform-grown SchS was 1.74 times lower than in Sch.
The elicitation experiment performed on Plantform-grown microshoots of SchS increased the total amount of SL 1.30 times; however, the obtained amounts were still lower than in non-elicited Sch microshoots grown in the same temporary-immersion system (Szopa et al. 2018). The applied elicitation scheme, taken directly from our previous report, may not be optimal for in vitro shoots of Schisandra cultivar. Further optimization of the experiment is required to determine the type, concentration and application time of the elicitor, as well as the cultivation mode providing highest SL yield. Indeed, our previous trials on Sch in vitro cultures had indicated that the amounts of SL in the microshoots vary considerably depending on bioreactor type (Szopa et al. 2017b) and elicitation scheme (Szopa et al. 2018). Moreover, as it has been demonstrated with other in vitro cultures of medicinal plant species, like Panax ginseng (Thanh et al. 2005), Taxus chinensis (Dong and Zhong 2002) and Withania somnifera (Sivanandhan et al. 2014), these conditions must be designed for each types of in vitro cultures and plant species individually.
As a result of the experiments with SchS, a cultivar of Sch, quantitative differences in the chemical composition in vitro cultures of different cultivars were proven. Similar correlations of the diversity in the characteristics of cultivated varieties have been confirmed by studies conducted on other cultures in vitro. These differences are most often presented in reports on micropropagation. The necessity of introducing different schemes for dealing with cultivars of the same species have been demonstrated for Hibiscus cannabinus cv. Guangdong 743-2 (Ayadi et al. 2011), Pyrus communis cv. Cascatense (De Castro Da Silva et al. 2016) and Vitis vinifera cv. Cabernet Sauvignon (Laslo et al. 2010). Particularly noteworthy are studies on the accumulation of biologically active metabolites in the biomass of in vitro cultures of cultivated varieties such as in vitro cultures of three cultivars of Hypericum perforatum—Elixir, Helos and Topas (Kwiecień et al. 2015; Kwiecień et al. 2018). The richest source of the estimated compounds, i.e. phenolic acids and flavonoids, and hence a potential biotechnological platform, were the shoots of cv. Helos cultivated in an agitated culture system on LS and MS media containing low concentrations of BA and NAA (0.1–1.0 mg/l). Variability in the accumulation of free proline has been observed in different cultivars of Phaseolus vulgaris cvs. Pinto Americano, Pastilla, Flor de Mayo and Flor de Junio (Cárdenas-Avila et al. 2006). The most promising results were confirmed for cv. Pinto Americano.
In recent decades, in vitro cultures of several medicinal plants were investigated as an alternative for traditional crops or wild-grown species. This type of studies are boosted by limited natural resources of medicinal plants which are not sufficient to meet the growing market demands. Examples of successful research in this field include in vitro cultures of Catharanthus roseus (Vázquez-Flota et al. 2009), Panax ginseng (Thanh et al. 2005) or Salvia miltiorrhiza (Zhao et al. 2010), which were employed for the production of biomass and/or bioactive compounds of interest. In the presented work, in vitro cultures of SchS were evaluated for their utility as a sustainable source of SL. The maximal total amounts of SL obtained through testing different culture conditions (490.3 mg/100 g DW) was 2.04 times higher than in leaf extract and only 1.32 times lower than in the fruit extract od parent plant (Tables 2 and 7). Also the individual contents of some SL were higher in the microshoot extracts than in analysed for comparative purpose fruit and leaf extracts of soil-grown plant. The amounts of the main SL with high therapeutic value were respectively 1.45 and 2.09 (schisandrin) and 2.23 and 5.63 (gomisin B) times higher in extracts from in vitro cultures. Since the above compounds are considered to be responsible for biological activity of Schisandra extracts (Szopa et al. 2017a), the obtained cultures may serve as a material for their isolation. In the course of the study, we have also optimized the growth conditions of SchS microshoots in the temporary immersion system (Plantform bioreactors) which enable effective propagation of microshoots with relatively low cost (Szopa et al. 2017b). These experiments included the stimulation of SL biosynthesis by elicitation, thus providing an opportunity for the scale up the production of SL-enriched biomass (Table 6). Promising results encourage further experiments in the field. Most importantly, our findings demonstrated that SchS is a rich source of SL, thus proving its value for medical, cosmetic and food industry.
The chromatographic analyses of all analysed SL standards (nine compounds) performed under our study was confirmed by validation procedure compatible with European Medicines Agency standards based on accuracy, precision, linearity, limit of detection and limit of quantification (European Medicines Agency 2005) (see section ‘Validation setup’).
Within the framework of our phytochemical and what is the most important, biotechnological studies of a cultivar of Sch, our results indicated, for the first time, the highest utility of SchS with regard to higher concentrations of SL. These compounds are responsible for a wide range of biological properties, especially of fruits, which determine their application in medicine, phytotherapy and cosmetology industry (Walsh 2003; Schneider et al. 2013).
Electronic supplementary material
(PDF 693 kb)
Funding
This study was funded by the National Science Centre, Poland (grant number 2016/23/D/NZ7/01316), and supported by the Polish Ministry of Science and Higher Education (grant number K/DSC/004297).
Compliance with ethical standards
Conflict of interest
The authors declare that they have no conflict of interest.
Ethical approval
This article does not contain any studies with human participants or animals performed by any of the authors.
Footnotes
Electronic supplementary material
The online version of this article (10.1007/s00253-018-8981-x) contains supplementary material, which is available to authorized users.
References
- Ayadi R, Hamrouni L, Hanana M, Bouzid S, Trifi M, Khouja ML. In vitro propagation and regeneration of an industrial plant kenaf (Hibiscus cannabinus L.) Ind Crop Prod. 2011;33:474–480. doi: 10.1016/j.indcrop.2010.10.025. [DOI] [Google Scholar]
- Bailer J, Aichinger T, Hackl G, de Hueber K, Dachler M. Essential oil content and composition in commercially available dill cultivars in comparison to caraway. Ind Crop Prod. 2001;14:229–239. doi: 10.1016/S0926-6690(01)00088-7. [DOI] [Google Scholar]
- Březinová L, Vlašínová H, Havel L, Humpa O, Slanina J. Validated method for bioactive lignans in Schisandra chinensis in vitro cultures using a solid phase extraction and a monolithic column application. Biomed Chromatogr. 2010;24:954–960. doi: 10.1002/bmc.1391. [DOI] [PubMed] [Google Scholar]
- Cárdenas-Avila M, Verde-Star J, Maiti R, Foroughbakhch PR, Gámez-González H, Martínez-Lozano S, Núñez-González M, García Díaz G, Hernández-Piñero J, Morales-Vallarta M. Variability in accumulation of free proline on in vitro calli of four bean (Phaseolus vulgaris L.) varieties exposed to salinity and induced moisture stress. Int J Exp Bot. 2006;75:103–108. [Google Scholar]
- Central Pharmaceutical Affairs Council . Korean Pharmacopoeia. 2002. [Google Scholar]
- Chinese Pharmacopoeia Commission . Pharmacopoeia of the People’s Republic of China. Beijing: China Chemical Industry Press; 2005. [Google Scholar]
- Committee of the Japanese Pharmacopoeia . Japanese Pharmacopoeia. Tokyo: Evaluation and Licensing Division Pharmaceuticals and Food Safety Bureau Ministry of Health, Labour and Welfare; 2006. [Google Scholar]
- Corrales M, Toepfl S, Butz P, Knorr D, Tauscher B. Extraction of anthocyanins from grape by-products assisted by ultrasonics, high hydrostatic pressure or pulsed electric fields: a comparison. Innovative Food Sci Emerg Technol. 2008;9:85–91. doi: 10.1016/j.ifset.2007.06.002. [DOI] [Google Scholar]
- Czepa A, Hofmann T. Quantitative studies and sensory analyses on the influence of cultivar, spatial tissued distribution, and industrial processing on the bitter off-taste of carrots (Daucus carota L.) and carrot products. J Agric Food Chem. 2004;52:4508–4514. doi: 10.1021/jf0496393. [DOI] [PubMed] [Google Scholar]
- De Castro Da Silva IM, Cuchiara CC, Winhelmann MC, Bianchi VJ, EJB B, Dutra LF, Peters JA. In vitro multiplication of pear tree cultivar Cascatense. Semin Agrar. 2016;37:581–594. doi: 10.5433/1679-0359.2016v37n2p581. [DOI] [Google Scholar]
- Dong H-D, Zhong J-J. Enhanced taxane productivity in bioreactor cultivation of Taxus chinensis cells by combining elicitation, sucrose feeding and ethylene incorporation. Enzym Microb Technol. 2002;31:116–121. doi: 10.1016/S0141-0229(02)00079-0. [DOI] [Google Scholar]
- Drew MC, Läuchli A. Oxygen-dependent exclusion of sodium ions from shoots by roots of Zea mays (cv Pioneer 3906) in relation to salinity damage. Plant Physiol. 1985;79:171–176. doi: 10.1104/pp.79.1.171. [DOI] [PMC free article] [PubMed] [Google Scholar]
- European Directorate for the Quality of Medicines (2017) Schisandra fruit. In: European Pharmacopoeia 9.0. Strasburg, p 1514
- European Medicines Agency (2005) ICH topic Q 2 (R1) Validation of analytical procedures: text and methodology
- Ganzera M, Guggenberger M, Stuppner H, Zidorn C. Altitudinal variation of secondary metabolite profiles in flowering heads of Matricaria chamomilla cv. BONA. Planta Med. 2008;74:453–457. doi: 10.1055/s-2008-1034326. [DOI] [PubMed] [Google Scholar]
- Hancke JL, Burgos RA, Ahumada F. Schisandra chinensis (Turcz.) Baill. Fitoterapia. 1999;70:451–471. doi: 10.1016/S0367-326X(99)00102-1. [DOI] [Google Scholar]
- Kohda H, Ozaki M, Namera A. Production of lignans in calluses of Schisandra chinensis. J Nat Med. 2012;66:373–376. doi: 10.1007/s11418-011-0586-y. [DOI] [PubMed] [Google Scholar]
- Kwiecień I, Szydłowska A, Kawka B, Beerhues L, Ekiert H. Accumulation of biologically active phenolic acids in agitated shoot cultures of three Hypericum perforatum cultivars: “Elixir”, “Helos” and “Topas”. Plant Cell Tissue Organ Cult. 2015;123:273–281. doi: 10.1007/s11240-015-0830-3. [DOI] [Google Scholar]
- Kwiecień I, Smolin J, Beerhues L, Ekiert H (2018) The impact of media composition on production of flavonoids in agitated shoot cultures of the three Hypericum perforatum cultivars “Elixir”, “Helos” and “Topas”. In Vitro Cell Dev Biol - Plant. 10.1007/s11627-018-9900-7 [DOI] [PMC free article] [PubMed]
- Laslo V, Zăpârţan M, Vicaş S. In vitro respons of several cultivars of Vitis vinifera L on media with balanced phytohormone ratio. Res J Agric Sci. 2010;42:269–274. [Google Scholar]
- Lee JH, Ha TJ, Baek IY, Ko JM, Cho KM, Im MH, Choung MG. Characterization of isoflavones accumulation in developing leaves of soybean (Glycine max) cultivars. J Appl Biol Chem. 2009;52:139–143. [Google Scholar]
- Murashige T, Skoog F. A revised medium for rapid growth and bioassays with tobacco tissue cultures. Physiol Plant. 1962;15:473–479. doi: 10.1111/j.1399-3054.1962.tb08052.x. [DOI] [Google Scholar]
- Opletal L, Sovová H, Bártlová M. Dibenzo[a,c]cyclooctadiene lignans of the genus Schisandra: importance, isolation and determination. J Chromatogr B. 2004;812:357–371. doi: 10.1016/S1570-0232(04)00646-4. [DOI] [PubMed] [Google Scholar]
- Sankari HS. Comparison of bast fibre yield and mechanical fibre properties of hemp (Cannabis sativa L.) cultivars. Ind Crop Prod. 2000;11:73–84. doi: 10.1016/S0926-6690(99)00038-2. [DOI] [Google Scholar]
- Schneider M, Windbergs M, Daum N, Loretz B, Collnot E-M, Hansen S, Schaefer UF, Lehr C-M. Crossing biological barriers for advanced drug delivery. Eur J Pharm Biopharm. 2013;84:239–241. doi: 10.1016/j.ejpb.2013.03.009. [DOI] [PubMed] [Google Scholar]
- Shaitan I (2005) Колбасина ЕИ: Актиндия и лимонник (Actinidia and Chinese Magnolia vine). Moscow
- Sivanandhan G, Selvaraj N, Ganapathi A, Manickavasagam M. Enhanced biosynthesis of withanolides by elicitation and precursor feeding in cell suspension culture of Withania somnifera (L.) Dunal in shake-flask culture and bioreactor. PLoS One. 2014;9:1–9. doi: 10.1371/journal.pone.0104005. [DOI] [PMC free article] [PubMed] [Google Scholar]
- Spitaler R, Winkler A, Lins I, Yanar S, Stuppner H, Zidorn C. Altitudinal variation of phenolic contents in flowering heads of Arnica montana cv. ARBO: a 3-year comparison. J Chem Ecol. 2008;34:369–375. doi: 10.1007/s10886-007-9407-x. [DOI] [PubMed] [Google Scholar]
- Szopa A, Ekiert H. Lignans in Schisandra chinensis in vitro cultures. Pharmazie. 2011;66:633–634. [PubMed] [Google Scholar]
- Szopa A, Ekiert H. In vitro cultures of Schisandra chinensis (Turcz.) Baill. (Chinese magnolia vine)—a potential biotechnological rich source of therapeutically important phenolic acids. Appl Biochem Biotechnol. 2012;166:1941–1948. doi: 10.1007/s12010-012-9622-y. [DOI] [PMC free article] [PubMed] [Google Scholar]
- Szopa A, Klimek M, Ekiert H. Chinese magnolia vine (Schisandra chinensis)—therapeutic and cosmetic importance. Pol J Cosmetol. 2016;19:274–284. [Google Scholar]
- Szopa A, Kokotkiewicz A, Marzec-Wróblewska U, Bucinski A, Luczkiewicz M, Ekiert H. Accumulation of dibenzocyclooctadiene lignans in agar cultures and in stationary and agitated liquid cultures of Schisandra chinensis (Turcz.) Baill. Appl Microbiol Biotechnol. 2016;100:3965–3977. doi: 10.1007/s00253-015-7230-9. [DOI] [PMC free article] [PubMed] [Google Scholar]
- Szopa A, Ekiert R, Ekiert H. Current knowledge of Schisandra chinensis (Turcz.) Baill. (Chinese magnolia vine) as a medicinal plant species: a review on the bioactive components, pharmacological properties, analytical and biotechnological studies. Phytochem Rev. 2017;16:195–218. doi: 10.1007/s11101-016-9470-4. [DOI] [PMC free article] [PubMed] [Google Scholar]
- Szopa A, Kokotkiewicz A, Luczkiewicz M, Ekiert H. Schisandra lignans production regulated by different bioreactor type. J Biotechnol. 2017;247:11–17. doi: 10.1016/j.jbiotec.2017.02.007. [DOI] [PubMed] [Google Scholar]
- Szopa A, Kokotkiewicz A, Król A, Luczkiewicz M, Ekiert H. Improved production of dibenzocyclooctadiene lignans in the elicited microshoot cultures of Schisandra chinensis (Chinese magnolia vine) Appl Microbiol Biotechnol. 2018;102:945–959. doi: 10.1007/s00253-017-8640-7. [DOI] [PMC free article] [PubMed] [Google Scholar]
- Thanh NT, Murthy HN, Yu KW, Hahn EJ, Paek KY. Methyl jasmonate elicitation enhanced synthesis of ginsenoside by cell suspension cultures of Panax ginseng in 5-l balloon type bubble bioreactors. Appl Microbiol Biotechnol. 2005;67:197–201. doi: 10.1007/s00253-004-1759-3. [DOI] [PubMed] [Google Scholar]
- Tsakama M, Mwangwela AM, Manani TA, Mahungu NM. Physicochemical and pasting properties of starch extracted from eleven sweetpotato varieties. Afr J Food Sci Technol. 2010;1:90–98. [Google Scholar]
- Upton R, Graff A, Jolliffe G, Länger R, Williamson E (2011) American herbal pharmacopoeia: botanical pharmacognosy—microscopic characterization of botanical medicines. CRC Press
- Vázquez-Flota F, Hernández-Domínguez E, de Lourdes Miranda-Ham M, Monforte-González M. A differential response to chemical elicitors in Catharanthus roseus in vitro cultures. Biotechnol Lett. 2009;31:591–595. doi: 10.1007/s10529-008-9881-4. [DOI] [PubMed] [Google Scholar]
- Walsh G. Pharmaceutical biotechnology products approved within the European Union. Eur J Pharm Biopharm. 2003;55:3–10. doi: 10.1016/S0939-6411(02)00165-0. [DOI] [PubMed] [Google Scholar]
- Wangensteen H, Bräunlich M, Nikolic V, Malterud KE, Slimestad R, Barsett H. Anthocyanins, proanthocyanidins and total phenolics in four cultivars of aronia: antioxidant and enzyme inhibitory effects. J Funct Foods. 2014;7:746–752. doi: 10.1016/j.jff.2014.02.006. [DOI] [Google Scholar]
- World Health Organization . WHO monographs on selected medicinal plants. Geneva: Fructus Schisandrae; 2007. [Google Scholar]
- Zhang H, Zhang G, Zhu Z, Zhao L, Fei Y, Jing J, Chai Y. Determination of six lignans in Schisandra chinensis (Turcz.) Baill. fruits and related Chinese multiherb remedies by HPLC. Food Chem. 2009;115:735–739. doi: 10.1016/j.foodchem.2008.12.010. [DOI] [Google Scholar]
- Zhao J, Zhou L, Wu J. Effects of biotic and abiotic elicitors on cell growth and tanshinone accumulation in Salvia miltiorrhiza cell cultures. Appl Microbiol Biotechnol. 2010;87:137–144. doi: 10.1007/s00253-010-2443-4. [DOI] [PubMed] [Google Scholar]
Associated Data
This section collects any data citations, data availability statements, or supplementary materials included in this article.
Supplementary Materials
(PDF 693 kb)