Abstract
For LC-MS-based targeted quantification of biotherapeutics and biomarkers in clinical and pharmaceutical environments, high sensitivity, high throughput, and excellent robustness are all essential but remain challenging. For example, though nano-LC-MS has been employed to enhance analytical sensitivity, it falls short because of its low loading capacity, poor throughput, and low operational robustness. Furthermore, high chemical noise in protein bioanalysis typically limits the sensitivity. Here we describe a novel trapping-micro-LC-MS (T-μLC-MS) strategy for targeted protein bioanalysis, which achieves high sensitivity with exceptional robustness and high throughput. A rapid, high-capacity trapping of biological samples is followed by μLC-MS analysis; dynamic sample trapping and cleanup are performed using pH, column chemistry, and fluid mechanics separate from the μLC-MS analysis, enabling orthogonality, which contributes to the reduction of chemical noise and thus results in improved sensitivity. Typically, the selective-trapping and -delivery approach strategically removes >85% of the matrix peptides and detrimental components, markedly enhancing sensitivity, throughput, and operational robustness, and narrow-window-isolation selected-reaction monitoring further improves the signal-to-noise ratio. In addition, unique LC-hardware setups and flow approaches eliminate gradient shock and achieve effective peak compression, enabling highly sensitive analyses of plasma or tissue samples without band broadening. In this study, the quantification of 10 biotherapeutics and biomarkers in plasma and tissues was employed for method development. As observed, a significant sensitivity gain (up to 25-fold) compared with that of conventional LC-MS was achieved, although the average run time was only 8 min/sample. No appreciable peak deterioration or loss of sensitivity was observed after >1500 injections of tissue and plasma samples. The developed method enabled, for the first time, ultrasensitive LC-MS quantification of low levels of a monoclonal antibody and antigen in a tumor and cardiac troponin I in plasma after brief cardiac ischemia. This strategy is valuable when highly sensitive protein quantification in large sample sets is required, as is often the case in typical biomarker validation and pharmaceutical investigations of antibody therapeutics.
Graphical abstract
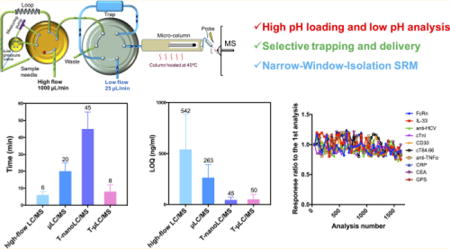
Despite the tremendous advances made in recent years,1–4 developing a robust and high-throughput LC-MS method for the quantification of targeted protein biotherapeutics and markers with high sensitivity and selectivity, which is highly desirable for most pharmaceutical and clinical assays, still remains a challenge. Sensitivity is the primary concern because of the large molecular weights of proteins, the high protein contents in most biomatrices, and importantly the high chemical noises.5 High-flow LC-MS is commonly employed in pharmaceutical and clinical applications as it affords short cycles and acceptable robustness. However, it often leads to compromised sensitivity and thus becomes less applicable to quantify biomarkers or protein biotherapeutics at low (and biologically relevant) concentrations.6 To address this limitation, nano-LC-MS-based methods have been developed,3,7–10 but several disadvantages have been reported.5,11,12 First, the loading capacity for nano-LC-MS is low, leading to compromised concentration sensitivity (i.e., sensitivity expressed in concentration) in biological matrices, despite its high mass sensitivity.5,12,13 As a result, enrichment and fractionation procedures (e.g., gel or immunoaffinity separation to reduce matrix components) are often employed prior to nano-LC-MS. Second, its relatively poor operational robustness, the extra efforts required for its maintenance, and its relatively low analytical throughput (e.g., each run is >40 min unless a highly selective enrichment is used3) limit its applications in large-cohort analyses. Finally, because numerous peptides are coretrieved after the digestion of a biological sample, the biochemical noise for LC-MS-based protein quantification is often high unless extensive separation or enrichment strategies are employed.2 This issue cannot be addressed by using low-flow LC alone, which often uniformly boosts the responses of both the target and biochemical interference.5
To address these challenges, we have developed a novel trapping-micro-LC-MS (T-μLC-MS) strategy, which is aimed at sensitive protein quantification with highly enhanced throughput and robustness and is suitable for pharmaceutical and clinical applications. The system consists of two synchronized LC units, in which a high-flow LC is used for the online trapping of high amounts of biological samples on a large-capacity trapping column, and a low-flow μLC-MS is used for separation and detection. The key principles of this strategy include (i) orthogonal retention mechanisms for loading and analysis as well as a selective-trapping and -delivery approach, which substantially lowers biochemical noise and improves the signal-to-noise ratio (S/N) and throughput for an analysis of biological samples; (ii) employing narrow-window-isolation selected-reaction monitoring (NWI-SRM) to further reduce chemical noise and improve both selectivity and sensitivity; and (iii) a unique column configuration and peak compression approach that enable large-capacity, rapid, and quantitative loading while maintaining excellent chromatographic resolution.
During the course of development and optimization, 10 proteins in plasma and tissues (Table 1) were used as models, including monoclonal antibody (mAb) biotherapeutics and important circulating biomarkers and receptors, which are representative of targets in typical biotherapeutics and marker analyses. The developed method was successfully applied in an ultrasensitive investigation of a circulating biomarker, cardiac troponin I (cTnI), and a mAb therapeutic (cT84.66) and its target, carcinoembryonic antigen (CEA), in preclinical studies.
Table 1.
Model Proteins and Signature Peptides
| protein name | type | matrix | signature peptidea | pIb | GRAVYc |
|---|---|---|---|---|---|
| FcRn | receptor, human | rat liver | DVNVIPATA | 3.80 | 0.80 |
| anti-HCV | humanized IgG | rat liver | TVAAPSVFIFPPSDEQLK | 4.37 | 0.24 |
| cardiac troponin I (cTnI) | circulating biomarker, swine | swine plasma | NITEIADLNQK | 4.37 | −0.68 |
| IL-33 | biomarker, human | rat tumor | TDPGVFIGVK | 5.50 | 0.52 |
| CD30 | cell-membrane biomarker, human | rat tumor | QCEPDYYLDEAGR | 3.92 | −1.42 |
| cT84.66 | murine IgG | mouse tumor | ASNLESGIPVR | 6.05 | 0.07 |
| anti-TNFα | murine IgG | rat plasma | EFQLQQSGPELVKPGASVR | 6.24 | −0.57 |
| C-reactive protein (CRP) | circulating biomarker, human | rat plasma | GYSIFSYATK | 8.50 | −0.01 |
| carcinoembryonic antigen (CEA) | biomarker, human | mouse tumor | TLTLISVTR | 9.40 | 0.91 |
| AB095 | humanized IgG | rat plasma | GPSVFPLAPSSK | 8.75 | 0.09 |
Signature peptides (SPs) were selected experimentally with a previously reported method on the basis of uniqueness, sensitivity, stability, etc.14,15,33
pI values were calculated with a tool from https://web.expasy.org/compute_pi/
Grand-average-of-hydropathy (GRAVY) values were acquired with a tool by Dr. Stephan Fuchs (http://www.gravy-calculator.de).
EXPERIMENTAL PROCEDURES
Owing to space limitations, the following information is in Supporting Information: the reagents and methods for the animal experiments, tissue- and plasma-sample extraction, cleanup and digestion, conventional μLC-MS, and high-flow LC-MS.
T-μLC-MS
An UltiMate 3000 LC system (containing an SRD-3400 degasser, NCS-3500RS CAP pumps, a high-flow tertiary gradient pump, and a WPS-3000TBRS autosampler with a 250 μL loop) coupled to a TSQ Quantiva triple-quadrupole mass spectrometer via an Ion Max NG ion source with an H-ESI probe and a 34-G narrow-bore spray needle (Thermo Fisher Scientific, CA) was used. Sample trapping was conducted on a C8 column (15 × 2.1 mm, 3.5 μm particle size, 100 Å, Agilent, CA) at a flow rate of 1 mL/min using the tertiary pump. The high-flow loading mobile phases (MPs) Atrapping and Btrapping were water–acetonitrile 98:2 and 5:95 (v/v), respectively, and each contained 1 mM ammonium formate (pH = 9.0, adjusted by ammonium hydroxide). A micro-flow selector (5–50 μL/min) was used for μLC-MS. The separation column was a Zorbax C18 Stable Bond column (150 × 0.5 mm, 3.5 μm, 100 Å, Agilent, CA) at a flow rate of 25 μL/min. The low-flow MPs Aanalysis and Banalysis for μLC were water–acetonitrile–formic acid 98:2:0.1 and 15:85:0.1 (v/v/v, pH = 3.0), respectively. At the beginning of the sample delivery from the trap to the column, a 1 min isocratic elution with the initial gradient Banalysis percentage was used to help peak compression. A ZDV six-port valve placed in the heated column compartment was utilized to coordinate the operations of the two flow systems. The separation temperature was controlled at 40 °C. The spray voltage was 3.5 kV, the vaporizer temperature was 50 °C, the sheath gas was 15.0 arb unit, the auxiliary gas was 2.0 arb unit, and the capillary temperature was maintained at 325 °C. The optimized RF-lens voltages and collision energies were obtained for each signature peptide by an on-the-fly orthogonal-array-optimization (OAO) strategy.14,15 SRM transitions and conditions of the 10 model proteins are listed in Table S1. The isolation window was set to 0.2 Th for Q1 and 0.7 Th for Q3 for all channels.
Optimization of the T-μLC Conditions
The T-μLC conditions were optimized with a digested pool of blank tissue and plasma samples spiked with a target signature peptide (SP). Optimization of the sample-trapping and elution conditions was performed to achieve high selectivity and sensitivity while maintaining a short cycle time. A series of different loading conditions (MP Btrapping ranging from 1 to 15%) with a step size of 0.5% were evaluated at 1000 μL/mL with a generic delivery condition (the trap is not switched offline until the end of analysis) to the analytical column. To enable an automated, streamlined optimization, the trapping column was equilibrated with the next experimental condition at the end of each analysis cycle. Similarly, while the trap-switching MP Banalysis ranged from 10 to 26%, a series of different delivery conditions (the Banalysis percentages during the gradient elution to switch the trap off of the column) with a mild loading condition (MP Btrapping = 1%) was evaluated with a step size of 1%. Optimal trapping and delivery-gradient conditions (i.e., the valve turning time and the Banalysis percentage to switch the trap off of the column) were selected on the basis of the recovery of the target and the removal of the interfering species. Finally, the analytical gradient was fine-tuned to ensure the separation of the target peak from the endogenous interfering peaks and a minimal run time.
Calibration and Preliminary Validation
Standard proteins were spiked into a pooled blank matrix to concentrations of 200 μg/mL to prepare the calibration curves. The standard calibrator samples were diluted with the blank matrix to a range of concentrations, as shown in Table 2. A hybrid calibration strategy was used in this study as specified previously.16 An SIL-peptide IS was spiked after the digestion of the calibration samples. The optimized T-μLC-MS method was used for the analysis of each model protein. The data were processed using Skyline. Calibration curves were established by plotting the extracted-ion-current-peak-area ratio of the analyte/IS as a function of analyte concentration. For the quantification of the target proteins in the biological samples, weighted least-squares linear-regression analysis of the standard curves was used. For the preliminary validation, a batch of quality-control (QC) samples were prepared that contained low, medium, and high concentrations of the target protein in biomatrices, and this sample set was compared to the independently prepared calibration standards. The precision of the assay was calculated by repeated analyses of the spiked QC samples, and the coefficient of variation (CV, %) of the replicate measurements was calculated to determine the variability. The quantitative accuracies of the QC samples at each concentration level were calculated against the nominated concentrations.
Table 2.
Calibration and Validation Results for the Model Proteins
| QC accuracy (%)/CV (%)
|
|||||||
|---|---|---|---|---|---|---|---|
| protein | matrix | LODa (ng/mL) | linearity range (ng/mL) | r2 | low | medium | high |
| FcRn | rat liver | 13.8 | 20–20 000 | 0.990 | 86.7/16.9 | 98.7/10.6 | 109/10.7 |
| anti-HCV | rat plasma | 25.2 | 40–40 000 | 0.995 | 97.6/11.3 | 93.5/15.6 | 91.8/13.6 |
| cTnI | swine plasma | 0.05b | 0.1–100 | 0.991 | 86.6/20.3 | 118/13.8 | 98.2/10.6 |
| IL-33 | rat tumor | 4.81 | 10–10 000 | 0.991 | 105/15.6 | 95.6/14.9 | 91.9/12.3 |
| CD30 | rat tumor | 23.6 | 50–50 000 | 0.983 | 92.6/13.2 | 89.3/12.6 | 91.5/9.8 |
| cT84.66 | mouse tumor | 20.9c | 45–45 000 | 0.994 | 93.5/10.3 | 86.5/9.6 | 92.6/8.9 |
| anti-TNFα | rat plasma | 96.4d | 150–150 000 | 0.989 | 85.2/18.6 | 91.5/13.5 | 97.2/10.2 |
| CRP | human plasma | 19.5 | 40–40 000 | 0.990 | 89.5/11.3 | 91.5/10.3 | 101/15.3 |
| CEA | mouse tumor | 34.6c | 50–50 000 | 0.987 | 96.3/12.5 | 85.8/13.9 | 93.6/12.6 |
| AB095 | rat plasma | 22.9 | 50–50 000 | 0.995 | 88.8/10.9 | 93.2/13.2 | 94.7/16.9 |
Limit of detection.
For this target, antibody enrichment was used before digestion, and SPE enrichment was used after digestion.
SPE enrichment was used after digestion.
For this antibody, no sensitive signature peptide was available.
RESULTS AND DISCUSSION
Development and Evaluation of the T-μLC-MS Strategy
Overview of General Rationales
Because of the high protein contents in biological samples, the available total protein amounts in typical pharmaceutical, clinical, and preclinical studies often greatly exceed the loading capacity of low-flow LC-MS. Here, we used a large-i.d. trap with an enhanced loading capacity, through which the biological samples were trapped and then selectively delivered using unique, optimized fluid mechanics. This also selectively eliminated most of the matrix components (e.g., salts, lipids, nontarget matrix peptides, etc.) while maintaining a high recovery of the target peptide for the downstream μLC-MS analysis and thereby substantially improving selectivity, sensitivity, throughput, and robustness. Moreover, dynamic peptide trapping and μLC-MS analysis with differential pH effectively improve the S/N ratios of targets owing to the partially orthogonal mechanism; NWI-SRM detection utilizing a narrow filtering window at Q1 further decreases interfering biochemical noise and improves sensitivity. Finally, unique flow approaches were developed to enable efficient peak compression and prevent gradient shock.
System Configuration
For the μLC-MS, a 0.5 mm i.d. C18 column was chosen on the basis of pilot experiments and consideration given to balancing sensitivity gains, operational robustness, and throughput. We decided that a 3.5 μm material offers the best balance of robustness, reproducibility, and separation. As for trapping, a 2.1 mm i.d. C8 column was employed to improve the quantitative loading capacity of the system by >15-fold over the μLC column alone. For the trapping, a 1 mL/min flow rate was determined to be optimal at enabling very rapid loading, the removal of matrix components, and equilibration. For the μLC, a 25 μL/min flow was found to be optimal on the basis of comprehensive evaluations on chromatographic resolution, sensitivity, speed of analysis, back pressure, and system dead time (data not shown).
The connection of the two components are shown in Figure 1. Proper tubing sizes are critical to accommodate these flow rates in each component with minimal dead volume and reasonable back pressure (Figure S1. The column is heated at 40 °C to improve the peptide separation17–19 and reduce back pressure.
Figure 1.
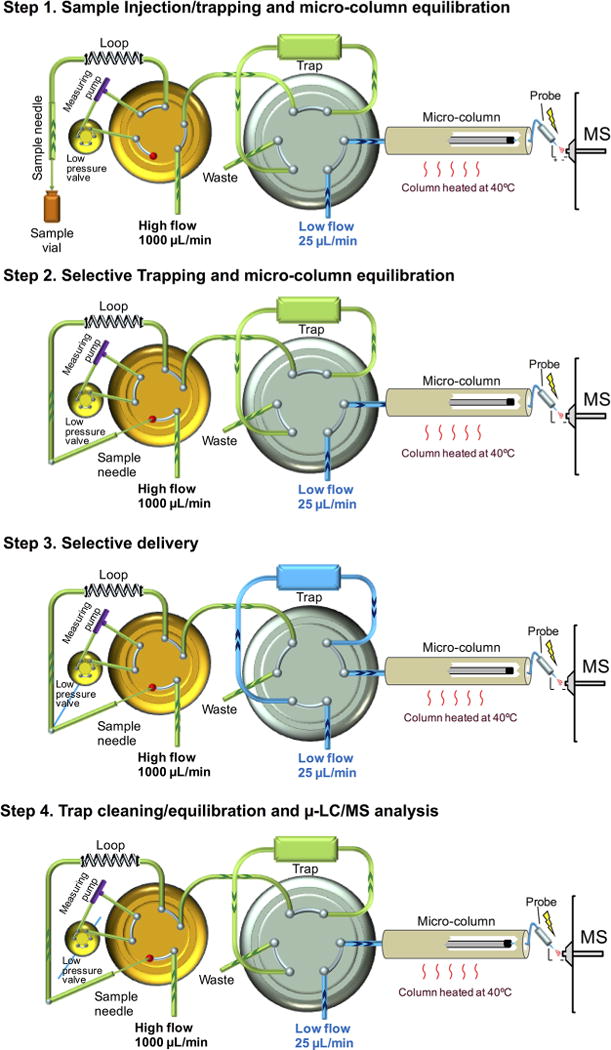
Hardware configuration for trapping-micro-LC-MS (T-μLC-MS). The tubing diameters and column information are shown in Figure S1.
One analytical cycle consists of four steps (Figure 1): (i) Through the injection of a sample, both high- and low-flow systems are equilibrated. (ii) With an optimized high-pH MP, the samples are selectively trapped, whereas salts and matrix peptides that are more hydrophilic than the target are removed. The equilibration of the μLC-MS continues during this step. (iii) Trapped target peptides are selectively delivered to the μLC-MS. At an experimentally identified optimal time, the trap is switched back to the high-flow system. (iv) The final step involves the removal of residual hydrophobic peptides and components from the trap, followed by trap equilibration, in parallel with the μLC-MS analysis.
Selective-Trapping and -Delivery Approaches to Enhance Sensitivity, Selectivity, Robustness, and Throughput. High-pH Trapping and Low-pH μLC-MS Analysis
High- and low-pH MPs deliver partially orthogonal mechanisms for peptide separation.10,20–22 Here, we speculated that the use of a high-pH MP for selective trapping and a low-pH MP for μLC-MS analysis might effectively decrease chemical noise and thus improve sensitivity, as illustrated by the cartoon in Figure S2. To examine this, we compared the S/N ratio under high- and low-pH trappings, both optimized, for the 10 model proteins in the plasma and tissue matrices. High-pH trapping with 1 mM ammonium formate at pH = 9.0 was found to be optimal on the basis of the evaluation of the S/N ratios, reproducibilities, and robustness of the 10 target proteins in the plasma and tissue samples (details not shown). Under the optimal selective-trapping and -delivery conditions for each method (discussed below), the S/N ratio of the SPs improved an average of >3-fold for the 10 proteins in plasma and tissues when the optimized high-pH trapping was used as compared with when the optimized low-pH trapping was used (Figure 2a), largely owing to the significantly reduced chemical noise, as exemplified in Figure 2b,c.
Figure 2.
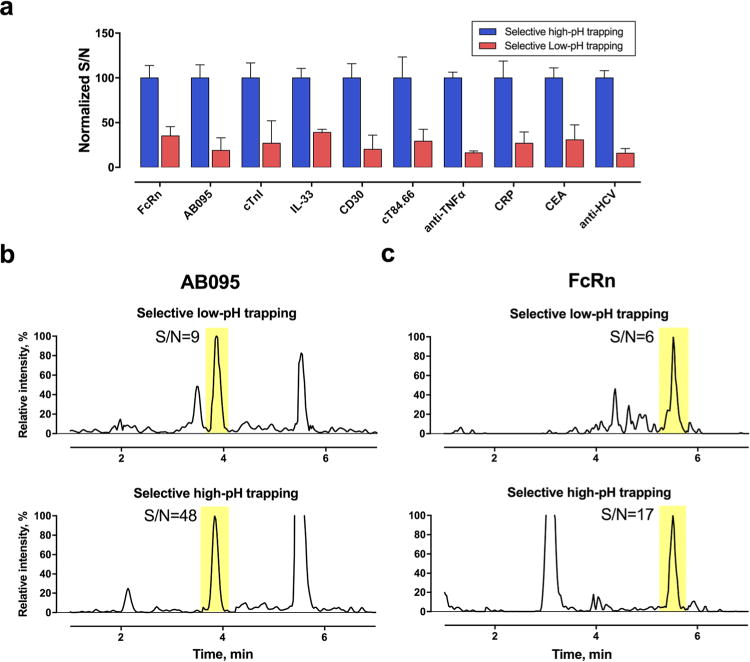
High-pH trapping improves the S/N ratio more than low-pH trapping. (a) Comparison of S/N for the 10 proteins in tissue or plasma by high-pH or low-pH trapping. The concentrations were ∼10× the limit of detection (LOD) for each protein. (b,c) Representative chromatograms from high-pH and low-pH trapping.
Development of Selective-Trapping and -Delivery Approaches
As illustrated in Figure 3a, synchronized-flow approaches were devised to enable the selective trapping and delivery of a target SP. An optimized, relatively strong high-pH MP is employed to load samples onto the trap, which selectively traps the SP and more hydrophobic components but not the matrix components (e.g., salts, peptides, polar organic acids, etc.) that are more hydrophilic than the targets (Figure 3a–I). The trap is then switched in line with the column for the delivery to the μLC-MS system using a microflow gradient (Figure 3a–II). As soon as the target SP completely leaves the trap (Figure 3a–III), the trap is switched off of the column and flushed with a strong organic buffer to remove the remaining matrix peptides that are more hydrophobic than the target and other hydrophobic components, such as lipids and long-chain fatty acids. That step is then followed by trap equilibration. Additionally, μLC-MS analyzes the target peptide (Figure 3a-III). Therefore, the μLC-MS only analyzes the fraction of the simplified biological sample that has the limited polarity, which not only markedly improves sensitivity, selectivity, robustness, and throughput but also prevents overcapacity of the μLC column when large amounts of biological samples are loaded.
Figure 3.
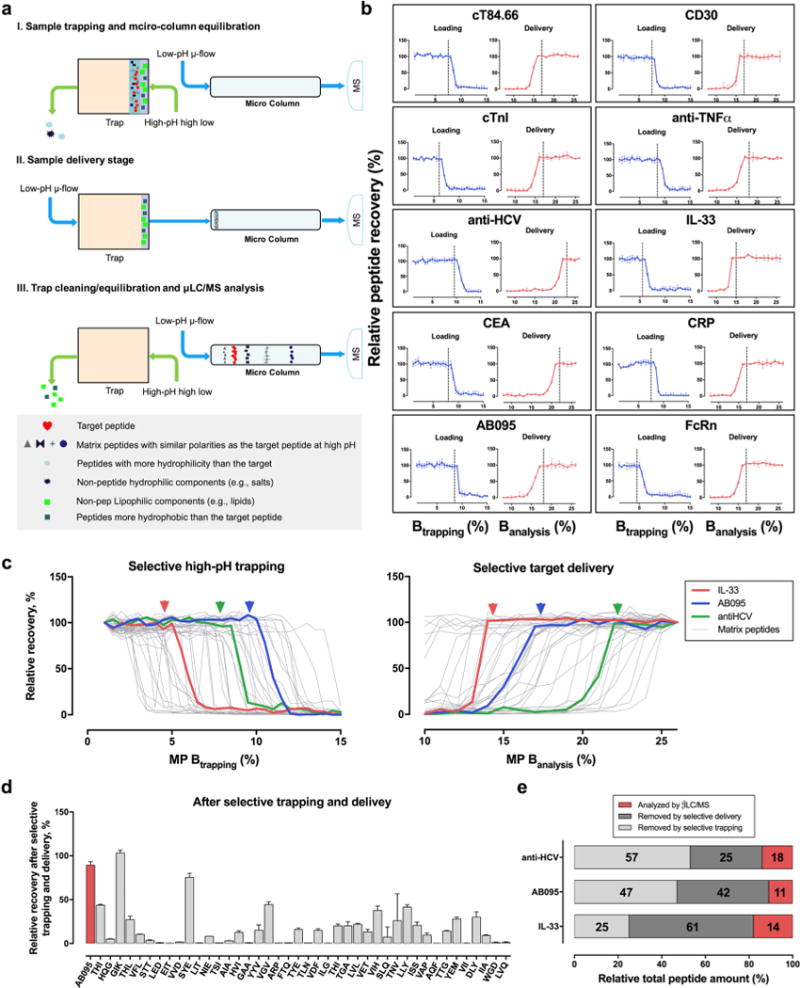
Selective-trapping and -delivery strategy. (a) Rationale for the selective-trapping and -delivery strategy that enhances selectivity, sensitivity, robustness, and throughput. (b) Development of the optimal trapping (high pH) and delivery (low pH) conditions for the 10 proteins in the biomatrices. (c) Recoveries of the 3 target SP (colored lines) vs those of the 42 representative coretrieved liver matrix peptides (gray lines, a detailed list of these peptides are in Table S2) under different loading and delivery conditions. (d) Example showing the recoveries of a target SP (AB095) vs those of the matrix peptides after selective trapping and delivery (n = 3). (e) Percentage distributions of the peptide masses that entered the μLC-MS system and those of the SPs removed by selective trapping and delivery.
In this procedure, two critical parameters need to be identified experimentally: the optimal B percentage for high-pH, high-flow-gradient (Btrapping percentage) selective trapping, and the optimal low-pH, low-flow-gradient B percentage (Banalysis percentage), at which point the trap is switched off of the column, marking the end of the delivery. A detailed description of development process is in the Supporting Information; the process can be readily programmed and is capable of simultaneously optimizing many candidate proteins in one set of runs. Figure 3b shows the optimization data for the determination of the two key parameters. For example, the SP of AB095 in the plasma digest can survive a maximum loading of 10% Btrapping, and when Banalysis reaches 17%, the MP target peptide is effectively delivered to the column. In order to ensure a robust analysis, the optimal conditions were taken down a notch for the trapping and up a notch for the target delivery; that is, 9% Btrapping and 18% Banalysis were used for AB095.
To evaluate the efficiency of removing matrix components by selective trapping and delivery, we simultaneously monitored the recovery of representative matrix peptides along with the target SP during the optimization process. These peptides are mostly from high-abundance matrix proteins and span a wide range of polarities and pIs (Table S2), and therefore are representative of the matrix peptides to be eliminated. Some representative data is shown in Figure 3c. Clearly, under the optimal trapping and delivery conditions for each of the three proteins (colored arrows), the matrix peptides are efficiently reduced with high recoveries of the target SPs. Figure 3d shows an example comparing the recoveries of the target SPs and matrix peptides. For AB095, 34 out of the 42 monitored matrix peptides were decreased by more than 70%, whereas the target SPs only lost <15%. We further investigated the peptide mass entering the μLC-MS systems versus those removed by selective trapping and delivery, using a mass-balance study based on BCA measurements of peptides in different fractions (cf. the Supplemental Experimental Methods). As shown in Figure 3e, the selective-trapping and -delivery strategy eliminates 85–88% of the total mass of matrix peptides before the μLC-MS analysis, which again efficiently improves selectivity, sensitivity, and robustness and avoids overcapacity of the μLC column, which is sensitive to the loading mass.13,23
Key Technical Issues Associated with Retention Behaviors and Flow Dynamics
Because the selective-trapping and -delivery strategy involves synchronizing two LC systems with distinct flow features, several technical issues associated with band broadening and abnormal gradient separation were observed. As illustrated in Figure S3 and S4, two measures were devised to address these issues: (i) Peak compression approaches were devised to avoid direct elution from the analytical column after the sample delivery. These include differential trap (C8) versus column (C18) retentions to improve the efficiency of the trapping and having the starting gradient include a starting B percentage for focusing, all of which were carefully optimized to enable a large loading amount without band broadening, thereby permitting sensitive and robust quantification. (ii) Gradient-shock artifacts associated with the selective delivery were compensated for. A detailed report and discussions are in the Supporting Information.
Narrow-Window-Isolation (NWI)-SRM to Improve S/N
We evaluated the utility of NWI-SRM, that is, using a narrower m/z window for precursor filtering on Q1, to further decrease the chemical noise from interfering peptides with close precursor m/z and therefore improve S/N. It was found that NWI-SRM at a 0.2 Th resolution markedly enhanced S/N for protein quantification in biological samples compared with a conventional 0.7 Th window. When a 0.2 Th Q1 isolation width was used on the segmented quadrupole, there were 50–70% decreases in the signal response than when a conventional 0.7 Th window was used, but the chemical noise decreased to much a higher extent for all the proteins examined here, resulting in considerable net gains of S/N. As shown in Figure S5a, using NWI-SRM with the T-μLC-MS, S/N improved 2.8–5.3-fold for the analyses of the 10 proteins in plasma or tissues. Figure S5b shows representative chromatograms comparing NWI-SRM and conventional SRM, in which improvements in S/N and deceased chemical noise and interfering peaks were clearly observed. Moreover, the NWI-SRM also significantly reduced the demand on the LC separation, which helped achieving shorter analytical cycles.
High-Capacity Loading to Achieve High Sensitivity
High-capacity loading substantially enhances target-signal intensity. However, our pilot study suggested that merely increasing loading amounts without improving selectivity will not result in significant gains in sensitivity, because the target-SP intensity increases linearly with the loading amount, but the S/N does not improve because of the concomitant increase in chemical noise (data not shown). We hypothesized that the selective approaches of high-pH loading, selective trapping and delivery, and NWI-SRM in combination with high loading amounts on T-μLC-MS would result in significantly improved sensitivity.
To test this hypothesis, we evaluated the S/N versus the sample loading masses using the optimized T-μLC-MS strategy. Some representative data is shown in Figure 4. Each of the proteins showed a range for the quantitative loading amounts, in which the S/N ratio exhibited a linear dependency on the loading amount. Clearly, the vastly reduced chemical noise by the three above-mentioned measures resulted in a much improved quantitative loading amount (i.e., the maximum loading mass that maintains a linear relationship with S/N) and enhanced sensitivity for T-μLC-MS. We further observed the limit for quantitative loading is dependent on the hydrophobicity of the target peptide. For relatively polar peptides, such as the SP from IL-33, a plateau was reached at an 80 μg injection, and then there is a decline in S/N with increasing loading masses. By comparison, nonpolar peptides, such as that from the anti-HCV mAb, maintain a linear relationship of S/N versus the loading mass up to 200 μg. This may be explained by the dynamics of peptide retention on the trap, where hydrophilic peptides exhibit an increasing propensity toward being replaced by more hydrophobic matrix peptides when the loading amount increases. The optimal loading mass for each protein is shown in Figure 4.
Figure 4.
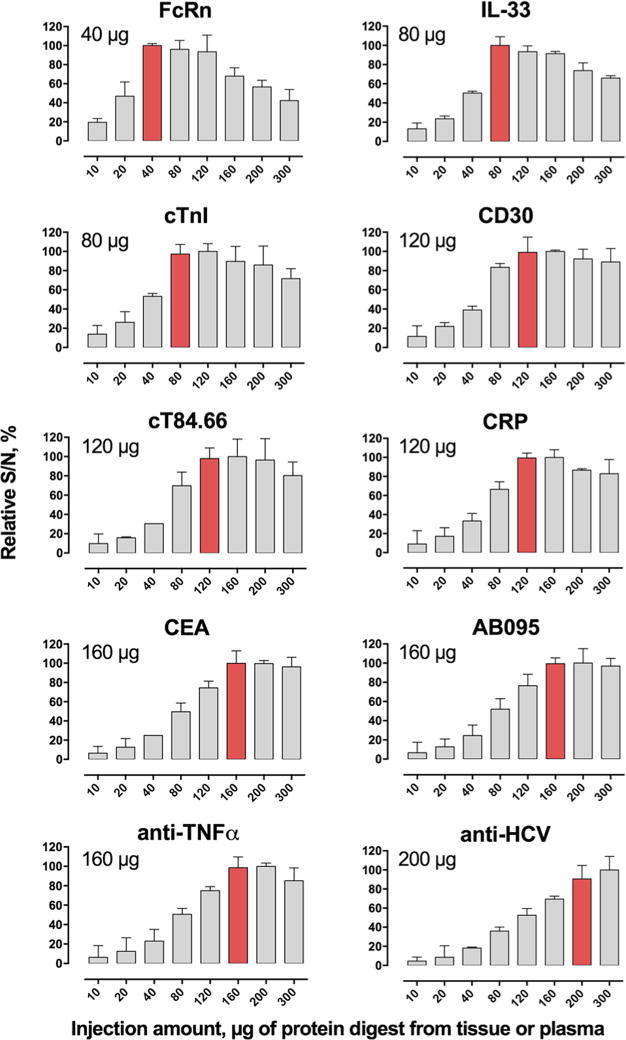
Overall sensitivity gains using different loading amounts for the 10 proteins in tissues and plasma (n = 3).
Overall Evaluation of Quantitative Sensitivity, Throughput, and Robustness
We performed a comparative investigation of the quantitative sensitivity, throughput, and robustness of the T-μLC-MS strategy against conventional LC-MS platforms, including nano-LC-MS (200 nL/min), μLC-MS (25 μL/min), and high-flow LC-MS (400 μL/min). For nano-LC-MS, a trap (300 μm i.d.) was employed7 with optimized high-pH trapping and selective trapping and delivery. All the methods employed NWI-SRM (Supplemental Experimental Methods). Quantitative methods with 1000-fold dynamic ranges were developed for each protein and platform, and the quantitative and validation data for T-μLC-MS platform are shown in Table 2.
Quantitative methods based on T-μLC-MS showed good linearities and acceptable accuracies and precisions, with limits of detection (LOD) ranging from 4.8 to 96.4 ng/mL in plasma or ng/g in tissues for 9 proteins without immuno-enrichment and an LOD of 0.05 ng/mL for cTnI after a simple antibody enrichment (Table 2). This level of sensitivity is comparable to that of the selective-trapping-nano-LC-MS method (3.8–71.7 ng/mL or ng/g), while being much higher than those of conventional μLC-MS (19.5–394.3 ng/mL or ng/g) and high-flow LC-MS (128.4–867.1 ng/mL or ng/g), as shown in Figure 5a. Figure 5b compares the cycle times of the four methods. With similar extents of separation of the target from the interfering peaks, T-μLC-MS permits an average cycle time of 8 min, comparable to that of high-flow LC-MS (an average of 6 min) but much more rapid than conventional μLC-MS (20 min) and nano-LC-MS (45 min). The high throughput of T-μLC-MS can be attributed to the unique, synchronized flow configurations and the selective-trapping and -delivery approach.
Figure 5.
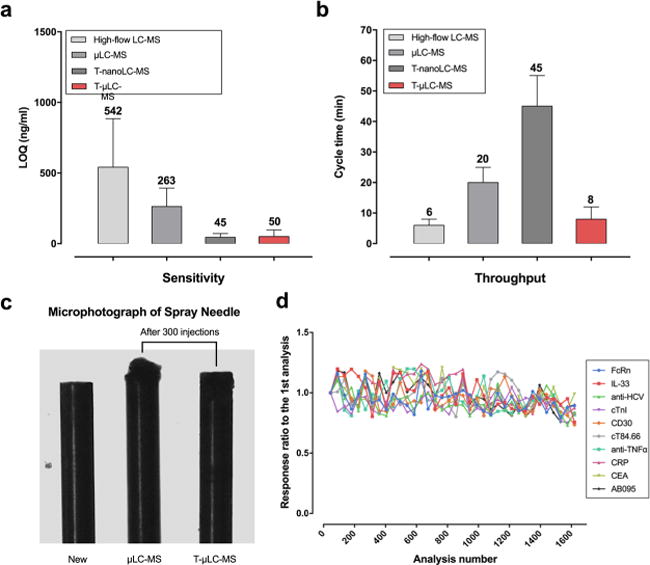
Evaluation of sensitivity, throughput, and robustness of the T-μLC-MS system. We compared T-μLC-MS with high-flow LC-MS (400 μL/min), μLC-MS (25 μL/min, without trapping), and trapping-nano-LC-MS (250 nL/min) by examining their (a) limits of quantification (LOQ) and (b) cycle times for the quantification of the 9 proteins (excluding cTnI) in nonenriched plasma or tissue samples. The same extent of separation of the target from the interfering peaks is achieved for each method (note: backgrounds are noisy for nonenriched samples). (c) Photomicrographs comparing new spray needles to these after 300 injections of plasma samples using μLC-MS (middle) and T-μLC-MS (right). (d) Graph demonstrating the high robustness of the T-μLC-MS system. Plasma samples spiked with the 10 SPs were injected every 60 injections of other plasma or tissue samples. No appreciable decreases in the signals were observed after >1600 injections.
Finally, high-pH loading and selective-trapping and -delivery approaches significantly reduce detrimental matrix components and nontarget peptides, and thereby substantially boosting the robustness of the system. For example, after 300 injections of plasma samples on a conventional μLC-MS, lumps of accumulated matrix contaminants were observed on the spray needle (Figure 5c, middle), resulting in a signal drop of >35%. By comparison, after 300 injections on a T-μLC-MS, no perceivable accumulation was observed (right), and it was almost comparable to a new one (left). Figure 5d shows the signal intensity of a benchmark plasma sample (spiked with the 10 proteins, digested, and injected every 60 runs) measured by T-μLC-MS (multiplexing mode) along with an increasing number of injections of plasma and tissue samples. No significant drop of intensity was observed after 1620 injections, indicating a high robustness, which is desirable for typical pharmaceutical and clinical investigations.
Quantification of multiple targets (multiplexing mode) can be performed by T-μLC-MS as well with good throughput and reasonable sensitivity, as demonstrated in Figure S6.
Applications in Circulating-Biomarker Analysis and Tissue-Protein-Therapeutic-Distribution Investigation
We examined the utility of the developed strategy by applying it in circulating biomarker quantification and in the investigation of the tissue distribution of an mAb drug and target antigen.
The presence of circulating cardiac troponin I (cTnI) has been considered the gold standard for the diagnosis of acute myocardial infarction.24 Nevertheless, increasing evidence demonstrates cTnI elevations in the absence of infarctions.25 It is important to distinguish the forms of circulating cTnI under diffident conditions, but this cannot be easily performed by immunoassays. As a first step, we employed the validated T-μLC-MS method (Table 2) to quantify circulating cTnI in swine models of brief, reversible ischemia leading to stunned myocardium (noninfarction) as well as prolonged occlusion followed by reperfusion, which is typical of an acute myocardial infarction. An anti-swine-cTnI antibody, which was efficient at binding the target but not sufficiently specific for reliable ELISA analysis, was used. After a straightforward enrichment, an LOQ of 0.1 ng/mL in plasma was achieved for swine cTnI (Table 2). Animals with brief ischemia (n = 4) demonstrated an elevation of cTnI to ∼1 ng/mL at 24 h, which is similar to what we reported using porcine specific immunoassays. In contrast, after prolonged ischemia, much higher levels of circulating cTnI were observed than were typical of infarctions (Figure 6a,b). Further studies are underway to identify whether the circulating form of cTnI represents the intact protein or is a degradation product, as demonstrated in myocardial tissue.
Figure 6.
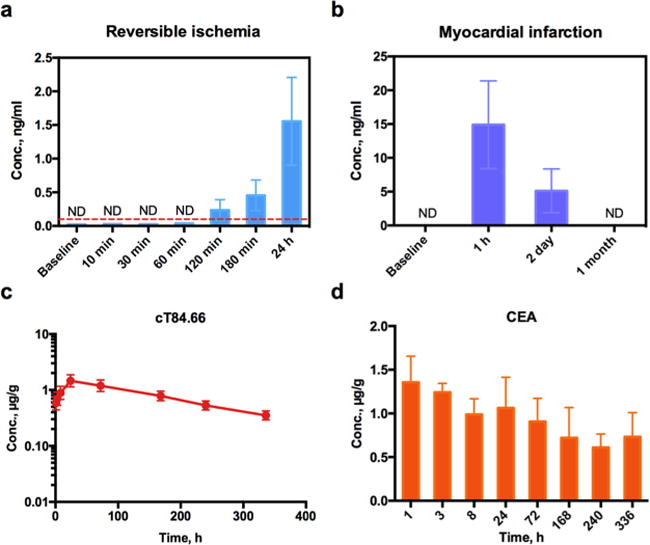
Application of the T-μLC-MS in the quantification of a circulating biomarker and biotherapeutic or target antigen in tissues. (a) Quantification of cardiac troponin I (cTnI) levels in swine plasma after a brief, reversible myocardial ischemia (n = 4). (b) cTnI release from a myocardial infarction model is used as positive control. Time courses of (c) mAb cT84.66 and (d) carcinoembryonic antigen (CEA), the target of the mAb, in an MC38CEA+ tumor from a C57BL/6 mouse model after a low (0.5 mg/kg), single IV injection.
Determination of the distribution of mAb therapeutics in targeted and nontargeted tissues is important for enabling comprehensive PBPK studies and the extensive evaluation of efficacy and off-target effects.26–28 However, direct quantification of protein therapeutics and their targets in tissues remains a daunting challenge, largely owing to the insufficient sensitivities and selectivities of the existing analytical techniques.29,30 Here we applied the developed T-μLC-MS method in the quantification of cT84.66 and its target antigen CEA in an MC38CEA+ tumor from a C57BL/6 mouse model after a low-dose IV injection. As shown in Figure 6c,d, both cT84.66 and CEA were quantified with sufficient sensitivity without any enrichment. The tumor exposure of cT84.66 reached Cmax at 24 h after administration, whereas the CEA level in the tumor showed a decreasing trend after administration, which might have been caused by target-mediated drug disposition (TMDD).31,32 Further investigation with multiple dosing levels and PBPK analyses are ongoing.
CONCLUSION
For targeted LC-MS quantification of biotherapeutics and disease and treatment biomarkers, it is essential to have a strategy for high sensitivity that maintains high throughput and robustness, which is too often difficult to achieve with the existing techniques. Here we described a T-μLC-MS method to address this urgent need.
The system employs a dual-flow system for high-capacity loading and sensitive μLC-MS analysis. High interference from numerous proteolytic matrix peptides counteracts the benefits of high-capacity loading and is by far the most prominent bottle-neck impeding sensitivity. In order to address this issue, three measures, namely, high pH loading, selective trapping and delivery, and NWI-SRM, were developed to effectively lower chemical noise and to improve selectivity and S/N. Under optimized conditions, a linear increase of S/N and an elevated loading capacity were observed, resulting in high sensitivity for the analysis of plasma and tissue samples. Furthermore, high-pH loading and selective trapping and delivery significantly simplifies biological matrices and prevents detrimental hydrophobic and hydrophilic components from entering the μLC-MS system. In this way, the μLC-MS only focuses on the analysis of a limited fraction of the biological sample, which not only improves sensitivity but also enhances robustness and throughput and prevents overcapacity of the μLC column with high loading amounts. Throughput is further enhanced by synchronized-flow approaches, such as parallel equilibration, flushing, and others.
A systemic evaluation demonstrated that T-μLC-MS exhibits a similar sensitivity to a selective-trapping-nano-LC-MS method and an average of 13-fold and 4-fold improvements in sensitivity compared with high-flow LC-MS and conventional μLC-MS, respectively; however, when it comes to throughput, the average analytical cycles by T-μLC-MS were comparable to those of high-flow LC-MS and were only 18 and 40% of the time required for trapping-nano-LC-MS and conventional μLC-MS, respectively. Finally, the T-μLC-MS demonstrates exceptional robustness. For example, it can handle continuous analysis of thousands of samples.
This method enabled, for the first time, sensitive LC-MS-based analysis of cTnI following brief as well as prolonged myocardial ischemia. It has also allowed, for the first time, the simultaneous analysis of low levels of protein biotherapeutics and their surface targets in the same tumors. New insights were obtained into the respective clinical and pharmaceutical systems.
In summary, the T-μLC-MS is a highly versatile, fit-for-purpose platform with excellent sensitivity and selectivity as well as high throughput and robustness. It can be readily adapted to the multiplexing quantification of many targets and coupled to various immune- or chemical-based-enrichment methods to further enhance sensitivity. Therefore, it can be widely applied in clinical and pharmaceutical investigations in which highly sensitive and robust analyses of large numbers of samples are desirable.
Supplementary Material
Acknowledgments
This work is supported, in part, by NIH grants HD071594 (J.Q.), GM121174 (J.Q.), AI125746(J.Q.), NS094181(J.Q.), HL103411 (J.Q.), NS096104(J.Q.), HL55324 (J.M.C.), and HL61610 (J.M.C.); a Center of Protein Therapeutics Industrial Award (J.Q.); a grant from the Department of Veterans Affairs, I01 BX002659-01A2 (J.M.C.); and an NIH CTSA award, UL1TR001412 (J.Q. and J.M.C.)
Footnotes
The Supporting Information is available free of charge on the ACS Publications website at DOI: 10.1021/acs.analchem.7b03949.
Chemical reagents and supplemental methods, results, and discussions (PDF)
Notes
The authors declare no competing financial interest.
References
- 1.Liebler DC, Zimmerman LJ. Biochemistry. 2013;52:3797–3806. doi: 10.1021/bi400110b. [DOI] [PMC free article] [PubMed] [Google Scholar]
- 2.Shi T, Sun X, Gao Y, Fillmore TL, Schepmoes AA, Zhao R, He J, Moore RJ, Kagan J, Rodland KD, Liu T, Liu AY, Smith RD, Tang K, Camp DG, 2nd, Qian WJ. J Proteome Res. 2013;12:3353–3361. doi: 10.1021/pr400178v. [DOI] [PMC free article] [PubMed] [Google Scholar]
- 3.Neubert H, Muirhead D, Kabir M, Grace C, Cleton A, Arends R. Anal Chem. 2013;85:1719–1726. doi: 10.1021/ac303031q. [DOI] [PubMed] [Google Scholar]
- 4.Xu K, Liu L, Maia M, Li J, Lowe J, Song A, Kaur S. Bioanalysis. 2014;6:1781–1794. doi: 10.4155/bio.14.142. [DOI] [PubMed] [Google Scholar]
- 5.Qu M, An B, Shen S, Zhang M, Shen X, Duan X, Balthasar JP, Qu J. Mass Spectrom Rev. 2017;36:734. doi: 10.1002/mas.21500. [DOI] [PubMed] [Google Scholar]
- 6.Hoofnagle AN, Wener MH. J Immunol Methods. 2009;347:3–11. doi: 10.1016/j.jim.2009.06.003. [DOI] [PMC free article] [PubMed] [Google Scholar]
- 7.Duan X, Dai L, Chen SC, Balthasar JP, Qu J. J Chromatogr A. 2012;1251:63–73. doi: 10.1016/j.chroma.2012.06.007. [DOI] [PMC free article] [PubMed] [Google Scholar]
- 8.Gautier V, Mouton-Barbosa E, Bouyssie D, Delcourt N, Beau M, Girard JP, Cayrol C, Burlet-Schiltz O, Monsarrat B, Gonzalez de Peredo A. Mol Cell Proteomics. 2012;11:527–539. doi: 10.1074/mcp.M111.015230. [DOI] [PMC free article] [PubMed] [Google Scholar]
- 9.Palandra J, Finelli A, Zhu M, Masferrer J, Neubert H. Anal Chem. 2013;85:5522–5529. doi: 10.1021/ac4006765. [DOI] [PubMed] [Google Scholar]
- 10.Shi T, Fillmore TL, Sun X, Zhao R, Schepmoes AA, Hossain M, Xie F, Wu S, Kim JS, Jones N, Moore RJ, Pasa-Tolic L, Kagan J, Rodland KD, Liu T, Tang K, Camp DG, 2nd, Smith RD, Qian WJ. Proc Natl Acad Sci U S A. 2012;109:15395–15400. doi: 10.1073/pnas.1204366109. [DOI] [PMC free article] [PubMed] [Google Scholar]
- 11.Noga M, Sucharski F, Suder P, Silberring J. J Sep Sci. 2007;30:2179–2189. doi: 10.1002/jssc.200700225. [DOI] [PubMed] [Google Scholar]
- 12.Christianson CC, Johnson CJ, Needham SR. Bioanalysis. 2013;5:1387–1396. doi: 10.4155/bio.13.73. [DOI] [PubMed] [Google Scholar]
- 13.Qu J, Qu Y, Straubinger RM. Anal Chem. 2007;79:3786–3793. doi: 10.1021/ac062184r. [DOI] [PubMed] [Google Scholar]
- 14.Cao J, Covarrubias V, Straubinger RM, Wang H, Duan X, Yu H, Qu J, Blanco JG. Anal Chem. 2010;82:2680–2689. doi: 10.1021/ac902314m. [DOI] [PMC free article] [PubMed] [Google Scholar]
- 15.Duan X, Abuqayyas L, Dai L, Balthasar JP, Qu J. Anal Chem. 2012;84:4373–4382. doi: 10.1021/ac2034166. [DOI] [PMC free article] [PubMed] [Google Scholar]
- 16.Nouri-Nigjeh E, Zhang M, Ji T, Yu H, An B, Duan X, Balthasar J, Johnson RW, Qu J. Anal Chem. 2014;86:3575–3584. doi: 10.1021/ac5001477. [DOI] [PMC free article] [PubMed] [Google Scholar]
- 17.Qu J, Lesse AJ, Brauer AL, Cao J, Gill SR, Murphy TF. BMC Microbiol. 2010;10:162. doi: 10.1186/1471-2180-10-162. [DOI] [PMC free article] [PubMed] [Google Scholar]
- 18.Nouri-Nigjeh E, Sukumaran S, Tu C, Li J, Shen X, Duan X, DuBois DC, Almon RR, Jusko WJ, Qu J. Anal Chem. 2014;86:8149–8157. doi: 10.1021/ac501380s. [DOI] [PMC free article] [PubMed] [Google Scholar]
- 19.Tu CJ, Dai J, Li SJ, Sheng QH, Deng WJ, Xia QC, Zeng R. J Proteome Res. 2005;4:1265–1273. doi: 10.1021/pr0497529. [DOI] [PubMed] [Google Scholar]
- 20.Yang F, Shen Y, Camp DG, 2nd, Smith RD. Expert Rev Proteomics. 2012;9:129–134. doi: 10.1586/epr.12.15. [DOI] [PMC free article] [PubMed] [Google Scholar]
- 21.Batth TS, Francavilla C, Olsen JV. J Proteome Res. 2014;13:6176–6186. doi: 10.1021/pr500893m. [DOI] [PubMed] [Google Scholar]
- 22.Ruprecht B, Koch H, Domasinska P, Frejno M, Kuster B, Lemeer S. Methods Mol Biol. 2017;1550:47–60. doi: 10.1007/978-1-4939-6747-6_5. [DOI] [PubMed] [Google Scholar]
- 23.Yu H, Straubinger RM, Cao J, Wang H, Qu J. J Chromatogr A. 2008;1210:160–167. doi: 10.1016/j.chroma.2008.09.052. [DOI] [PMC free article] [PubMed] [Google Scholar]
- 24.Labugger R, Organ L, Collier C, Atar D, Van Eyk J. E. Circulation. 2000;102:1221–1226. doi: 10.1161/01.cir.102.11.1221. [DOI] [PubMed] [Google Scholar]
- 25.Weil BR, Young RF, Shen S, Suzuki G, Qu J, Malhotra S, Canty JM., Jr J Am Coll Cardiol Basic Trans Science. 2017;2:105–114. doi: 10.1016/j.jacbts.2017.01.006. [DOI] [PMC free article] [PubMed] [Google Scholar]
- 26.Neubert H, Fountain S, King L, Clark T, Weng Y, O’Hara DM, Li W, Leung S, Ray C, Palandra J, Ocana MF, Chen J, Ji C, Wang M, Long K, Gorovits B, Fluhler E. Bioanalysis. 2012;4:2589–2604. doi: 10.4155/bio.12.234. [DOI] [PubMed] [Google Scholar]
- 27.Lee JW, Salimi-Moosavi H. Bioanalysis. 2012;4:2513–2523. doi: 10.4155/bio.12.220. [DOI] [PubMed] [Google Scholar]
- 28.Glassman PM, Abuqayyas L, Balthasar JP. J Clin Pharmacol. 2015;55(Suppl 3):S29–38. doi: 10.1002/jcph.365. [DOI] [PubMed] [Google Scholar]
- 29.Smith KM, Xu Y. Bioanalysis. 2012;4:741–749. doi: 10.4155/bio.12.19. [DOI] [PubMed] [Google Scholar]
- 30.Sleczka BG, Mehl JT, Shuster DJ, Lewis KE, Moore R, Vuppugalla R, Rajendran S, D’Arienzo CJ, Olah TV. Bioanalysis. 2014;6:1795–1811. doi: 10.4155/bio.14.143. [DOI] [PubMed] [Google Scholar]
- 31.Mager DE. Biochem Pharmacol. 2006;72:1–10. doi: 10.1016/j.bcp.2005.12.041. [DOI] [PubMed] [Google Scholar]
- 32.Cao Y, Jusko WJ. J Pharmacokinet Pharmacodyn. 2014;41:375–387. doi: 10.1007/s10928-014-9372-2. [DOI] [PMC free article] [PubMed] [Google Scholar]
- 33.An B, Zhang M, Qu J. Drug Metab Dispos. 2014;42:1858. doi: 10.1124/dmd.114.058917. [DOI] [PMC free article] [PubMed] [Google Scholar]
Associated Data
This section collects any data citations, data availability statements, or supplementary materials included in this article.


