

Abstract
Vascular endothelial cells lining the arteries are sensitive to wall shear stress (WSS) exerted by flowing blood. An important component of the pathophysiology of vascular diseases, WSS is commonly estimated by centerline ultrasound Doppler velocimetry (UDV). However, the accuracy of this method is uncertain. We have previously validated the use of a novel, ultrasound based, particle image velocimetry technique (echo PIV) to compute two-dimensional velocity vector fields, which can easily be converted into WSS data. We compared WSS data derived from UDV and echo PIV in the common carotid artery of 27 healthy participants. Compared with echo PIV, time-averaged WSS was lower using UDV (28 ± 35%). Echo PIV revealed that this was due to considerable spatio-temporal variation in the flow velocity profile, contrary to the assumption that flow is steady and the velocity profile is parabolic throughout the cardiac cycle. The largest WSS underestimation by UDV was found during peak-systole (118 ± 16%) and the smallest during mid-diastole (4.3 ± 46%). The UDV method underestimated WSS for the accelerating and decelerating systolic measurements (68 ± 30% and 24 ± 51%) whereas WSS was overestimated for end-diastolic measurements (−44 ± 55%). Our data show that UDV estimates of WSS provided limited and largely inaccurate information about WSS and that the complex spatio-temporal flow patterns do not fit well with traditional assumptions about blood flow in arteries. Echo PIV derived WSS provides detailed information about this important but poorly understood stimulus that influences vascular endothelial pathophysiology.
Keywords: Ultrasound, Echo PIV, UIV, blood flow, haemodynamics, vascular
Introduction
Hemodynamic wall shear stress (WSS) plays an important role in the development and progression of vascular endothelial dysfunction and atherosclerosis (Ku et al., 1985; Gimbrone, 1999; Reneman et al., 2006; Caro, 2009; Markl et al., 2013). Endothelial cells lining the arterial walls are sensitive to the mechanical forces exerted by flowing blood and respond to the different types of WSS transduced (Barakat & Lieu, 2003). For example, the low and oscillatory type of WSS is known to be atherogenic (Reneman et al., 2006; Caro, 2009). However, it is difficult to accurately quantitate in vivo WSS in humans and this has limited our mechanistic understanding of the significance of low and/or oscillatory flow in endothelial dysfunction, atherogenesis and plaque rupture (Nagel et al., 1999; White et al., 2001; Barakat & Lieu, 2003; Li et al., 2009; Peiffer et al., 2013). In particular, it is difficult to measure flow with the spatial and temporal resolution sufficient to determine accurate estimates of WSS. High spatio-temporal resolution means flow patterns can be measured near the vessel walls throughout the cardiac cycle to determine any time-varying characteristics in WSS that might be physiologically and clinically important. This is relevant because spatial gradients in shear enhance activation of endothelial transcription factors (Nagel et al., 1999) and temporal gradients that are caused by high flow pulsatility are known to stimulate endothelial cell proliferation and inflammatory gene expression (White et al., 2001; Li et al., 2009).
Current methods to estimate in vivo WSS are primarily based on two imaging modalities: Phase-contrast magnetic resonance imaging (PC-MRI) and ultrasound imaging. PC-MRI provides volumetric flow visualization but is relatively expensive, time consuming, and has limited spatial and temporal resolution (Wu et al., 2004; Zhang et al., 2011a; Markl et al., 2011). Because of this, ultrasound Doppler velocimetry (UDV) has become a popular method to estimate WSS in studies of the natural history of atherosclerotic plaque (e.g. carotid artery plaque) and endothelial function (e.g. flow-mediated dilatation; Reneman et al., 2006). This method is inexpensive and readily available, but it uses a one-dimensional velocity component rather than measuring the whole velocity vector field. Thus, it is not possible to measure the spatial gradient of the velocity profile near the vessel wall, which is required to calculate WSS. Instead, UDV measures the centerline peak velocity (Vmax), which is then extrapolated over a theoretical parabola from near to far wall, in accordance with the assumptions of the Hagen-Poiseuille Law and/or Womersley’s oscillatory flow theory. However, problems arise if pulsatile arterial flow does not exhibit a parabolic velocity profile, because any discrepancy between the actual and the assumed velocity profiles introduces error into the WSS measurement (Reneman et al., 2006; Mynard et al., 2013; Mynard & Steinman, 2013).
With the convenience of ultrasound imaging, a method that uses a two-dimensional (2D) ultrasound image of the arterial segment to measure the local flow velocity distribution could provide additional information about blood flow and WSS. We have developed an ultrasound based method called echo particle image velocimetry (echo PIV) that produces a 2D velocity vector field within an arterial segment, from which spatial and temporal local WSS measurements are obtained. Our in vitro and in vivo validation studies have shown that echo PIV can accurately measure WSS with high spatial and temporal resolution (Kim et al., 2004; Zheng et al., 2006; Liu et al., 2008; Zhang et al., 2011a; Gurung et al., 2017). The purpose of this study was to compare common carotid artery WSS measurements obtained from UDV to those obtained from echo PIV.
Methods
Ethical approval
This study conformed to the Declaration of Helsinki and was approved by the UK National Research Ethics Service Southwest (09/H0202/49). All participants gave written informed consent.
Participant screening and baseline characteristics
Participants were apparently healthy men and women recruited at the National Institute for Health Research Exeter Clinical Research Facility, UK. Participants were asked to refrain from food or drink (except water) at least 2 hours before the visit, and to avoid smoking, drinking tea or coffee, alcohol and strenuous exercise on the study day. Medical history, electrocardiogram (ECG), height, body mass, waist circumference, and blood pressure were obtained. Twelve-hour-fasting blood samples were collected in accordance with the U.K. National Quality Assessment Scheme. Doppler ultrasound measurements were collected before contrast agent injection (SonoVue, Bracco, Italy) and echo PIV imaging. Twelve participants were involved in the initial experimentation to determine optimal micro-bubble concentration as guided by our prior work (Zheng et al., 2006; Liu et al., 2008). Exclusion criteria included: History of uncontrolled hypertension, pulmonary hypertension, renal disease, hepatic disease, claudication, hypersensitivity to the contrast agent and individuals outside the age range of 20 to 80 years. Inclusion criteria for analysis of subject data files were: clear delineation of the lumen boundary on the B-mode image and comparable peak velocity measurements between UDV and echo PIV. Data files were excluded if contrast agent density was inadequate to obtain accurate PIV results.
UDV based WSS measurement
Pulsed wave Doppler imaging (Ultrasonix 500 RP, Analogic BK Ultrasound, Richmond, BC, Canada) was used to measure maximum blood flow velocity (Vmax) from the right common carotid artery with the sample volume placed in the center of the vessel at a recorded location upstream of the carotid bifurcation. The pulse repetition frequency was set at 5 kHz with the transducer (L14-5/38) parallel to the centerline axis of the artery and Doppler angle set at 60° (Bushberg et al., 2002). WSS was calculated from the centerline Vmax using the standard Hagen-Poiseuille’s equation (Ford et al., 2008; Mynard & Steinman, 2013):
| (1) |
where D is carotid artery inner diameter and μ is dynamic viscosity assumed constant at 0.032 Poise (Figure 1). Equation (1) uses the Poiseuillean assumptions that flow is steady, fully developed (i.e. shape of the flow velocity profile does not change and the mean velocity is half the maximum flow velocity) and has a parabolic velocity profile. The UDV derived WSS measurement (WSSVmax) provides an estimate of the mean flow WSS within the Poiseuillean flow assumptions.
Figure 1.

Flow diagram of two different methods of measuring arterial wall shear stress in vivo.
Ultrasound Doppler Velocimetry calculates flow induced shear stress on the vessel walls by assuming a parabolic velocity profile across the arterial lumen. In contrast, echo particle image velocimetry measures actual velocity profiles by statistically tracking ultrasound images of seeded particles (micro-bubble contrast agent) at consecutive time points. Spatial change in the velocity is calculated near the near and far walls, from which wall shear stress (WSS) is computed.
Echo PIV derived flow variables
We have previously shown that echo PIV accurately measures velocity profiles in vivo and in vitro by tracking grayscale image patterns of microbubbles in flow (Kim et al., 2004; Zheng et al., 2006; Liu et al., 2008; Zhang et al., 2011a; Gurung et al., 2017). Echo PIV uses ultrasound B-mode rather than Doppler for flow measurement and is inherently capable of measuring two-dimensional velocity vector fields. The use of contrast microbubbles gives excellent signal discrimination between tissue and blood and allows velocity measurement close to the vessel walls. The echo PIV imaging window was selected to overlap with the location of the UDV measurements such that both UDV and echo PIV measured a similar flow region. The long axis of the transducer probe was aligned longitudinally with the centerline of the blood vessel such that blood flow was orthogonal to the ultrasound beam direction. This alignment provides a longitudinal view of contrast-enhanced flow that is recorded as a time-series of images acquired at very high frame rates (480 – 680 frame per second), with ECG-gating for post-processing synchronization.
The echo PIV velocity vector field was computed by cross-correlating consecutive frames (1100 to 3200) in the time sequence, as reported in our prior work (Zhang et al. 2011). The spatial and temporal local velocity vector field was used to construct the flow velocity profile spanning the arterial diameter at different time points. The shape of the velocity profile was quantified by an estimation parameter called the shape-index (s-index). The s-index (s) was derived by fitting the following analytical velocity profile (Reneman et al., 2006):
| (2) |
Using equation (2), an s-index of 2 generates a parabolic profile representative of fully developed laminar flow (i.e. the shape of the velocity profile does not change); this also represents the foundational assumption behind the UDV-method for calculating WSS. S-index values greater than 2 represent velocity profiles that are blunted at the center with sharp spatial gradients at the vessel walls. We extracted the echo PIV measured velocity profiles at five different time points in the cardiac cycle, as follows: 1) accelerating systole past the time-averaged value (C1), 2) peak systole (C2), 3) decelerating systole coinciding with the first notch (C3), 4) mid-diastole (about 60% into the cardiac cycle; C4) and 5) end-diastole (C5). These five time points were selected to investigate WSS distribution at characteristic points in the cardiac cycle where flow patterns vary significantly, e.g. accelerating flow (C1) is known to be less turbulent compared to mid-late systole (C3) and early-mid diastole (C4) (Fung, 1984; Salsac et al., 2006; Nichols et al., 2011; Heffernan et al., 2013). Characterizing the spatial and temporal variation of these velocity profiles allowed us to compare the mean flow WSS estimate, obtained via the conventional UDV method with instantaneous and time-averaged echo PIV WSS.
Characterization of flow pulsatility using the Womersley number
The non-dimensional Womersley (α) number was also obtained for each participant, which is a ratio of the unsteady inertial force governed by the fluid density (ρ) and the angular frequency (ω), defined as 2Π/T where T is the time duration of one cardiac cycle (Salsac et al., 2006):
| (3) |
At a lower α, the viscous force dominates, favoring a parabolic velocity profile. Therefore, α of 1 or less indicates a fully developed parabolic velocity profile whereas a value larger than 1 indicates a blunter profile. The UDV method of estimating WSS assumes α of 1; thus echo PIV WSS measurements with values larger than 1 indicate larger differences between the two methods.
Echo PIV based WSS measurement
WSS was calculated directly from the echo PIV derived local velocity vector field by computing its spatial gradient (dv/dy, also known as shear rate, where v is the radial velocity and y is the spatial position) at the radius (R):
| (4) |
Equation (4) estimated at y = R provides the shear stress at the wall (Figure 1 in (Liu et al., 2008)). Accuracy of wall segmentation was improved by using a semi-automated, intensity-based edge detection technique that employs a series of filtering and thresholding schemes to obtain a boundary-enhanced and lumen-uniformed image. We have previously shown that, using this method, a mean absolute difference from the ground truth of 4 pixels can be achieved (Zhang et al., 2009). The time sequence of velocity vector fields obtained from echo PIV allowed extraction of detailed shear rate information. Spatially local WSS measurements (i.e. WSS measured at one spatial point along the vessel length within the field of view) were used to compare against the UDV estimates. Temporal WSS values were extracted at the five different points in the cardiac cycle (i.e., C1 - C5) described above. Mean WSS was calculated as the time-averaged WSS across one full cardiac cycle. Echo PIV WSS measurements were obtained from both the near and far walls of the artery and averaged (Figure 2a).
Figure 2.
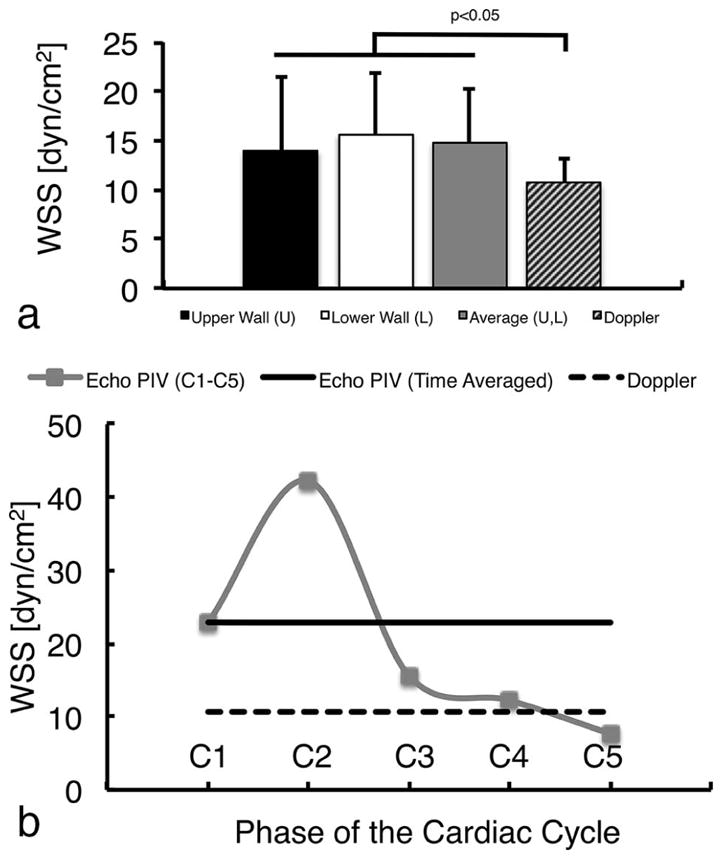
Comparison of echo PIV-derived wall shear stress with the ultrasound Doppler velocimetry estimates.
No significant difference was found in WSS measurements obtained by echo PIV at the near and far carotid artery walls (a); average of the two walls is also shown and used for further analysis. Time Averaged (TA) WSS was significantly different between the two methods (a). Doppler WSS measurement differed significantly from echo PIV measurements at different cardiac phases (b): at the accelerating (C1), peak (C2) and decelerating (C3) systolic phases, and end-diastole (C5). No difference was found during mid-diastole (C4). Statistical significance was obtained at p<0.05.
Ensemble averaged WSS waveform analysis
Because Echo PIV produces more detailed characterization of WSS than UDV, we performed a qualitative and quantitative analysis on an ensemble averaged waveform. To construct the ensemble averaged waveform, WSS waveforms obtained from each individual in the cohort were spatially and temporally phase averaged. Spatial averaging was performed by taking the average of WSS values over 4 mm along the length of the CCA (WSS was steady across the vessel length; no significant difference was found). Phase averaging involved averaging the WSS values across three to four cardiac cycles at each of the five characteristic phases selected (i.e. phases C1-C5). We then derived: 1) the time-averaged (TA) WSS; 2) the decay rate of the systolic peak shear, calculated by fitting an exponential decay curve to data points extracted from the systolic peak to the base of the first notch; and 3) the time duration of the systolic shear force calculated by the time difference between the initial systolic upstroke and the first prominent notch post systole (systolic shear stress pulse).
Statistical analysis
Our primary variable of interest was the time-averaged WSS derived from UDV and Echo PIV. We also determined differences between UDV-derived WSS and instantaneous WSS measurements at five time-points in the cardiac cycle derived from echo PIV. Percent difference in WSS measurements between the UDV and the echo PIV methods was calculated:
| (5) |
where WSSi [i = (1, 5)] indicates the echo PIV WSS measurements extracted at the five characteristic time points. The percent difference between the two mean WSS estimates was calculated in a similar manner. Paired t-test was used for all comparisons. A one-way balanced ANOVA was conducted to determine differences in WSS at different time points in the cardiac cycle (C1-C5). A probability of p<0.05 was considered statistically significant for both tests. WSS measurements obtained from the two methods are presented as mean ± standard deviation. Statistical analyses were performed using MATLAB 2013b (MathWorks, Inc., Natick, MA, USA).
Results
Participant characteristics
The study population comprised 37 apparently healthy participants. Evaluation of data from 12 participants was needed to determine the quality and density of contrast agent required within the arterial lumen for optimal echo PIV analysis. After excluding inadequate data files, datasets from 27 participants were included in the analysis. Characteristics from these participants are presented in Table 1.
Table 1.
Participant characteristics
| Parameter (n=27) | Mean ± SD |
|---|---|
| Age (y) | 55.2 ± 12 |
| Male/Female | 18/9 |
| Body mass (kg) | 72.4 ± 10 |
| Height (m) | 1.7 ± 0.1 |
| Body mass index | 24.4 ± 3 |
| Waist circ. (cm) | 85.6 ± 9 |
| Hip circ. (cm) | 96.3 ± 8 |
| Waist-Hip Ratio | 0.9 ± 0.1 |
| Systolic BP (mmHg) | 124 ± 13 |
| Diastolic BP (mmHg) | 77.5 ± 9 |
| Pulse Pressure (mmHg) | 46.4 ± 8.9 |
| Heart Rate (b/min) | 63.8 ± 9 |
| Cholesterol (mmol/L) | 5.4 ± 0.9 |
| Triglycerides (mmol/L) | 1.2 ± 0.5 |
| HDL-Chol (mmol/L) | 1.5 ± 0.4 |
| LDL-Chol (mmol/L) | 3.4 ± 0.8 |
| Chol:HDL | 3.9 ± 1 |
| Sodium (mmol/L) | 139.3 ± 2 |
| Potassium (mmol/L) | 4.5 ± 0.4 |
| Creatinine (mmol/L) | 78.8 ± 13 |
| Albumin (g/L) | 45.1 ± 3 |
Circ = circumference; BP = blood pressure; Chol = Cholesterol; HDL = high density lipoprotein; LDL = low density lipoprotein; TG = triglycerides
Differences between UDV and echo PIV
Mean WSS calculated from UDV was lower than the time averaged WSS measured using echo PIV (10.1 ± 2 dyn/cm2 versus 14.8 ± 5 dyn/cm2, p<0.001, Figure 2a). Compared with echo PIV WSS at C1-C5, the UDV method underestimated WSS at C1, C2 and C3 (22.2 ± 8 dyn/cm2, 41.2 ± 12 dyn/cm2 and 14.5 ± 7 dyn/cm2 respectively) and over-estimated at C5 (7.34 ± 4 dyn/cm2, all p<0.005) (Figure 2b). No significant difference was found between the two WSS estimates at C4 (11.9 ± 5 dyn/cm2). These differences remained when WSS at the near and far walls of the artery were derived from echo PIV and compared with UDV WSS (Table 2). There were no differences between WSS measured with echo PIV at the near and far walls at C1-C5 or when time-averaged across the cardiac cycle.
Table 2.
Descriptive statistics of WSS parameters from Echo PIV for near and far walls and the average of the two.
| Near Wall Shear Stress | Far Wall Shear Stress | Averaged Wall Shear Stress | ||||
|---|---|---|---|---|---|---|
| dyn/cm2 | Range | dyn/cm2 | Range | dyn/cm2 | Range | |
| TA | 14 ± 7 | [2,29] | 15.7 ± 6 | [5,33] | 14.8 ± 5 | [5,30] |
| C1 | 22.4 ± 11 | [5,42] | 23.3 ± 8 | [8,43] | 22.9 ± 8 | [10,43] |
| C2 | 41.1 ± 16 | [14,72] | 44.0 ± 15 | [24,89] | 42.3 ± 13 | [24,81] |
| C3 | 16.1 ± 10 | [2,40] | 15.1 ± 10 | [1.7,47] | 15.6 ± | [2,43] |
| C4 | 11.2 ± 9 | [0.6,33] | 13.2 ± 7 | [3,30] | 12.2 ± 6 | [3,25] |
| C5 | 7.05 ± 6 | [0.3,21] | 8.30 ± 5 | [0.80,23] | 7.68 ± 5 | [0.6,22] |
| D | 10.7 ± 3 | [6,18] | 10.7 ± 3 | [6,18] | 10.7 ± 3 | [6,18] |
Values are mean±SD and the range is [Min, Max]. All values were significantly different from the ultrasound Doppler estimates (p<0.05), except for the mid-diastole. TA = Time averaged, C1 = Accelerating systole, C2 = Peak systole, C3 = Decelerating systole, C4 = Mid-diastole, C5 = End-diastole, D = ultrasound Doppler velocimetry (UDV); please note that the UDV method only measures the single, time-averaged centerline velocity.
Percent differences in WSS measurements between the echo PIV and UDV methods are presented in Table 3. The largest percent difference was found during peak-systole (C2; underestimation by 119 ± 17%) and the smallest during mid-diastole (C4; underestimation by 3.7 ± 48%). Compared with echo PIV, the UDV method overestimated WSS values during end-diastole (C5; 43.5 ± 55%).
Table 3.
Percent difference between echo PIV- and ultrasound Doppler- derived wall shear stress at the near wall, far wall and the average of both walls
| Near Wall Shear Stress | Far Wall Shear Stress | Averaged Wall Shear Stress | ||||
|---|---|---|---|---|---|---|
| Mean [%] | Range [%] | Mean [%] | Range [%] | Mean [%] | Range [%] | |
| TA | 13.2 ± 54 | [−121,93] | 32.4 ± 39 | [−63,98] | 28.2 ± 35 | [−51,76] |
| C1 | 57.0 ± 45 | [−71,147] | 70.3 ± 31 | [−14,113] | 67.8 ± 30 | [10,130] |
| C2 | 112 ± 26 | [54,154] | 118 ± 20 | [62,154] | 118 ± 16 | [74,142] |
| C3 | 16.6 ± 70 | [−117,132] | 14.3 ± 69 | [−139,95] | 24.8 ± 51 | [−123,117] |
| C4 | −22.9 ± | [−179,102] | 9.87 ± 51 | [−89,85] | 4.30 ± | [−104,70] |
| C5 | −61.5 ± 70 | [−189,56] | −37.3 ± 60 | [−167,71] | −43.5 ± 55 | [−176,40] |
Values are mean±SD and the range is [Min, Max]. All values were significantly different from the ultrasound Doppler estimates (p<0.05), except for the mid-diastole.
TA = Time averaged, C1 = Accelerating systole, C2 = Peak systole, C3 = Decelerating systole, C4 = Mid-diastole, C5 = End-diastole, Averaged = WSS averaged over the UW and LW.
Blood flow velocity profiles and shape index
Compared with the parabolic profile assumed in UDV, the shape of the velocity profile measured using the echo PIV method varied spatially across the vessel diameter and temporally within the cardiac cycle (Figure 3). In contrast to a constant value of 2 assumed in the UDV method (i.e. a parabolic velocity profile throughout the cardiac cycle), echo PIV measurements revealed that the mean s-index was 4.3 ± 3 at C1, 7.4 ± 4 at C2, 6.4 ± 5 at C3, 4.5 ± 2 at C4 and 3.6 ± 3 at C5. The s-index was significantly different at different phases of the cardiac cycle (p<0.001). S-index distribution and its influence on the shape of the velocity profile are shown in Figure 3. Womersley numbers (α) ranged from 3.48 to 6.88, indicating that the actual velocity profile tended to be less parabolic and more blunt at the center of the blood vessel with sharp gradients at the walls (that is, the assumed parabola was not fully formed).
Figure 3.

Spatial and temporal variation in velocity profiles at C1-C5 for each participant.
Distribution of the s-index for all participants extracted at five different time points (C1-C5) reveals spatio-temporal variation in the velocity profile within a cardiac cycle. An s-index of 2 indicates a parabolic profile (as shown by the parabolic velocity profile in the inset figure, labeled with an s-index of ‘2’ and also indicated by the dashed line labeled “Poiseuille” in the scatter plot) that is symmetric across the center axis of the vessel, whereas a value larger than 2 indicates a blunted profile (inset figure labeled with a s-index of ‘7’).
Ensemble averaged WSS waveform analysis
We observed considerable inter-individual variability in WSS, evident in the standard deviation in the WSS distribution (Table 2). The archetypal WSS waveform was obtained by taking the ensemble average and is presented in Figure 4. The systolic shear stress pulse was sustained for a mean duration of 0.14 ± 0.06 s. The decay constant for the peak systolic shear stress towards the first notch of the pulse was 9.9 ± 6 s−1. WSS at different phases of the cardiac cycle were significantly different (p<0.001).
Figure 4.

Ensemble average common carotid artery wall shear stress.
The ensemble average wall shear stress (WSS) waveform derived from 27 apparently healthy individuals reveals the distribution of WSS across the cardiac cycle. Characteristic features on the waveform include instantaneous WSS measurements at five different time points in one complete cardiac cycle (Table 2), the decay rate for the systolic peak, the time duration of the systolic shear pulse, and the spatial and phase averaged WSS (note that spatial averaging acts as a low pass filter that reduces the WSS magnitudes for both instantaneous and cycle averaged measurements).
Discussion
In this study, we measured carotid arterial WSS using echo PIV and compared it with the single value WSS estimated from the commonly used ultrasound Doppler velocimetry method. The key findings were that: 1) compared with echo PIV, time-averaged WSS was lower using the UDV method; 2) the degree of under- or over- estimation of WSS by UDV varied across the cardiac cycle because of temporal variation in WSS that was not accounted for by the UDV method; 3) echo PIV revealed considerable spatio-temporal variation in the flow velocity profile that is contrary to the assumptions that flow is steady and that the velocity profile is parabolic throughout the cardiac cycle.
Hemodynamic WSS is currently measured because of its importance to vascular endothelial cell shape, size, orientation, function and permeability (Chatzizisis et al., 2007). Alterations in WSS influence endothelial cell signaling, protein expression and synthesis of vasoactive molecules (Chatzizisis et al., 2007). Wall shear stress plays a prominent role in vessel remodeling and in the process of atherogenesis and atheroma progression. Endothelial cells discern different hemodynamic WSS stimuli at the cellular level (Chatzizisis et al., 2007) and independent mechano-chemical transduction pathways are activated in the endothelial cells depending on the type of shear stress exerted (Frangos et al., 1996; Bao et al., 1999). For example, turbulent blood flow generates low and oscillatory WSS that causes endothelial cells to express a pro-atherogenic phenotype (Chatzizisis et al., 2007). In adult humans, atheroma tends to occur at bends, branches and bifurcations in the arterial tree where WSS can be low, oscillatory, disturbed, and sometimes turbulent (Chatzizisis et al., 2007). For these reasons, the measurement of WSS has become important in understanding vascular biology and circulatory pathology. The UDV method is convenient and has become a popular estimate of WSS. However, our data suggest that UDV does not accurately estimate mean WSS and illustrates that it misses much of the important information about WSS that may have relevance to understanding its role in vascular physiology.
Echo PIV allowed analysis of WSS at five discrete time points, revealing that there was large temporal variation in the WSS distribution across the cardiac cycle and that WSS varied significantly between these time points. The UDV method does not estimate temporal variations in WSS and comparison of the mean WSS revealed significant discrepancies at four of the five time points. The largest discrepancy was in peak systolic WSS; the UDV method underestimated this by 74 to 142%. Mynard et al. (2013) also found that UDV underestimated peak-systolic WSS, irrespective of profile-skewing, using either Poiseuille’s or Womersley’s profiles. They calculated an underestimation of 30 to 50% using computational fluid dynamics simulations. The discrepancy with our data may result from their use of spatially averaged, image-based simulations of velocity profiles extracted from the common carotid artery, rather than local velocity profiles measured in-vivo, as reported here. We also found that the end-diastolic WSS was overestimated by UDV and that there was considerable variation in the discrepancy between echo PIV and UDV. This resulted from wide-ranging, individual-dependent variability in WSS at end diastole detected by echo PIV. The significance of variability in WSS at specific phases of the cardiac cycle is uncertain, but given the sensitivity of endothelial cells to variation in WSS, this may reveal important insight into endothelial physiology and the focal susceptibility to vascular disease.
The proximity of the measured shear stress to the vessel wall depends on the spatial resolution of the PIV system. The spatial resolution of in vivo echo PIV is about 0.5 mm (Zhang et al., 2011). Based on the extrapolation of shear stress data as a function of vessel radius, shear stress determined at 0.25 mm to 0.3 mm from the vessel wall leads to an underestimation of WSS by about 10% (Reneman & Hoeks, 2008). This is comparable to the measurement uncertainty of our echo PIV system (15–19%, (Gurung et al., 2017)) but smaller than the UDV technique (25–50%) and the computational fluid dynamics simulations (30–50% (Mynard et al., 2013)). Likewise, Walker et al. (2014) reported good agreement between echo PIV measured centerline velocities and digital PIV, but larger discrepancies were found in near-wall velocity measurements attributable to inferior spatial resolution of echo PIV compared to digital PIV (Walker et al., 2014). Contrast-specific non-linear imaging schemes such as pulse inversion imaging substantially enhance blood-tissue boundaries while preserving both contrast and resolution, potentially improving the accuracy of shear stress calculations closer to the wall (Simpson et al., 1999; Jensen, 2007; Leow et al., 2015). Walker et al. (2009) also reported large differences between echo PIV and pulsed wave Doppler measurements of steady flow velocities in a latex tube designed to simulate the brachial artery. The discrepancy could result from several factors, including sub-optimal PIV parameters, ultrasound beam thickness, off-centerline measurements, and the angle of interrogation for pulsed wave Doppler measurements (Kagiyama et al., 1999; Kim et al., 2004a; Kim et al., 2004b; Zheng et al., 2006; Liu et al., 2008; Walker et al., 2009; Walker et al., 2014; Mynard et al., 2013, Poelma, 2017). Thus, the measurement accuracy of echo PIV depends on establishing optimal parameter settings specific to the experiment of interest.
In this study, we quantified the flow velocity patterns using a shape metric (s-index) and found that the shape of the local velocity profile varied both spatially across the vessel lumen and temporally within the cardiac cycle. This spatial and temporal variation in the velocity distribution translated into variation in WSS distribution that was not detected using the UDV method. The UDV method is one-dimensional, necessitating flow assumptions to estimate multi-dimensional flow velocity and shear stress near the arterial walls, whereas echo PIV produces actual 2-D velocity vector fields that allow velocity measurement close to the wall. A critical assumption of the UDV method is that blood flow is steady and the shape of the velocity profile is parabolic with its maximum located at the center of the vessel, but echo PIV showed that this was not always the case (Figure 3). Our findings agree with those of Reneman and Hoeks (Reneman & Hoeks, 2008) who used a similar analysis of the profile shape. They reported a substantially flattened velocity profile during systole instead of the fully developed parabolic velocity profile assumed in the Doppler method. The authors also reported a mean WSS of 11 to 14 dyn/cm2 (within the limits of the theoretically predicted value of 15 dyn/cm2 ± 50% (Reneman & Hoeks, 2008) in the human CCA, which is comparable to our finding of 15 ± 5 dyn/cm2 derived from echo PIV. The mean WSS derived from our Doppler method was 10 ± 2 dyn/cm2. Likewise, peak WSS reportedly varied between 25 and 43 dyn/cm2 which is comparable to the peak WSS of 41 ± 12 dyn/cm2 derived from echo PIV. Furthermore, Reneman et al. (2008) highlighted the variability in wall shear stress along the arterial tree, indicating the importance of measuring shear stress locally.
The effect of the pulsatile flow pattern on the shape of the local velocity profile was also quantified using the Womersley number, a mechanical gauge for the degree of bluntness present in the velocity profile. Consistent with previous reports (Ku, 1997; Nichols et al., 2011) the Womersley number ranged from 4 to 7, indicating that the velocity profiles were blunt during most of the cardiac cycle. As noted by Mynard et al. (Mynard & Steinman, 2013) and also shown in this study, the UDV technique cannot detect WSS variations caused by profile blunting. Although some studies employing the UDV method now use a Womersley’s profile to estimate WSS, the underlying assumption remains that flow velocity exhibits an axis-symmetric and fully-developed profile (Ponzini et al., 2010; Mynard et al., 2013). Furthermore, this flow assumption neglects any variations in the arterial diameter during the cardiac cycle which results in compounded error during WSS estimation, particularly during peak-systole. Our finding is in agreement with that of Tortoli et al (2003) who showed that velocity distribution during the mid-late systolic phase was markedly asymmetric (“M-shape”) due to the presence of secondary flows during deceleration (Tortoli et al., 2003). As our data show, complex velocity patterns resulting from disturbed flow patterns during the deceleration of systolic flow can result in a WSS distribution that is different from the values predicted by the time-averaged mean WSS (Fung, 1984; Reneman et al., 2006; Markl et al., 2013).
Instantaneous WSS measurement using echo PIV allowed us to construct an ensemble averaged WSS phenotype with detailed time-varying markers. The WSS waveform revealed a highly transient peak systolic WSS decaying at a rate of 9.9 ± 6 s−1 with systolic pulse duration of 0.14 ± 0.06 s. We found that the decelerating systolic minimum (17 dyn/cm2) and the mid-diastolic (12 dyn/cm2) WSS values approximated each other (and the time-averaged value of 14 dyn/cm2), showing that the temporal gradient in WSS is followed by a sustained steady shear stress. White et al. (White et al., 2001) showed that the temporal gradient in shear stress affected endothelial cell proliferation differently based on the presence or absence of steady shear stress, and that the sustained steady WSS suppressed the proliferative stimulus of the gradient. Because endothelial cells are sensitive to the spatial and temporal flow patterns experienced at the arterial walls, this could be an important determinant of endothelial and vascular health. Further elaboration of WSS characteristics, their consequences and how they change with age, health and disease is required to fully exploit the utility of WSS information. To this end, we are currently investigating WSS in patients with a recent history of transient ischemic attack and interrogating arterial regions where flow disturbance may occur.
Our study is limited to a two-component, two-dimensional (2C-2D) velocity vector field for WSS estimation. Three-component, three-dimensional velocity field measurement is optimal to visualize and quantify complex flow dynamics, including tracking of highly transient flow features in both space and time. Furthermore, the accuracy of PIV measurement is affected by the particle displacement in the direction perpendicular to the imaging plane. This problem may be overcome by 3D echo PIV techniques (also known as ultrasound imaging velocimetry, UIV), as described by Poelma et al. (2009). This in vitro study demonstrated that the third out-of-plane velocity components could be reconstructed from slice-by-slice scans from a linear array transducer by using the correlation peak heights of the acquired 2C-2D velocity vector fields. Estimation of 3D velocity vectors in vivo has also been performed using advanced beamforming techniques such as the 3D transverse oscillation method that uses a 2D transducer and special autocorrelation scheme to estimate 3D velocity vectors in two orthogonal planes (Pihl et al., 2013). Another limitation of echo PIV is the maximum resolvable flow velocity, which is dependent upon maximum imaging frame rate. Fraser et al. (2017) recently validated the interleaved technique (Poelma & Fraser, 2013) for pulsatile arterial flow measurements (Fraser et al., 2017) to overcome frame rate limitations associated with conventional line-by-line beam sweeping. The interleaved technique increases the maximum resolvable velocity by reducing the effective inter-frame separation time because two image frames are acquired concurrently; a maximum velocity of 180 cm/s has been reported (Fraser et al., 2017). Leow et al. (2015) successfully applied plane wave imaging for UIV that increased the frame rate to 2000 frames per second (fps), substantially faster than 680 fps used in our study. Although our current echo PIV system is able to resolve normal arterial flow velocities (50–80 cm/s in the CCA with a luminal diameter of 6–7.5 cm (Schaeberle, 2011)), abnormally high velocities present problems (150 – 180 cm/s in the CCA with 50% stenosis and as high as 202 cm/s with 75% stenosis). This limitation may be overcome by the interleaved and the high frame rate UIV techniques that allow higher flow velocities to be resolved in both space and time (Poelma & Fraser, 2013; Leow et al., 2015; Fraser et al., 2017). Our study is also limited by sample size. A larger clinical study is warranted to further investigate the significance of the WSS patterns revealed in this report. A study design involving direct correlative comparison between the WSS markers and the serological biomarkers indicative of endothelial dysfunction could also extend our understanding of the WSS role in the disease process of atherosclerosis. Nonetheless, with this study we have identified new features of in vivo carotid wall shear stress distribution in a healthy population and provided a basis for such a study by identifying detailed markers of WSS that may serve as important biomechanical stimuli for vascular health.
In summary, detailed and accurate markers of physiological and pathophysiological WSS are needed to fully understand the role of WSS in vascular biology and vessel disease. Our data show that spatial and temporal flow patterns are complex, dynamic and do not fit well with conventional assumptions about blood flow in arteries. Importantly, our data suggest that the use of ultrasound Doppler and extrapolation from centerline peak velocity provides limited and largely inaccurate information about WSS. Echo PIV offers a potentially useful tool to accurately measure detailed WSS in humans in vivo, an important yet poorly understood hemodynamic stimulus known to regulate endothelial cell physiology and pathophysiology.
Acknowledgments
Support from the research nurses is gratefully acknowledged. The views expressed in this publication are those of the authors and not necessarily those of the UK National Health Service, the NIHR, or the Department of Health. This work was made possible by grants from the National Institute of Health (NIH T32 HL-727238, K24-HL081506 RO1-HL114753). This research was financially supported by NIHR Exeter Clinical Research Facility. Illumasonix LLC provided partial support of this work as well through a sponsored research agreement with the University of Colorado.
Footnotes
Competing interests
Dr. Shandas is Founder and Director of Illumasonix LLC, which has held a license to commercialize echo PIV technology. Illumasonix LLC provided a research grant to the University of Colorado to fund part of this work.
Publisher's Disclaimer: This is a PDF file of an unedited manuscript that has been accepted for publication. As a service to our customers we are providing this early version of the manuscript. The manuscript will undergo copyediting, typesetting, and review of the resulting proof before it is published in its final citable form. Please note that during the production process errors may be discovered which could affect the content, and all legal disclaimers that apply to the journal pertain.
References
- Bao X, Lu C, Frangos JA. Temporal Gradient in Shear But Not Steady Shear Stress Induces PDGF-A and MCP-1 Expression in Endothelial Cells: Role of NO, NF B, and egr-1. Arterioscler Thromb Vasc Biol. 1999;19:996–1003. doi: 10.1161/01.atv.19.4.996. [DOI] [PubMed] [Google Scholar]
- Barakat A, Lieu D. Differential responsiveness of vascular endothelial cells to different types of fluid mechanical shear stress. Cell Biochem Biophys. 2003;38:323–343. doi: 10.1385/cbb:38:3:323. [DOI] [PubMed] [Google Scholar]
- Bushberg JT, Seibert JA, Leidholdt EM, Boone JM. The Essential Physics of Medical Imaging. Lippincott Williams & Wilkins; 2002. [Google Scholar]
- Caro CG. Discovery of the role of wall shear in atherosclerosis. Arterioscler Thromb Vasc Biol. 2009;29:158–161. doi: 10.1161/ATVBAHA.108.166736. [DOI] [PubMed] [Google Scholar]
- Chatzizisis YS, Coskun AU, Jonas M, Edelman ER, Feldman CL, Stone PH. Role of endothelial shear stress in the natural history of coronary atherosclerosis and vascular remodeling: molecular, cellular, and vascular behavior. J Am Coll Cardiol. 2007;49:2379–2393. doi: 10.1016/j.jacc.2007.02.059. [DOI] [PubMed] [Google Scholar]
- Ford MD, Xie YJ, Wasserman BA, Steinman DA. Is flow in the common carotid artery fully developed? Physiol Meas. 2008;29:1335–1349. doi: 10.1088/0967-3334/29/11/008. [DOI] [PubMed] [Google Scholar]
- Frangos JA, Huang TY, Clark CB. Steady Shear and Step Changes in Shear Stimulate Endothelium via Independent Mechanisms — Superposition of Transient and Sustained Nitric Oxide Production. Biochem Biophys Res Commun. 1996;224:660–665. doi: 10.1006/bbrc.1996.1081. [DOI] [PubMed] [Google Scholar]
- Fraser KH, Poelma C, Zhou B, Bazigou E, Tang M-X, Weinberg PD. Ultrasound imaging velocimetry with interleaved images for improved pulsatile arterial flow measurements: a new correction method, experimental and in vivo validation. J R Soc Interface. 2017;14:20160761. doi: 10.1098/rsif.2016.0761. [DOI] [PMC free article] [PubMed] [Google Scholar]
- Fung YC. Biodynamics Circulation. Springer-Verlag; New York, Berlin, Heidelberg, Tokyo: 1984. [Google Scholar]
- Gimbrone MA. Endothelial dysfunction, hemodynamic forces, and atherosclerosis. Thromb Haemost. 1999;82:722–726. [PubMed] [Google Scholar]
- Gurung A, Gates PE, Mazzaro L, Fulford J, Zhang F, Barker AJ, Hertzberg J, Aizawa K, Strain WD, Elyas S, Shore AC, Shandas R. Echo Particle Image Velocimetry for Estimation of Carotid Artery Wall Shear Stress: Repeatability, Reproducibility and Comparison with Phase-Contrast Magnetic Resonance Imaging. Ultrasound Med Biol. 2017;43:1618–1627. doi: 10.1016/j.ultrasmedbio.2017.03.020. [DOI] [PubMed] [Google Scholar]
- Heffernan KS, Lefferts WK, Augustine JA. Hemodynamic correlates of late systolic flow velocity augmentation in the carotid artery. Int J Hypertens. 2013;2013:1–7. doi: 10.1155/2013/920605. [DOI] [PMC free article] [PubMed] [Google Scholar]
- Jensen JA. Medical ultrasound imaging. Prog Biophys Mol Biol. 2007;93:153–165. doi: 10.1016/j.pbiomolbio.2006.07.025. [DOI] [PubMed] [Google Scholar]
- Kagiyama M, Ogasawara Y, Tadaoka S, Kajiya F. Measurement Accuracy of the Flow Velocity in Pulsed Ultrasound Doppler Velocimeter. Ultrasound Med Bio. 1999;25:1265–1274. doi: 10.1016/s0301-5629(99)00082-4. [DOI] [PubMed] [Google Scholar]
- Kim HB, Hertzberg JR, Shandas R. Development and validation of echo PIV. Exp Fluids. 2004a;36:455–462. [Google Scholar]
- Kim HB, Hertzberg JR, Lanning C, Shandas R. Noninvasive Measurement of Steady and Pulsating Velocity Profiles and Shear Rates in Arteries Using Echo PIV: In Vitro Validation Studies. Ann Biomed Eng. 2004b;32:1067–76. doi: 10.1114/b:abme.0000036643.45452.6d. [DOI] [PubMed] [Google Scholar]
- Ku DN. Blood Flow in Arteries. Annu Rev Fluid Mech. 1997;29:399–434. [Google Scholar]
- Ku DN, Giddens DP, Zarins CK, Glagov S. Pulsatile flow and atherosclerosis in the human carotid bifurcation. Positive correlation between plaque location and low oscillating shear stress. Arteriosclerosis. 1985;5:293–302. doi: 10.1161/01.atv.5.3.293. [DOI] [PubMed] [Google Scholar]
- Leow CH, Bazigou E, Eckersley RJ, Yu AC, Weinberg PD, Tang MX. Flow Velocity Mapping Using Contrast Enhanced High-Frame-Rate Plane Wave Ultrasound and Image Tracking: Methods and Initial in Vitro and in Vivo Evaluation. Ultrasound Med Biol. 2015;41:2913–2925. doi: 10.1016/j.ultrasmedbio.2015.06.012. [DOI] [PubMed] [Google Scholar]
- Li M, Scott DE, Shandas R, Stenmark KR, Tan W. High pulsatility flow induces adhesion molecule and cytokine mRNA expression in distal pulmonary artery endothelial cells. Ann Biomed Eng. 2009;37:1082–1092. doi: 10.1007/s10439-009-9684-3. [DOI] [PMC free article] [PubMed] [Google Scholar]
- Liu L, Zheng H, Williams L, Zhang F, Wang R, Hertzberg J, Shandas R. Development of a custom-designed echo particle image velocimetry system for multi-component hemodynamic measurements: system characterization and initial experimental results. Phys Med Biol. 2008;53:1397–1412. doi: 10.1088/0031-9155/53/5/015. [DOI] [PubMed] [Google Scholar]
- Markl M, Brendecke SM, Simon J, Barker AJ, Weiller C, Harloff A. Co-registration of the distribution of wall shear stress and 140 complex plaques of the aorta. Magn Reson Imaging. 2013;31:1156–1162. doi: 10.1016/j.mri.2013.05.001. [DOI] [PubMed] [Google Scholar]
- Markl M, Wallis W, Harloff A. Reproducibility of flow and wall shear stress analysis using flow-sensitive four-dimensional MRI. J Magn Reson Imaging. 2011;33:988–994. doi: 10.1002/jmri.22519. [DOI] [PubMed] [Google Scholar]
- Mynard JP, Steinman DA. Effect of velocity profile skewing on blood velocity and volume flow waveforms derived from maximum Doppler spectral velocity. Ultrasound Med Biol. 2013;39:870–881. doi: 10.1016/j.ultrasmedbio.2012.11.006. [DOI] [PubMed] [Google Scholar]
- Mynard JP, Wasserman BA, Steinman DA. Errors in the estimation of wall shear stress by maximum Doppler velocity. Atherosclerosis. 2013;227:259–266. doi: 10.1016/j.atherosclerosis.2013.01.026. [DOI] [PMC free article] [PubMed] [Google Scholar]
- Nagel T, Resnick N, Dewey CF, Gimbrone Ma. Vascular Endothelial Cells Respond to Spatial Gradients in Fluid Shear Stress by Enhanced Activation of Transcription Factors. Arterioscler Thromb Vasc Biol. 1999;19:1825–1834. doi: 10.1161/01.atv.19.8.1825. [DOI] [PubMed] [Google Scholar]
- Nichols WW, O’Rourke MF, Vlachopoulos C. McDonald’s Blood Flow in Arteries. THEORETICAL, EXPERIMENTAL AND CLINICAL PRINCIPLES. 6. Hodder Arnold; 2011. [Google Scholar]
- Peiffer V, Bharath AA, Sherwin SJ, Weinberg PD. A novel method for quantifying spatial correlations between patterns of atherosclerosis and hemodynamic factors. J Biomech Eng. 2013;135:021023. doi: 10.1115/1.4023381. [DOI] [PubMed] [Google Scholar]
- Pihl MJ, Stuart MB, Tomov BG, Hansen PM, Bachmann M, Jensen JA. In Vivo Three-Dimensional Velocity Vector Imaging and Volumetric Flow Rate Measurements In Vivo Three-Dimensional Velocity Vector Imaging and Volumetric Flow Rate Measurements. Proc IEEE Int Ultrason Symp. 2013:72–75. [Google Scholar]
- Poelma C, Fraser KH. Enhancing the dynamic range of ultrasound imaging velocimetry using interleaved imaging. Meas Sci Technol. 2013;24:115701. [Google Scholar]
- Poelma C. Ultrasound Imaging Velocimetry: a review. Exp Fluids. 2017;58:1–28. [Google Scholar]
- Ponzini R, Vergara C, Rizzo G, Veneziani A, Roghi A, Vanzulli A, Parodi O, Redaelli A. Womersley Number-Based Estimates of Blood Flow Rate in Doppler Analysis: In Vivo Validation by means of phase-contrast MRI. IEEE Trans Biomed Eng. 2010;57:1807–1815. doi: 10.1109/TBME.2010.2046484. [DOI] [PubMed] [Google Scholar]
- Reneman RS, Arts T, Hoeks APG. Wall shear stress--an important determinant of endothelial cell function and structure--in the arterial system in vivo. Discrepancies with theory. J Vasc Res. 2006;43:251–269. doi: 10.1159/000091648. [DOI] [PubMed] [Google Scholar]
- Reneman RS, Hoeks APG. Wall shear stress as measured in vivo: consequences for the design of the arterial system. Med Biol Eng Comput. 2008;46:499–507. doi: 10.1007/s11517-008-0330-2. [DOI] [PMC free article] [PubMed] [Google Scholar]
- Salsac AV, Sparks SR, Chomaz JM, Lasheras JC. Evolution of the wall shear stresses during the progressive enlargement of symmetric abdominal aortic aneurysms. 2006;560:19–51. [Google Scholar]
- Schaeberle W. Ultrasonography in Vascular Diagnosis A Therapy-Oriented Textbook and Atlas. 2. Springer; Berlin, Heidelberg: 2011. [Google Scholar]
- Simpson DH, Chin CT, Burns PN. Pulse Inversion Doppler: A new Method for Deteting Nonlinear Echos from Microbubble contrast agents. IEEE Trans UFFC. 1999;46:372–382. doi: 10.1109/58.753026. [DOI] [PubMed] [Google Scholar]
- Tortoli P, Michelassi V, Bambi G, Guidi F, Righi D. Interaction between secondary velocities, flow pulsation and vessel morphology in the common carotid artery. Ultrasound Med Biol. 2003;29:407–415. doi: 10.1016/s0301-5629(02)00705-6. [DOI] [PubMed] [Google Scholar]
- Walker AM, Scott J, Rival DE, Johnston CR. In vitro post-stenotic flow quantification and validation using echo particle image velocimetry (Echo PIV) Exp Fluids. 2014;55:1821. [Google Scholar]
- White CR, Haidekker M, Bao X, Frangos JA. Temporal Gradients in Shear, but Not Spatial Gradients, Stimulate Endothelial Cell Proliferation. Circulation. 2001;103:2508–2513. doi: 10.1161/01.cir.103.20.2508. [DOI] [PubMed] [Google Scholar]
- Wu SP, Ringgaard S, Oyre S, Hansen MS, Rasmus S, Pedersen EM. Wall shear rates differ between the normal carotid, femoral, and brachial arteries: an in vivo MRI study. J Magn Reson Imaging. 2004;19:188–193. doi: 10.1002/jmri.10441. [DOI] [PubMed] [Google Scholar]
- Zhang F, Lanning C, Mazzaro L, Barker AJ, Gates PE, Strain WD, Fulford J, Gosling OE, Shore AC, Bellenger NG, Rech B, Chen J, Chen J, Shandas R. In vitro and preliminary in vivo validation of echo particle image velocimetry in carotid vascular imaging. Ultrasound Med Biol. 2011a;37:450–464. doi: 10.1016/j.ultrasmedbio.2010.11.017. [DOI] [PMC free article] [PubMed] [Google Scholar]
- Zhang F, Lanning C, Mazzaro L, Barker AJ, Gates PE, Strain WD, Fulford J, Gosling OE, Shore AC, Bellenger NG, Rech B, Chen J, Chen J, Shandas R. In vitro and preliminary in vivo validation of echo particle image velocimetry in carotid vascular imaging. Ultrasound Med Biol. 2011b;37:450–464. doi: 10.1016/j.ultrasmedbio.2010.11.017. [DOI] [PMC free article] [PubMed] [Google Scholar]
- Zhang F, Murta LO, Chen JS, Barker AJ, Mazzaro L, Lanning C, Shandas R. Evaluation of segmentation algorithms for vessel wall detection in echo particle image velocimetry. Proc IEEE Int Ultrason Symp. 2009:2476–2479. [Google Scholar]
- Zheng H, Liu L, Williams L, Hertzberg JR, Lanning C, Shandas R. Real time multicomponent echo particle image velocimetry technique for opaque flow imaging. Appl Phys Lett. 2006;88:261915. [Google Scholar]