Abstract
Objectives
To investigate the function of AceR, a putative transcriptional regulator of the chlorhexidine efflux pump gene aceI in Acinetobacter baumannii.
Methods
Chlorhexidine susceptibility and chlorhexidine induction of aceI gene expression were determined by MIC and quantitative real-time PCR, respectively, in A. baumannii WT and ΔaceR mutant strains. Recombinant AceR was prepared as both a full-length protein and as a truncated protein, AceR (86–299), i.e. AceRt, which has the DNA-binding domain deleted. The binding interaction of the purified AceR protein and its putative operator region was investigated by electrophoretic mobility shift assays and DNase I footprinting assays. The binding of AceRt with its putative ligand chlorhexidine was examined using surface plasmon resonance and tryptophan fluorescence quenching assays.
Results
MIC determination assays indicated that the ΔaceI and ΔaceR mutant strains both showed lower resistance to chlorhexidine than the parental strain. Chlorhexidine-induced expression of aceI was abolished in a ΔaceR background. Electrophoretic mobility shift assays and DNase I footprinting assays demonstrated chlorhexidine-stimulated binding of AceR with two sites upstream of the putative aceI promoter. Surface plasmon resonance and tryptophan fluorescence quenching assays suggested that the purified ligand-binding domain of the AceR protein was able to bind with chlorhexidine with high affinity.
Conclusions
This study provides strong evidence that AceR is an activator of aceI gene expression when challenged with chlorhexidine. This study is the first characterization, to our knowledge, of a regulator controlling expression of a PACE family multidrug efflux pump.
Introduction
Acinetobacter baumannii has emerged as a major hospital-acquired opportunistic human pathogen, responsible for a range of infections including those of the respiratory tract, urinary tract and blood.1 The success of A. baumannii in the hospital setting stems at least partly from its resistance to almost all commonly used antibiotics. Many of the resistance determinants carried by A. baumannii have been acquired horizontally. Indeed, A. baumannii strain AYE carries an 86 kb drug-resistance island, the largest known drug-resistance island to have been identified in a bacterial genome.2 In addition to these acquired drug-resistance factors, A. baumannii carries intrinsic resistance genes in its core genome, including a large number of putative drug efflux pumps. Five families of efflux pumps have been extensively characterized in bacteria:3–5 major facilitator superfamily; resistance nodulation-cell division superfamily; small multidrug resistance family; ATP-binding cassette superfamily; and multidrug and toxic compound extrusion family. Representatives of all these families have been identified in A. baumannii.6 Recently, we have defined a sixth family of multidrug efflux pump, the proteobacterial antimicrobial compound efflux (PACE) family, exemplified by the AceI protein from A. baumannii.7,8 Members of this family confer resistance to biocides including chlorhexidine, benzalkonium, acriflavine and proflavine.
Multidrug efflux pumps are frequently encoded adjacent to a divergently transcribed regulatory protein that controls expression of the pump gene in response to its substrates. For example, expression of the major facilitator superfamily efflux pump gene qacA in Staphylococcus aureus is regulated by a divergently encoded transcriptional regulator, QacR, a member of the TetR family of repressors.9 Another example is the LysR-type transcriptional regulator (LTTR) family protein AdeL, which is encoded opposite to the adeFGH operon, and regulates expression of these genes, which encode a resistance nodulation-cell division efflux system in A. baumannii.10
The aceI gene in A. baumannii, which confers chlorhexidine resistance, is located adjacent to a divergently transcribed regulator gene encoding an LTTR family protein. LTTRs are the largest family of prokaryotic transcriptional regulators.11 LTTRs can function as activators or repressors of single or operonic genes or as global regulators, controlling expression of large numbers of genes across the genome.11 LTTRs regulate gene products involved across diverse processes, including metabolism, cell division, virulence, motility, toxin production, attachment and secretion.11,12
LTTR proteins are organized with an N-terminal DNA-binding domain (DBD) connected via a helical linker to an effector-binding domain (EBD) at the C-terminus. Although LTTRs have well-conserved structures, they tend to display low sequence identity between family members possibly because of evolving distinct effector recognition. The DBD has the greatest sequence conservation, owing to its winged helix–turn–helix (HTH) motif and the linker helix.13,14 The more diverse EBD comprises two α/β subdomains held together by hinge-like β-strands;15,16 generally, effector molecules bind in the cleft between these two subdomains. Binding results in a conformational change that alters the affinity of the LTTR for the promoter region DNA to enable transcriptional regulation.17,18
The present study determines the regulation of the aceI transporter gene and demonstrates a divergently transcribed LysR family regulator, which we have named AceR, to be responsible for transcriptional activation of aceI expression in response to chlorhexidine.
Materials and methods
Bacterial strains, plasmids and media
The bacterial strains and plasmids used in this study are listed in Table 1. Escherichia coli and A. baumannii strains were cultivated in LB or Mueller–Hinton broth, respectively, at 37°C with aeration. When necessary, media were supplemented with the antibiotics ampicillin (100 mg/L) or tetracycline (30 mg/L).
Table 1.
Bacterial strains and plasmids used in this study
| Reference/source | |
|---|---|
| Strain | |
| A. baumannii ATCC 17978a | 33 |
| A. baumannii AB5075-UW | 34 |
| AB5075-ΔaceI (ABUW1673_204: T26) | 34 |
| AB5075-ΔaceR (ABUW1672_127: T26) | 34 |
| E. coli DH5α | |
| Plasmid | |
| pTTQ18RGSH6 | 19,20 |
| pTTQ18RGSH6-aceR (ampR) | this work |
| pTTQ18RGSH6-aceRt (ampR) | this work |
| pWH1266 | 21,22 |
| pWH1266-aceR (TetR) | this work |
GenBank accession no. NC009085.
Both full-length (aceR) and truncated (aceRt; see description in the text below) genes were cloned into the plasmid vector pTTQ18RGSH6 for overexpression in E. coli DH5α, as described previously.6,19,20 The full-length aceR gene was additionally cloned into the plasmid pWH1266 for complementation of the A. baumannii AB5075-UW ΔaceR mutant strain, as previously described.21,22 Primers utilized for cloning are listed in Table S1 (available as Supplementary data at JAC Online). Sanger sequencing was used to verify all cloned genes.
MIC determination assays
MIC determination assays for chlorhexidine resistance were conducted on A. baumannii strains in Mueller–Hinton broth using a conventional 2-fold serial dilution method, as previously described.23 All MIC values were determined in triplicate.
Preparation of recombinant AceR and AceRt
The recombinant proteins AceR and a truncated variant AceRt were overexpressed as C-terminal His-tag fusion proteins in E. coli DH5α. Aliquots (4 mL) from overnight cultures grown at 37°C were added to growth medium (LB broth, 400 mL) and shaken at 37°C until cell density readings achieved OD600 = 0.4. Expression was induced with IPTG (1.6 mM) and the growth temperature lowered to 20°C. After 24 h, cells were centrifuged and pellets resuspended in Buffer A [20 mM Tris-HCl buffer (pH 8.0) with 10% glycerol and 400 mM NaCl]. Following addition of DNase I, cells were lysed using a French press (two passages, 20 000 psi). Unlysed cells and debris were removed by centrifugation (20 000 g, 30 min) and the recovered supernatant filtered by syringe (0.4 μm).
Purification of recombinant products was undertaken by Ni-NTA affinity chromatography. Filtrate (25 mL) was loaded (peristaltic pump) at 4°C onto a pre-packed column (1 mL; GE Healthcare) equilibrated in Buffer A with 5 mM imidazole. Following washing (2 times, 10 mL) with Buffer A with 20–60 mM imidazole, the protein product was eluted in Buffer A with 250 mM imidazole (5 mL). Fractions of eluate containing protein were pooled, dialysed overnight into Buffer B [50 mM HEPES buffer (pH 7.5) with 200 mM NaCl and 10% glycerol] and frozen. The purity of the recombinant product was established by SDS-PAGE and western blots with an anti-RGSH6-HRP antibody conjugate (Qiagen). Pure samples were desalted and concentrated to 400 mg/L prior to conducting binding assays [gel electrophoretic mobility shift assays (EMSAs), DNase I footprinting and protein-substrate binding].
RNA isolation
Mid-log cell cultures (5–10 mL, OD600 = 0.6) of each A. baumannii strain were treated with chlorhexidine (8 μM) for 30 min at 37°C, with shaking. Control cultures contained no chlorhexidine. Cell pellets were recovered (5000 g, 15 min) and lysed in QIAzol reagent (Qiagen). Total RNA was isolated using the RNeasy mini kit (Qiagen) and DNA removed with DNase I (TURBO DNA-freeTM kit; Invitrogen). First-strand cDNA synthesis was facilitated using a reverse transcription kit (QuantiTect®; Qiagen) with 1000 ng of RNA input. All procedures followed the manufacturers’ instructions.
Quantitative real-time PCR
All cDNA aliquots (1000 ng) were used in equal concentration in a quantitative real-time (qRT)–PCR reaction mix containing 5 μL of 2× GoTaq® qPCR Master Mix (Promega) and 300 nM of each primer (Table S1) and the reaction volume was made up to 10 μL with nuclease-free water. The reaction was conducted using a LightCycler 480 instrument (Roche) and the running conditions were 95°C for 2 min, 40× (95°C for 15 s, 55°C for 2 min and 72°C for 20 s) and 72°C for 10 min. All samples were analysed in triplicate and rpoD was used as the internal control. Relative quantification of gene expression was calculated using the 2−ΔΔCT approximation method.24
Gel EMSAs
A DNA fragment containing the aceR-aceI intergenic region (242 bp), including the predicted aceI promoter was prepared by PCR amplification from the chromosome of A. baumannii ATCC 17978 (99% in sequence identity of A. baumannii AB5075-UW) using a pair of primers (Finteg and Rinteg; Table S1). The PCR products were purified using the Wizard SV gel and PCR cleanup kit (Promega). A digoxigenin gel shift kit (second generation; Roche) was used for labelling of the DNA fragments and detection of signals according to the manufacturer’s instructions. Binding reactions were performed by incubating the labelled DNA fragment with 0–2 μM of the purified AceR with chlorhexidine (8 μM) for 30 min (25°C) in 10 μL of binding buffer [10 mM HEPES, pH 7.6, 0.5 mM EDTA, 5 mM (NH4)2SO4, 0.5 mM DTT, 15 mM KCl]. After incubation, 5 μL of gel loading buffer [0.25× TBE buffer, 60% glycerol, 40% bromophenol blue, 0.2% (w/v)] was added and then the reactions were electrophoresed in a 5% native polyacrylamide gel at 100 V for 1.5 h in 0.5× TBE buffer (45 mM Tris-borate, 1 mM EDTA, pH 8.0). The gel was then detected and analysed according to the manufacturer’s instructions. Additional EMSAs were conducted using smaller DNA fragments (32 and 37 bp) and AceR (0–6 μM) with chlorhexidine (8 μM).
DNase I footprinting assay
PCR primers (Table S1) with 5′-labelled 6-FAM (fluorescein amidite) were obtained from Integrated DNA Technologies. Labelled DNA fragments (300 ng) were prepared by PCR amplification from the chromosome of A. baumannii ATCC 17978 using the commercially synthesized primers (F122-fam and R122; R122-fam and F122). Both ends of the PCR product were separately labelled with 5′-labelled 6-FAM (only one 5′-labelled primer was used in each experiment) and used in separate footprinting experiments.
For DNase I footprinting, the labelled DNA fragment was incubated with the purified AceR protein (0, 4 and 8 μM) with chlorhexidine (8 μM) in 50 μL of incubation buffer (50 mM Tris-HCl, pH 7.5, 150 mM NaCl, 3 mM magnesium acetate, 0.1 mM EDTA, 0.1 mM DTT) for 30 min at room temperature. Subsequent DNA digestion was conducted by addition of 0.5 U RQ1 RNase free DNase I (Promega) to the mixture to a final volume of 100 μL. After digestion for 1 min, the digestion reaction was stopped by the addition of 100 μL of stop solution (200 mM NaCl, 20 mM EDTA and 1% SDS) followed by incubation at 65°C for 10 min. The final reaction mixtures were extracted with 200 μL of phenol/chloroform/isoamyl alcohol (25:24:1) and purified by ethanol precipitation. The purified samples were sent to the Australian Genome Research Facility for Genotyping-Fragment Separation, which then were analysed using Geneious 2 software (Biomatters).
Surface plasmon resonance
Interactions between AceRt and chlorhexidine were measured on a Biacore X100 system (GE Science) operating at a flow rate of 30 μL/min. Prior to immobilization, the purified AceRt protein (10 μM in Buffer B, see above) was diluted 1:100 into sodium acetate (10 mM, pH 4.0) and the CM5 chip activated with a mixture of 1-ethyl-3-(3-dimethylaminopropyl) carbodiimide and N-hydroxysuccinimide (1:1) applied for 10 min. All measurements were performed at 25°C in Buffer B. Chlorhexidine solutions over the range 0.3–320 μM were applied for 30 s and disassociated for 120 s. Data were analysed and non-specific binding normalized using Biacore X100 evaluation software. GraphPad Prism 7 software was used for calculating the dissociation constant (Kd) of this interaction.
Tryptophan fluorescence quenching assays
Steady-state spectrophotofluorimetry was conducted on the purified protein using a spectrofluorimeter (PerkinElmer LS 55). The purified AceRt (5 μM in Buffer B) was analysed at room temperature. Tryptophan residues in AceRt were excited at 295 nm and fluorescence emissions were recorded at 330 nm. Microlitre additions of chlorhexidine in Buffer B were added to final concentrations from 0 to 114 μM and accounted for <13% of the final volume. Samples were mixed in a 1 cm × 0.2 cm quartz cell for 1 min after each addition before the fluorescence emission was monitored. All readings were corrected for buffer background emission and sample dilution. The relative fluorescence quenching (ΔI) was calculated as follows: ΔI = (1 − I/I0) × 100/100, where I0 is the intensity of fluorescence in the absence of quencher and I is the intensity of fluorescence upon addition of quencher. The standard deviation was calculated for the individual ΔI values from three independent experiments. Kd for the interaction was determined by non-linear regression using GraphPad Prism 7.
Results and discussion
AceR is required for chlorhexidine induction of aceI
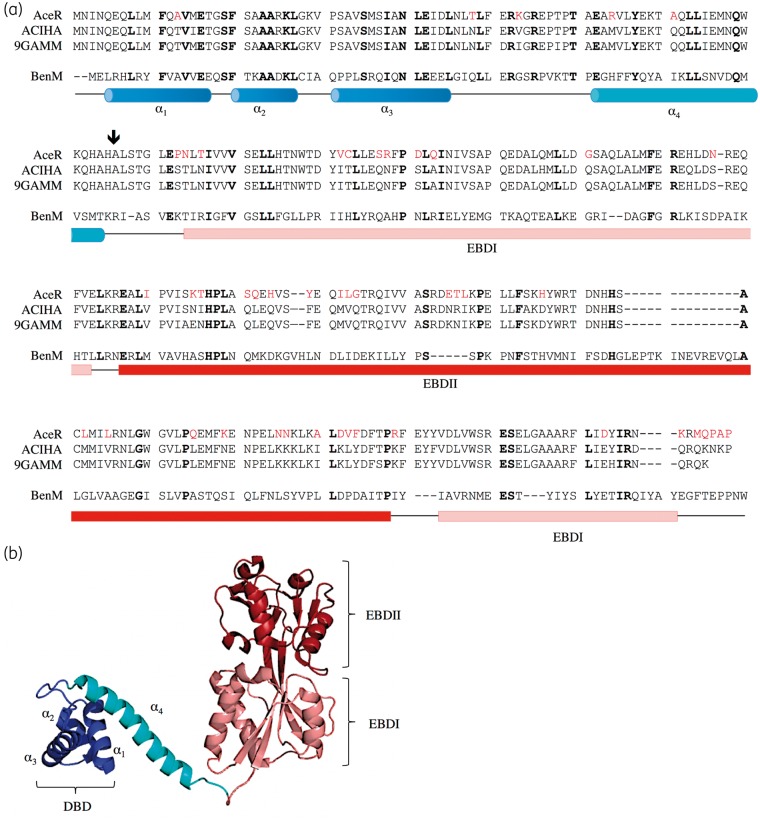
This study focused on a putative LTTR, encoded by a gene we have named aceR (A1S_2064), which is divergently transcribed from the aceI multidrug efflux gene. A multiple sequence alignment of AceR with homologous LTTR proteins (Figure 1) suggested an extended N-terminal segment, thus the start codon for aceR is likely 105 bp upstream from the previously annotated start codon. This is supported by analysis of RNA-Seq transcriptomic data (Q. Liu, K. A. Hassan and I. T. Paulsen, unpublished data), which locates the aceR transcript start ∼15–20 bp upstream of this new proposed start codon (Figure S1).
Figure 1.
Proposed organization of the AceR sequence with respect to defined LTTR family member BenM. (a) Alignment of AceR with Acinetobacter spp. sequence representatives at the 80% identity level; N9F3E8_ACIHA from Acinetobacter haemolyticus CIP 64.3 T (ACIHA) and N8R3C8_9GAMM from Acinetobacter sp. CIP A165 (9GAMM). Residues in AceR differing from the consensus (of three sequences) are coloured red. Alignment includes the sequence of LTTR member BenM (from Acinetobacter sp. ADP1) whose three-dimensional structure is known (27% identity). Locations of the HTH motif (helices α1–α3), the linker helix (α4) and the EBDs (subdomains EBDI and EBDII) are indicated (from crystal structure PDB 3K1N). The start residue for the AceRt construct employed in this study, in which the HTH motif is deleted, is indicated with an arrow. Orthologues identified from a BLASTP search against UniProtKB; sequences aligned with CLUSTAL.35 (b) Ribbon view of the BenM crystal structure,36 coloured so as to distinguish the DBD (HTH motif) (dark blue), linker helix (cyan), EBDI (pink) and EBDII (red).
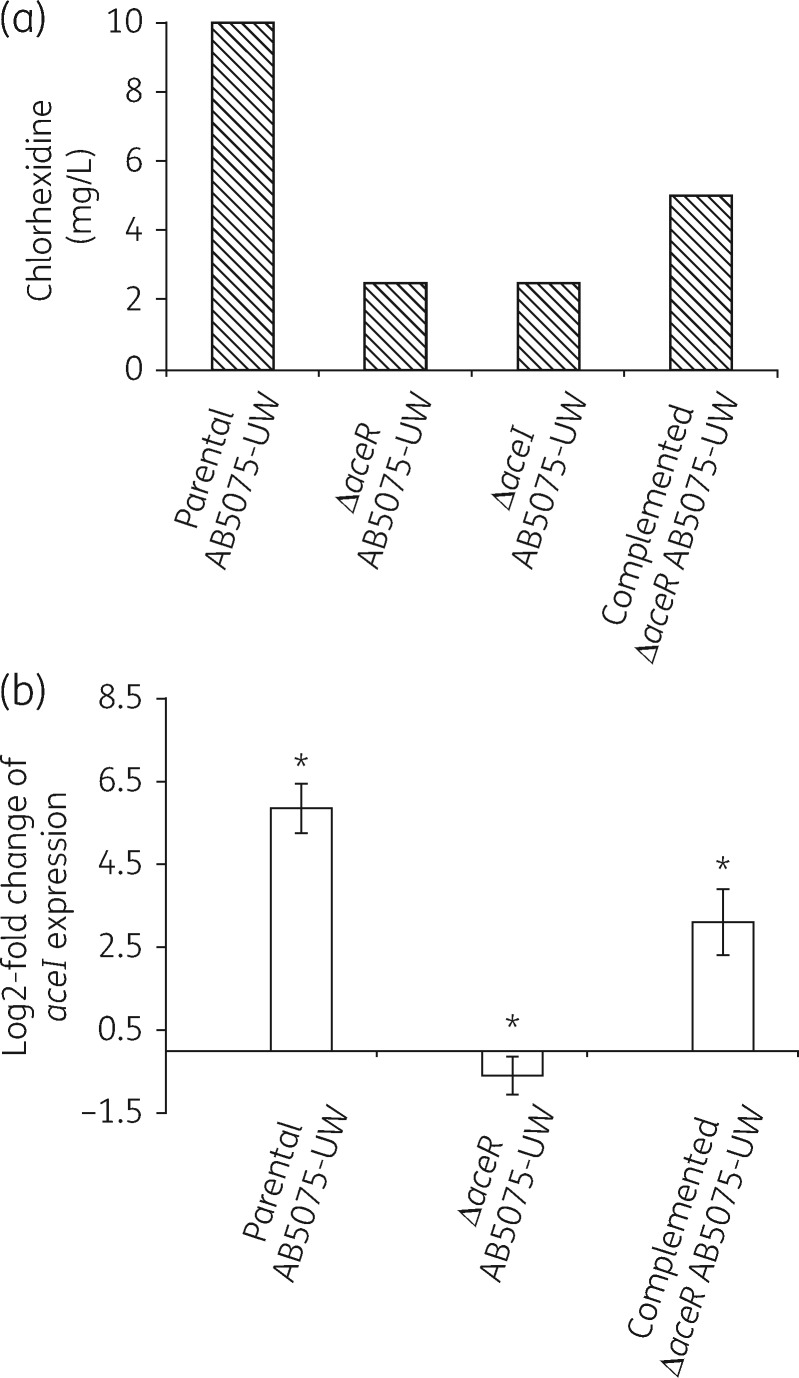
To investigate whether AceR plays a role in controlling the expression of aceI, we first compared chlorhexidine resistance levels in A. baumannii AB5075-UW and isogenic ΔaceI knockout and ΔaceR knockout mutants. Antimicrobial susceptibility assays (Figure 2a) showed both the ΔaceI and ΔaceR mutants to have an identical 4-fold decrease in chlorhexidine resistance relative to the parental strain. Complementation of the ΔaceR-inactivated mutant with the cloned aceR gene partially restored chlorhexidine resistance. These data suggest that AceR might function as an activator of aceI gene expression, since a knockout in a negative regulator would presumably lead to an increased MIC.
Figure 2.
Effect of chlorhexidine on A. baumannii AB5075-UW strains. (a) Chlorhexidine susceptibility of A. baumannii parental AB5075-UW, AB5075-UW ΔaceR and AB5075-UW ΔaceI isogenic mutants and the AB5075-UW ΔaceR mutant complemented with the aceR gene cloned on the plasmid vector pWH1266. MICs were determined using a broth dilution method and the data shown are averaged from three biological replicates. (b) qRT–PCR assays of aceI gene expression following chlorhexidine induction in parental AB5075-UW, the AB5075-UW ΔaceR isogenic mutant and the AB5075-UW ΔaceR mutant complemented with the aceR gene cloned on the plasmid vector pWH1266. Change in expression of aceI gene transcription was measured as fold change normalized to rpoD gene expression and subsequently calculated as log2-fold change relative to the untreated cell culture. Values are averages of three independent qRT–PCR experiments. P values were calculated using the paired Student’s t-test (*P < 0.05).
To investigate the role for AceR as an activator of aceI gene expression, we used qRT–PCR to examine the expression levels of aceI in the WT, ΔaceR mutant and complemented-ΔaceR mutant A. baumannii AB5075-UW strains with and without chlorhexidine induction. We found transcription of aceI in the WT strain to be induced 34-fold by chlorhexidine (Figure 2b). In contrast, aceI expression was not induced by chlorhexidine in the ΔaceR mutant strain. The chlorhexidine induction of aceI gene expression was partially restored in the complemented mutant strain. The most probable explanation that only partial complementation was observed in both the MIC and qRT–PCR data is that expression levels of aceR are likely different in the complementation experiments as the aceR gene was expressed from the pWH1266 plasmid rather than being reintroduced at the original locus in the A. baumannii ΔaceR mutant strain.
Preparation of the EBD of AceR
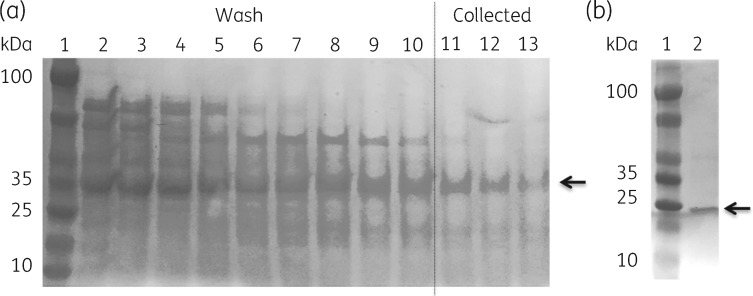
Our observations with A. baumannii WT and mutant strains suggested that AceR could activate expression of aceI in the presence of chlorhexidine. To investigate this at the protein level, recombinant AceR was prepared in both full-length and truncated forms with a C-terminal His6-tag. AceR (86–299) (a 24.5 kDa protein, named here AceRt) was designed to remove the DBD and retain the EBD sequence only (Figure 1). Previous studies of other LTTRs have demonstrated EBDs to be stable domains that retain independent function.11,25 Following purification as His6-tagged fusion products, SDS-PAGE confirmed our preparations of AceR and AceRt as proteins of 35 and 25 kDa, respectively (Figure 3). In line with previous investigations of LTTRs (e.g. BenM and CatM26,27), solutions of full-length AceR showed lower stability than AceRt. Differential scanning fluorimetry showed that the full-length AceR (Tm = 53°C) had a lower melting temperature than that of AceRt (Tm = 60°C) and ∼40% of the full-length AceR protein precipitated after removal of imidazole from the buffer.
Figure 3.
SDS-PAGE for immobilized metal affinity chromatography (IMAC)-purified AceR and AceRt used in this work. (a) Fractions taken during IMAC purification of recombinant AceR (arrow, 35 kDa) produced by E. coli DH5α cells carrying aceR constructs in vector pTTQ18RGSH6. Lanes 2–10, eluates from washes by Buffer A with increasing imidazole gradient (20–60 mM, in 5 mM steps). Lanes 11–13, retained sample eluted with Buffer A and 250 mM imidazole. (b) AceRt sample (arrow, 25 kDa) following imidazole elution of IMAC column imidazole (as before). Gel stained with Coomassie brilliant blue.
AceR binds to the intergenic region between aceI and aceR
LTTRs frequently bind to multiple DNA sites within the intergenic region between their own coding gene and an adjacent divergently transcribed gene they regulate.11 These binding sites are typically inverted repeats (T-N11-A) located near the promoter region of the regulated gene, but can vary in both base pair composition and length.11
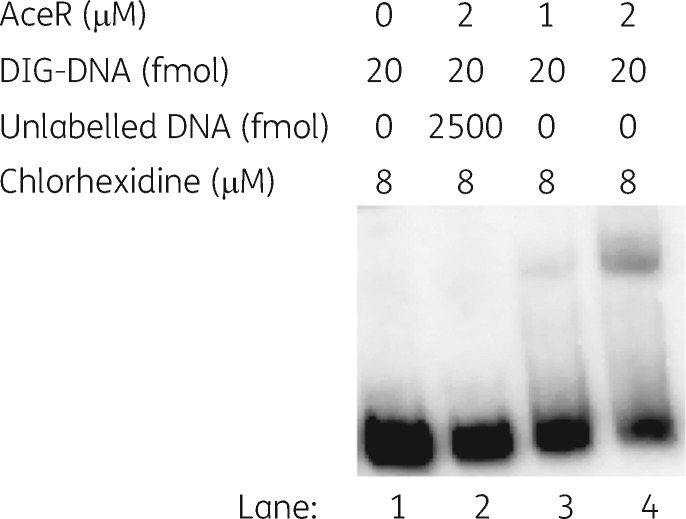
EMSAs were conducted using a 242 bp DNA segment encompassing the entire aceI–aceR intergenic region, plus 69 bp of the aceI gene and 14 bp of the aceR gene (Figure 4 and Figure S2). In the absence of AceR, a single DNA fragment of 242 bp is observed. With increasing addition of AceR, a higher molecular weight species becomes more abundant, which presumably represents an AceR-DNA complex. Specific competition with excess unlabelled probe DNA resulted in loss of the higher molecular weight species. Excess poly[d(A-T)] was used as a non-specific competitor in each reaction to prevent unspecific binding of protein to the DNA fragment. The EMSA data suggested that AceR specifically binds to the aceI and aceR intergenic region in vitro.
Figure 4.
EMSAs showing AceR binding to the aceI–aceR intergenic region. Lanes 1–4, the concentration of AceR protein was 0, 2, 1 and 2 μM respectively; the concentration of DIG-labelled probe and chlorhexidine was constant at 20 fmol and 8 μM, respectively. Additionally, the sample in lane 2 includes 2500 fmol of unlabelled probe that was incubated with the AceR protein. Samples were electrophoresed on a 5% native polyacrylamide gel. DIG, digoxigenin.
DNase I footprinting localizes the AceR binding site
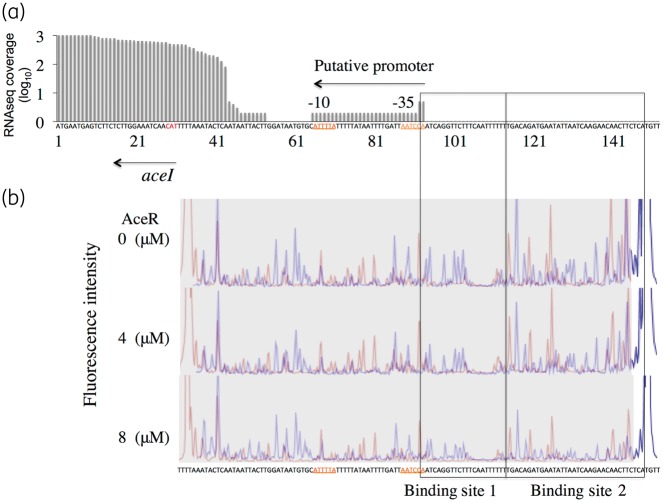
DNase I footprinting was performed to localize further the AceR-binding sequence. Sequence coverage of the aceI and aceR transcripts in our RNA-Seq transcriptomic data (Q. Liu, K. A. Hassan and I. T. Paulsen, unpublished data) shows the likely transcriptional start site of the aceI transcript is 11 bp downstream of a putative aceI promoter. This promoter consists of a −10 box (TAAAAT), 17 bp spacing and then a relatively poor −35 box (TGGATT) (Figure 5a). DNase I footprinting was performed using a 122 bp DNA fragment upstream of the translation start of the aceI gene. Two regions experienced partial protection from DNase I digestion dependent on AceR concentration (Figure 5b). Binding site 2 includes an imperfect palindrome AGAACAACTTCT that resembles a typical LTTR-binding motif,11 whereas binding site 1 includes a weak imperfect palindromic region AATCAGGTTCTTTCAATT that is adjacent to the likely −35 box of the aceI promoter.
Figure 5.
Identification of the AceR-binding site by a DNase I footprinting assay. (a) RNA-Seq transcriptomic data showing the transcription start site for the aceI transcript. X-axis shows the nucleotide sequence of aceI and its putative promoter (−10 and −35 boxes are indicated). Y-axis displays the relative sequence coverage from RNA-Seq data, showing that the aceI transcript starts 11 bp from the −10 box of the promoter. (b) DNase I footprinting with purified AceR. A DNA fragment (122 bp) of the intergenic region between aceI and aceR was PCR amplified and labelled with 5′-labelled 6-FAM. DNase I digestion reactions were prepared and analysed by capillary electrophoresis in an ABI 3730XL sequencer as described in the Materials and methods section. Three electropherograms show the reactions with the following increasing concentrations of AceR: 0, 4 and 8 μM. Electropherograms consist of overlapped blue and red nucleotide peaks, which correspond to experiments performed with DNA labelled on the aceI and aceR ends of the fragment, respectively. Protected regions are associated with decreasing peak intensity as AceR concentration increases.
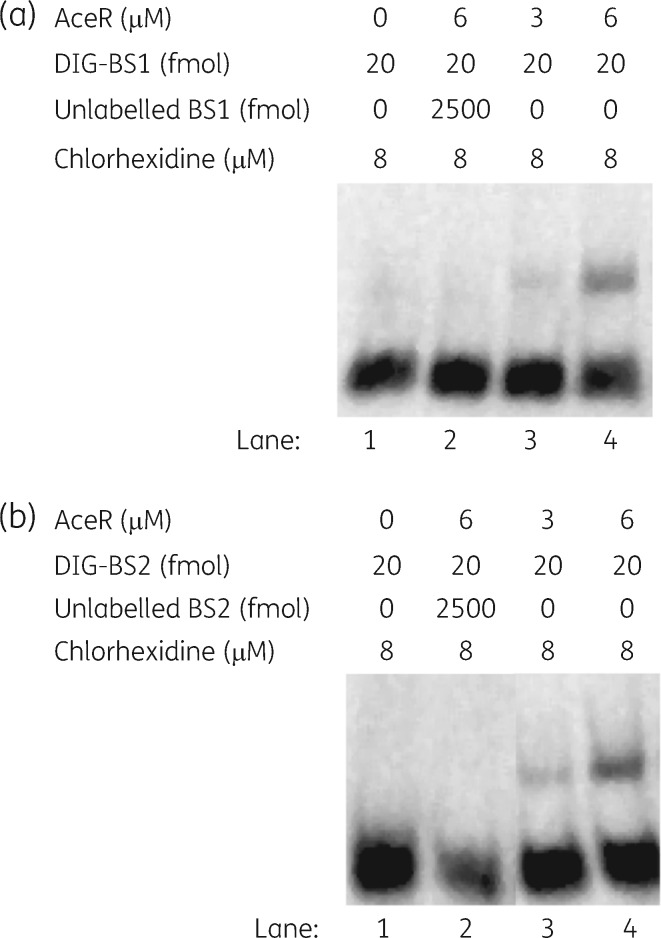
To confirm whether AceR can bind to both sites within the aceI–aceR intergenic region, additional ESMAs were conducted using smaller (32 and 37 bp) DNA fragments centred on binding sites 1 and 2. AceR was inferred to bind the DNA fragments of the two binding sites in a concentration-dependent manner (Figure 6). The gel shift was abolished by competition with an excess of unlabelled specific DNA (i.e. the unlabelled putative binding site DNA). These results confirmed that AceR binds at least two distinct sites upstream of the predicted aceI promoter sequence, a property similar to many characterized LTTRs.11,13 LTTRs are proposed to operate as a dimer of dimers. One dimer may first bind (in apo form) to one regulatory binding site. Subsequently, upon binding of the effector molecule, a second dimer may bind to a distinct but adjacent site to form a tetramer with the bound dimer.28 Binding sites 1 and 2 may represent these regulatory and effector sites.
Figure 6.
EMSAs showing AceR binding to two sites in the aceI–aceR intergenic region. Sequence of the DNA fragments for binding site 1 (a) and binding site 2 (b) are TGATTAATCCAATCAGGTTCTTTCAATTTTTT and GACAGATGAATATTAATCAAGAACAACTTCTCATGTT, respectively. DIG-labelled DNA fragments (binding sites 1 and 2, 20 fmol) as probes were commercially synthesized for the reactions in lanes 1–4 and incubated with an increasing concentration of AceR (0–6 μM), as indicated at the top of each panel. Samples in lane 2 additionally include 2500 fmol of unlabelled probe. BS1, binding site 1; BS2, binding site 2; DIG, digoxigenin.
The chlorhexidine-induced binding of AceR to these sites may help to co-ordinate binding of the RNA polymerase to the aceI promoter. Expression of the aceI gene probably requires activation owing to the relatively poor −35 box consensus sequence. AceR may activate expression through interacting with the RNA polymerase holoenzyme, enhancing its binding to the promoter region.
EBD of AceR binds chlorhexidine
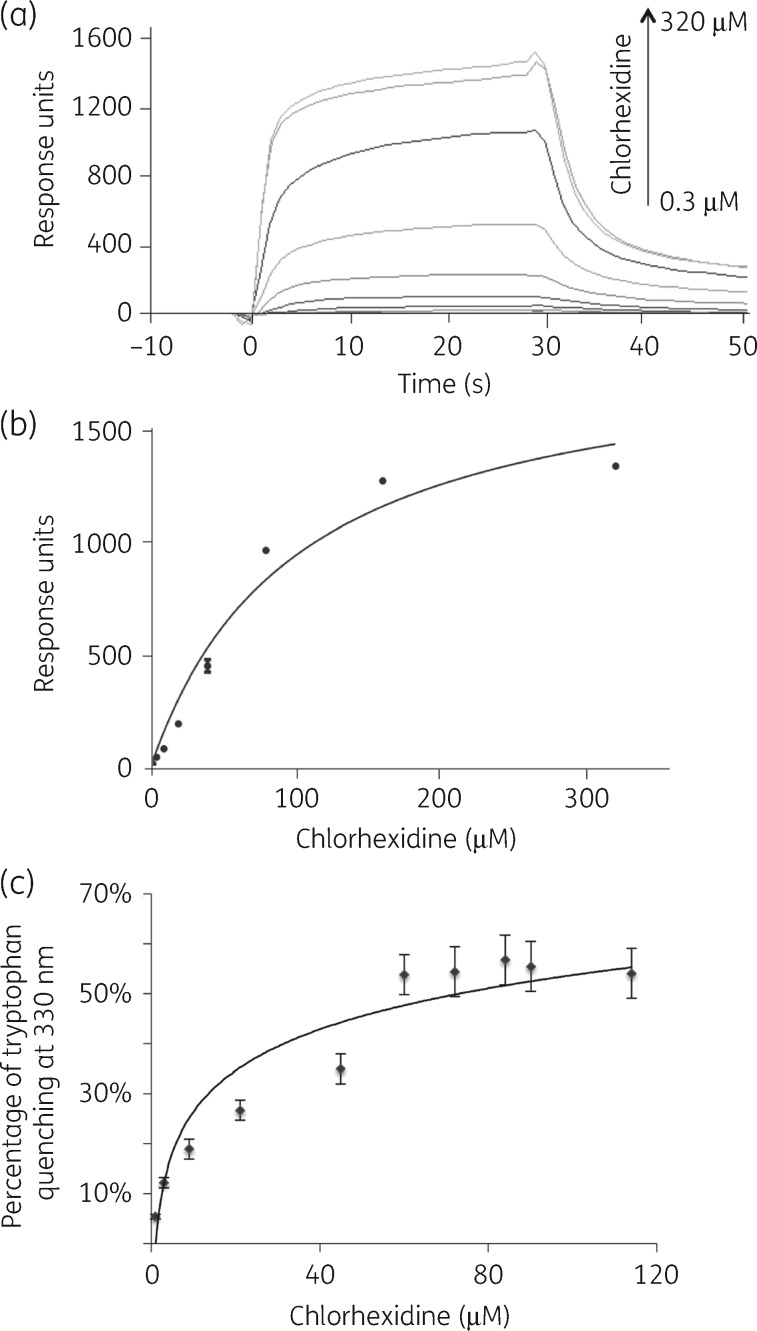
Direct monitoring of binding with chlorhexidine employed surface plasmon resonance (SPR) with the truncated AceRt protein, owing to its higher solubility than AceR. The sensorgrams showed AceRt binding responses to increase with chlorhexidine concentrations until saturation (Figure 7a). The overall Kd was calculated as 62.3 μM (Figure 7b). The binding stoichiometry of AceRt/chlorhexidine based on these results was 1:1.
Figure 7.
Binding affinity between AceRt and chlorhexidine using SPR and fluorescence quenching. (a) Sensorgrams and the saturation curve of the titration of AceRt with chlorhexidine were determined by SPR. A CM5 chip (Biacore) was coated with AceRt with 1400 response units and an increasing concentration of chlorhexidine was injected into the microfluidic channel. (b) Response units were extracted for each chlorhexidine concentration in the sensorgrams to plot an affinity curve against various chlorhexidine concentrations. (c) Tryptophan fluorescence quenching to monitor AceRt/chlorhexidine binding. Fluorescence spectra of AceRt (5 μM) upon addition of chlorhexidine were monitored at 330 nm.
To support the SPR data, a tryptophan fluorescence quenching assay was performed. Fluorescence of four tryptophan residues in the AceRt protein was monitored during chlorhexidine titration (Figure S3). Chlorhexidine quenches AceRt tryptophan fluorescence in a saturable manner with a Kd of 30.5 μM (Figure 7c). This dissociation parameter is in line with the Kd derived from our SPR assays (above). These Kd values are similar, but slightly lower than that observed for the AceI transporter (1.6∼5.8 μM).8 Other LTTRs have affinity in the μM range for their specific inducing ligand.17,29–31 Examples include PcpR from Sphingobium chorophenolicum that binds pentachlorophenol with a Kd of 70 μM29 and CbbR from Xanthobacter flavus that binds NADPH with a Kd of 75 μM.30
Conclusions
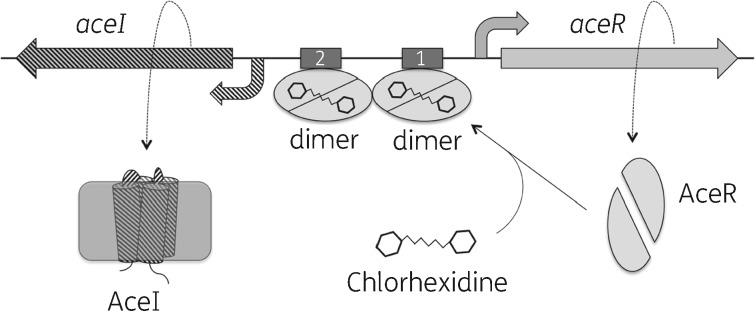
The AceI efflux pump is the first characterized prototype of the PACE family of multidrug efflux pumps.7,8 In this paper, we provide several lines of evidence that the novel LTTR protein AceR is an activator of aceI gene expression. We were also able to demonstrate direct interactions between the C-terminal domain of AceR with chlorhexidine, a known substrate of the AceI transporter.7 Based on these data, we propose a molecular model for the regulation of the aceI gene (Figure 8). In this model, AceR binds to chlorhexidine inducing a conformational change, which results in two AceR dimers binding to at least two DNA sites localized upstream of the −35 box of the aceI promoter. This consequently activates expression of the aceI gene through enhancing binding of the RNA polymerase holoenzyme to the aceI promoter.
Figure 8.
Proposed model of AceR transcriptional regulation of aceI gene expression. Following binding to chlorhexidine, two AceR dimers are proposed to bind to regulatory sites within the intergenic region between the aceI and aceR genes. AceR binding close to the aceI promoter results in activation of aceI transcription, presumably by strengthening the interaction between the RNA polymerase holoenzyme and the aceI promoter.
While this is the first characterization of a regulator of a PACE family efflux pump, various other bacterial efflux pump transporters have been shown to be regulated via a divergently encoded regulator that can recognize the substrate of the cognate transporter.10,32 We believe that AceR will provide a good model system for studying the regulation of PACE family efflux pumps, which are frequently encoded adjacent to an LTTR gene. Investigating the ligands of the putative LTTR regulators of these PACE family transporters may provide valuable insight into the real physiological substrates of their efflux pumps.
Supplementary Material
Acknowledgments
Funding
Q. L. was supported by a Macquarie University International Research Excellence Scholarship, H. E. A. was supported by an Australia Research Training Programme Scholarship and I. T. P. was supported by an Australian Research Council Laureate Fellowship (FL140100021). Additional support for the work was provided by grants 1060895 and 1120298 from the National Health and Medical Research Council of Australia.
Transparency declarations
None to declare.
Supplementary data
Table S1 and Figures S1–S3 are available as Supplementary data at JAC Online.
References
- 1. Dijkshoorn L, Nemec A, Seifert H.. An increasing threat in hospitals: multidrug-resistant Acinetobacter baumannii. Nat Rev Microbiol 2007; 5: 939–51. [DOI] [PubMed] [Google Scholar]
- 2. Adams MD, Goglin K, Hujer KM. et al. Comparative genome sequence analysis of multidrug-resistant Acinetobacter baumannii. J Bacteriol 2008; 190: 8053–64. [DOI] [PMC free article] [PubMed] [Google Scholar]
- 3. Paulsen IT. Multidrug efflux pumps and resistance: regulation and evolution. Curr Opin Microbiol 2003; 6: 446–51. [DOI] [PubMed] [Google Scholar]
- 4. Piddock LJ. Multidrug-resistance efflux pumps—not just for resistance. Nat Rev Microbiol 2006; 4: 629–36. [DOI] [PubMed] [Google Scholar]
- 5. Li XZ, Plésiat P, Nikaido H.. The challenge of efflux-mediated antibiotic resistance in Gram-negative bacteria. Clin Microbiol Rev 2015; 28: 337–418. [DOI] [PMC free article] [PubMed] [Google Scholar]
- 6. Li L, Hassan KA, Paulsen IT. et al. Rapid multiplexed phenotypic screening identifies drug resistance functions for three novel efflux pumps in Acinetobacter baumannii. J Antimicrob Chemother 2016; 71: 1223–32. [DOI] [PubMed] [Google Scholar]
- 7. Hassan KA, Liu Q, Paulsen IT. et al. Homologs of the Acinetobacter baumannii AceI transporter represent a new family of bacterial multidrug efflux systems. MBio 2015; 6: e01982-14. [DOI] [PMC free article] [PubMed] [Google Scholar]
- 8. Hassan KA, Jackson SM, Paulsen IT. et al. Transcriptomic and biochemical analyses identify a family of chlorhexidine efflux proteins. Proc Natl Acad Sci USA 2013; 110: 20254–9. [DOI] [PMC free article] [PubMed] [Google Scholar]
- 9. Grkovic S, Brown MH, Schumacher MA. et al. The staphylococcal QacR multidrug regulator binds a correctly spaced operator as a pair of dimers. J Bacteriol 2001; 183: 7102–9. [DOI] [PMC free article] [PubMed] [Google Scholar]
- 10. Coyne S, Rosenfeld N, Lambert T. et al. Overexpression of resistance-nodulation-cell division pump AdeFGH confers multidrug resistance in Acinetobacter baumannii. Antimicrob Agents Chemother 2010; 54: 4389–93. [DOI] [PMC free article] [PubMed] [Google Scholar]
- 11. Maddocks SE, Oyston PC.. Structure and function of the LysR-type transcriptional regulator (LTTR) family proteins. Microbiology 2008; 154: 3609–23. [DOI] [PubMed] [Google Scholar]
- 12. Russell DA, Byrne GA, O’Connell EP. et al. The LysR-type transcriptional regulator VirR is required for expression of the virulence gene vapA of Rhodococcus equi ATCC 33701. J Bacteriol 2004; 186: 5576–84. [DOI] [PMC free article] [PubMed] [Google Scholar]
- 13. Schell MA. Molecular biology of the LysR family of transcriptional regulators. Annu Rev Microbiol 1993; 47: 597–626. [DOI] [PubMed] [Google Scholar]
- 14. Aravind L, Balaji S, Iyer LM. et al. The many faces of the helix-turn-helix domain: transcription regulation and beyond. FEMS Microbiol Rev 2005; 29: 231–62. [DOI] [PubMed] [Google Scholar]
- 15. Ezezika OC, Haddad S, Neidle EL. et al. Oligomerization of BenM, a LysR-type transcriptional regulator: structural basis for the aggregation of proteins in this family. Acta Crystallogr F Struct Biol Cryst Commun 2007; 63: 361–8. [DOI] [PMC free article] [PubMed] [Google Scholar]
- 16. Choi H, Kim S, Ryu SE. et al. Structural basis of the redox switch in the OxyR transcription factor. Cell 2001; 105: 103–13. [DOI] [PubMed] [Google Scholar]
- 17. Devesse L, Smirnova I, Dian C. et al. Crystal structures of DntR inducer binding domains in complex with salicylate offer insights into the activation of LysR-type transcriptional regulators. Mol Microbiol 2011; 81: 354–67. [DOI] [PubMed] [Google Scholar]
- 18. Bundy BM, Collier LS, Neidle EL. et al. Synergistic transcriptional activation by one regulatory protein in response to two metabolites. Proc Natl Acad Sci USA 2002; 99: 7693–8. [DOI] [PMC free article] [PubMed] [Google Scholar]
- 19. Hassan KA, Brzoska AJ, Paulsen IT. et al. Roles of DHA2 family transporters in drug resistance and iron homeostasis in Acinetobacter spp. J Mol Microbiol Biotechnol 2011; 20: 116–24. [DOI] [PubMed] [Google Scholar]
- 20. Stark MJ. Multicopy expression vectors carrying the lac repressor gene for regulated high-level expression of genes in Escherichia coli. Gene 1987; 51: 255–67. [DOI] [PubMed] [Google Scholar]
- 21. Jacobs AC, Hood I, Boyd KL. et al. Inactivation of phospholipase D diminishes Acinetobacter baumannii pathogenesis. Infect Immun 2010; 78: 1952–62. [DOI] [PMC free article] [PubMed] [Google Scholar]
- 22. Hunger M, Schmucker R, Kishan V. et al. Analysis and nucleotide sequence of an origin of DNA replication in Acinetobacter calcoaceticus and its use for Escherichia coli shuttle plasmids. Gene 1990; 87: 45–51. [DOI] [PubMed] [Google Scholar]
- 23. Wiegand I, Hilpert K, Hancock RE.. Agar and broth dilution methods to determine the minimal inhibitory concentration (MIC) of antimicrobial substances. Nat Protoc 2008; 3: 163–75. [DOI] [PubMed] [Google Scholar]
- 24. Livak KJ, Schmittgen TD.. Analysis of relative gene expression data using real-time quantitative PCR and the 2−ΔΔCT method. Methods 2001; 25: 402–8. [DOI] [PubMed] [Google Scholar]
- 25. Lönneborg R, Brzezinski P.. Factors that influence the response of the LysR type transcriptional regulators to aromatic compounds. BMC Biochem 2011; 12: 49.. [DOI] [PMC free article] [PubMed] [Google Scholar]
- 26. Clark T, Haddad S, Momany C. et al. Crystallization of the effector-binding domains of BenM and CatM, LysR-type transcriptional regulators from Acinetobacter sp. ADP1. Acta Crystallogr D Biol Crystallogr 2004; 60: 105–8. [DOI] [PubMed] [Google Scholar]
- 27. Ezezika OC, Haddad S, Clark TJ. et al. Distinct effector-binding sites enable synergistic transcriptional activation by BenM, a LysR-type regulator. J Mol Biol 2007; 367: 616–29. [DOI] [PubMed] [Google Scholar]
- 28. Tropel D, van der Meer JR.. Bacterial transcriptional regulators for degradation pathways of aromatic compounds. Microbiol Mol Biol Rev 2004; 68: 474–500. [DOI] [PMC free article] [PubMed] [Google Scholar]
- 29. Hayes RP, Moural TW, Lewis KM. et al. Structures of the inducer-binding domain of pentachlorophenol-degrading gene regulator PcpR from Sphingobium chlorophenolicum. Int J Mol Sci 2014; 15: 20736–52. [DOI] [PMC free article] [PubMed] [Google Scholar]
- 30. van Keulen G, Girbal L, Meijer WG. et al. The LysR-type transcriptional regulator CbbR controlling autotrophic CO2 fixation by Xanthobacter flavus is an NADPH sensor. J Bacteriol 1998; 180: 1411–7. [DOI] [PMC free article] [PubMed] [Google Scholar]
- 31. Mandal RS, Ta A, Sinha R. et al. Ribavirin suppresses bacterial virulence by targeting LysR-type transcriptional regulators. Sci Rep 2016; 6: 39454.. [DOI] [PMC free article] [PubMed] [Google Scholar]
- 32. Chen S, Wang H, Zhong Z. et al. LysR family activator-regulated major facilitator superfamily transporters are involved in Vibrio cholerae antimicrobial compound resistance and intestinal colonisation. Int J Antimicrob Agents 2013; 41: 188–92. [DOI] [PubMed] [Google Scholar]
- 33. Smith MG, Gianoulis TA, Pukatzki S. et al. New insights into Acinetobacter baumannii pathogenesis revealed by high-density pyrosequencing and transposon mutagenesis. Genes Dev 2007; 21: 601–14. [DOI] [PMC free article] [PubMed] [Google Scholar]
- 34. Gallagher LA, Ramage E, Weiss EJ. et al. Resources for genetic and genomic analysis of emerging pathogen Acinetobacter baumannii. J Bacteriol 2015; 197: 2027–35. [DOI] [PMC free article] [PubMed] [Google Scholar]
- 35. Goujon M, McWilliam H, Valentin F. et al. A new bioinformatics analysis tools framework at EMBL-EBI. Nucleic Acids Res 2010; 38: W695–9. [DOI] [PMC free article] [PubMed] [Google Scholar]
- 36. Ruangprasert A, Craven SH, Neidle EL. et al. Full-length structures of BenM and two variants reveal different oligomerization schemes for LysR-type transcriptional regulators. J Mol Biol 2010; 404: 568–86. [DOI] [PubMed] [Google Scholar]
Associated Data
This section collects any data citations, data availability statements, or supplementary materials included in this article.


