

Abstract
The physical properties of lipid bilayers, such as curvature and fluidity, can affect the interactions of polypeptides with membranes, influencing biological events. Additionally, given the growing interest in peptide-based therapeutics, understanding the influence of membrane properties on membrane-associated peptides has potential utility. pH low insertion peptides (pHLIPs) are a family of water-soluble peptides that can insert across cell membranes in a pH-dependent manner, enabling the use of pH to follow peptide-lipid interactions. Here we study pHLIP interactions with liposomes varying in size and composition, to determine the influence of several key membrane physical properties. We find that pHLIP binding to bilayer surfaces at neutral pH is governed by the ease of access to the membrane’s hydrophobic core, which can be facilitated by membrane curvature, thickness, and the cholesterol content of the membrane. After surface binding, if the pH is lowered, the kinetics of pHLIP folding to form a helix and subsequent insertion across the membrane depends on the fluidity and energetic dynamics of the membrane. We showed that pHLIP is capable of forming a helix across lipid bilayers of different thicknesses at low pH. However, the kinetics of the slow phase of insertion corresponding to the translocation of C-terminal end of the peptide across lipid bilayer, vary approximately twofold, and correlate with bilayer thickness and fluidity. Although these influences are not large, local curvature variations in membranes of different fluidity could selectively influence surface binding in mixed cell populations.
Introduction
Helical transmembrane proteins constitute ∼30% of all proteins coded in the genome (1). The study of polypeptide insertion into biological membranes can advance our understanding of membrane protein stability and folding, and also has potential practical applications. However, experimental studies have historically been challenging because peptides that are lipophilic enough to form transmembrane helices are typically insoluble in aqueous solution. Biological membranes are also diverse and complex, with anisotropic transmembrane compositions, making evaluation of interactions using model systems difficult (2). Importantly, a bilayer’s physical properties can significantly influence the form and function of membrane-associated proteins (3, 4). As a consequence of these complications, the mechanistic and energetic properties of the interactions between transmembrane peptides and biological membranes are not well understood.
Some of the variation in biological membrane phospholipids is in their acyl chain length and degree of saturation. Acyl chain length and saturation contribute to bilayer thickness and membrane fluidity (5). Cholesterol is another significant component in eukaryotic plasma membranes that modulates lipid dynamics (6, 7). The influence of lipid bilayer properties on the interactions of membrane peptides have only been thoroughly studied for a few cases. The most investigated transmembrane proteins are bacteriorhodopsin and OmpA (8). Previous studies, largely using phosphatidylcholines (PCs) with different hydrocarbon chains, have established that lipid properties can influence the kinetics of insertion and formation of secondary structures in these two proteins. For example, bacteriorhodopsin folding efficiency can be altered by changing the phospholipid headgroups as well as by changing their acyl chain length (9, 10). The folding was suppressed in diC14:0PC lipids compared to longer diC18:1PC and diC16:0PC lipids. In another study, the folding yield and rates of the membrane protein, diacylglycerol kinase, were reduced by shortening the acyl chain length of PC lipids (11). Several studies on spontaneous folding of the β-barrel OmpA protein showed its dependence on the thickness of the membrane bilayer (12, 13). In particular, the kinetics of secondary structure formation of the protein, FomA, strongly depends on bilayer thickness and was slower in diC12PC compare to lipids with longer acyl chains (12).
pH low insertion peptides (pHLIPs) provide an opportunity to examine surface binding and pH-triggered folding across membranes. pHLIPs enable the study of membrane influences on peptide interactions by being stable as soluble monomers in water at neutral or basic pH while responding to low pH by inserting across membranes as a transmembrane α-helix. pHLIPs exist in three major equilibrium states: (State I) soluble in water as a mostly unstructured monomer, (State II) bound to the surface of a lipid bilayer as a mostly unstructured monomer, and (State III) inserted across the bilayer as an α-helix (14). The exact configuration of the peptide in each state depends on the pHLIP sequence. The greatest variability is observed for various pHLIP peptides adsorbed at the membrane bilayer in State II. The existence of these three distinct equilibrium states makes it possible to separate the process of the peptide’s attachment to a lipid bilayer from the process of the peptide’s insertion/folding.
The transition from the membrane-bound State II to the transmembrane State III is controlled by the protonation of carboxyl groups in a pHLIP’s transmembrane domain and, transiently, in the membrane-inserting end of the peptide (15, 16, 17). The negative charges on these acidic side chains in neutral or basic environments prevent the stable presence of the transmembrane domain across the nonpolar membrane core. However, in acidic environments these side chains are fully or partially protonated, promoting insertion and stabilization of the transmembrane helix (18). Thus, the insertion/folding and exit/unfolding of the pHLIP peptides can be triggered by changing the pH, enabling kinetic studies. Insertion kinetics of wild-type pHLIP is well described by a four-state model, which assumes a sequential pathway for the processes of insertion that starts from State II and proceeds to final State III via two intermediates (Int1 and Int2) (17).
Because pHLIPs sense acidity and tumors are acidic, applications are being pursued for tumor-targeted therapies, diagnostics, and research tools (19, 20, 21, 22, 23). Understanding the influence of membrane properties on pHLIPs thus illuminates both basic principles of membrane biology and practical knowledge that may prove useful for the development of pHLIP-based technologies.
Here we present a study of pHLIP interaction with bilayers composed of different monounsaturated PC lipids (diC14:1PC, diC16:1PC, diC18:1PC, diC20:1PC, and diC22:1PC) in the presence and absence of cholesterol, to explore the influences of lipid bilayer properties on pHLIP binding to membrane surfaces and transmembrane helix insertion.
Materials and Methods
Synthesis of pHLIP peptides
The pHLIP peptide (H2N‒GGEQNPIYWARYADWLFTTPLLLLDLALLVDADEGT‒COOH) was prepared by solid-phase peptide synthesis using 9-fluorenylmethyloxycarbonyl chemistry and purified by reverse phase chromatography at the W.M. Keck Foundation Biotechnology Resource Laboratory at Yale University (New Haven, CT). Lyophilized peptide was dissolved in a solution containing 3 M urea to denature any aggregates, then exchanged into 10 mM phosphate buffer, pH 8.0 using a G-10 size-exclusion fast spin column. The peptide concentration was determined by absorbance (ε280 = 13,940 M−1 cm−1).
Liposome preparation
Lipids were purchased from Avanti Polar Lipids (Alabaster, AL) (biological source/molecular names and catalog numbers in parentheses): 14τ1-PC (1,2-dimyristoleoyl-sn-glycero-3-phosphocholine, 850,346C); 16τ1-PC (1,2-dipalmitoleoyl-sn-glycero-3-phosphocholine, 850,358C); 18τ1-PC (1,2-dioleoyl-sn-glycero-3-phosphocholine, 850,375C); 20τ1-PC (1,2-dieicosenoyl-sn-glycero-3-phosphocholine, 850,396C); and 22τ1-PC (1,2-dierucoyl-sn-glycero-3-phosphocho-line, 850,398C). Small unilamellar vesicles, large unilamellar vesicles (LUVs), and giant unilamellar vesicles were prepared by extrusion. Lipids, with or without cholesterol, were dissolved in chloroform and desolvated on a rotary evaporator, and then dried under high vacuum for several hours. The phospholipid film was rehydrated in 10 mM phosphate buffer, pH 8.0, vortexed into suspension, and the suspension was repeatedly extruded using 50-, 100-, 200-nm or 1-μm membrane pore filters (Avanti Polar Lipids).
Steady-state fluorescence and circular dichroism measurements
Fluorescence and circular dichroism (CD) measurements were employed to observe the partitioning of the peptide into a lipid bilayer and the formation of helical structure, respectively, according to previously established experimental protocols (14). Tryptophan fluorescence and CD measurements were carried out on a PC1 photon-counting spectrofluorimeter (ISS, Champaign, IL) and a MOS-450 spectropolarimeter (BioLogic, Cary, NC), respectively, under temperature control. All measurements were performed at 25°C. Peptide fluorescence spectra were recorded from 310 to 410 nm with the spectral widths of excitation and emission slits set at 4 and 2 nm, respectively, using a 295-nm excitation wavelength. The polarizers in the excitation and emission paths were set at the magic angle (54.7° from the vertical orientation) and vertically (0°), respectively, to reduce Wood’s anomalies from the reflecting holographic grating. Peptide CD spectra were recorded from 190 to 270 nm with 1-nm increments using a sample cuvette with an optical path length of 0.5 cm.
A stock solution of pHLIP (typically 20–30 μM) in 10 mM pH 8.0 phosphate buffer was mixed with a stock solution of liposomes (typically 3 mM) in 10 mM pH 8.0 phosphate buffer to obtain a final solution with concentrations of the peptides and lipids of 2 μM and 0.4 mM, respectively. The peptide-lipid solution was equilibrated at 4°C overnight before any measurements were made. For membrane curvature comparison measurements the concentration of peptides and lipids were 4 μM and 0.8 mM, respectively, and the fluorescence excitation wavelength was set at 280 nm to reduce the amount of scattered signal. The selected peptide/lipid ratio of 1:200 ensures that most of the pHLIP peptides are adsorbed at the surface of lipid bilayers as was established in our previous studies (15).
Fluorescence anisotropy measurements
LUVs were prepared from 14:1 PC, 16:1 PC, 18:1 PC, 20:1 PC, and 22:1 PC lipids, with or without cholesterol, according to the protocol described above. pHLIP (2 μM) was added to solutions to give a final pHLIP/lipid molar ratio of 1:200 and the mixture was left overnight to equilibrate. Tryptophan fluorescence polarization was measured on a PC1 photon-counting spectrofluorimeter at 25°C. The widths of excitation and emission slits were 4 nm. Excitation and emission wavelengths were set to 280 and 350 nm, respectively. Fluorescence emission was recorded for 1 min and averaged 10 times. The vertically and horizontally polarized emission intensities were corrected for background scattering by subtraction of the corresponding polarized intensities of a blank containing a suspension of LUVs without pHLIP. Steady-state fluorescence anisotropy was determined according to the following equation:
where IVV and IVH are the emission intensities measured with the excitation polarizer set in the vertical direction and the emission polarizer oriented in the vertical or horizontal directions, respectively. The instrumental factor G (G = IHV/IHH) was determined by measuring the emission intensities of a solution of the fluorescent probe with the excitation polarizer oriented in the horizontal direction.
Oriented CD measurements
Oriented circular dichroism (OCD) was measured from supported bilayers deposited on quartz slides with a special polish for far-UV measurements and with 0.2 mm spacers on one side of each slide (Starna, Atascadero, CA) as previously described (18). Quartz slides were cleaned by 1) sonication for 10 min in diluted cuvette cleaner solution Contrad (Decon Labs, King of Prussia, PA), 2) rinsing with deionized water (≥18.2 MΩ cm at 25°C; Milli-Q Type 1 Ultrapure Water System; EMD Millipore, Burlington, MA), 3) bath sonication for 10 min in 2-propanol, 4) rinsing with deionized water, with 5) bath sonication for 10 min in acetone, 6) followed by sonication for 10 min in 2-propanol and 7) rinsing with deionized water. Then 8) cleaned slides were immersed in Piranha solution (3:1 solution of sulfuric acid to hydrogen peroxide) for 5–10 min to completely remove any remaining organic material from the slides, and, finally, 9) the slides were thoroughly rinsed with and stored in deionized water. A lipid monolayer was deposited on the quartz substrate by the Langmuir-Blodgett method using a KSV Minithrough (KSV NIMA/Biolin Scientific, Paramus, NJ). For the Langmuir-Blodgett deposition, a lipid solution in chloroform was spread on the subphase (Milli-Q purified water kept at 25°C) and the solvent was allowed to evaporate for ∼30 min, followed by monolayer compression to 32 mN/m. The first layer was then deposited by retrieving the slide from the subphase at a rate of 15 mm/min. The second layer of the bilayer was created by fusion. For this step, the monolayer on the slide was incubated with a solution of lipid vesicles (50 nm in diameter obtained by extrusion) mixed with the peptide solution at the desired pH (0.5 mM PC and 10 μM peptide). The fusion was allowed to proceed for ∼6 h at 100% humidity. Then, excess vesicles were removed and the slides were stacked and filled with the peptide solution (5 μM) at the same pH as the pH of the sample used for fusion. Then the bilayers with the peptide solution were allowed to equilibrate for ∼6 h. Measurements were taken at three stages: when the monolayers were incubated with excess liposomes, soon after the spaces between slides were filled with the peptide solution, and again 6 h after this second measurement. Twelve slides (24 bilayers) were assembled and OCD spectra were recorded using a MOS-450 spectropolarimeter (BioLogic). Measurements of control samples of lipid bilayers without peptide were used for background correction.
Kinetics fluorescence measurements
Kinetics fluorescence measurements were carried out on a SFM-300 mixing stopped-flow apparatus connected to a MOS-450 spectrometer (BioLogic) under temperature control as previously described (17, 18). The FC-20 observation cuvette was used. All solutions were degassed several minutes under vacuum before loading into the syringes to minimize air bubbles. A 4 μM solution of pHLIP was preincubated with liposomes made from each of the chain-length series of PCs (14:1 PC, 16:1 PC, 18:1 PC, 20:1 PC, and 22:1 PC; 0.8 mM of lipids) and 18:1 PC with 20% of cholesterol at pH 8.0 to reach equilibrium in State II, and folding/insertion was induced by fast mixing (5 ms dead time) of equal volumes of the pHLIP-liposome mixture at pH 8.0 and appropriately diluted HCl, to give a pH drop from pH 8.0 to pH 3.6. The final peptide and lipid concentrations were 2 μM and 0.4 mM, respectively. Changes in tryptophan fluorescence were recorded through a 320-nm long-pass filter using an excitation wavelength of 295 nm. The fluorescence signal was corrected for photobleaching. Each kinetic curve was recorded several times and then averaged, excluding the first 2–3 shots. The signals were normalized to a starting point of 1 by using the baseline kinetics recorded at pH 8.0. In most cases these samples were then used for steady-state fluorescence measurements recorded on a PC1 photon-counting spectrofluorimeter.
In control experiments we found that liposome size (50 or 100 nm) does not detectably affect the State II to State III kinetics of peptide insertion into a membrane. Different peptide/lipid ratios, such as 1:200 and 1:350, were investigated and no difference in kinetics was observed. Different pH jumps from pH 8 to pH 3 or from pH 8 to pH 4 also do not affect kinetics runs.
Data analysis
All data were fit to the appropriate equations by nonlinear least-squares curve-fitting procedures employing the Levenberg-Marquardt algorithm using Origin 8.5.
Results
To explore lipid effects on the surface binding and transmembrane transition of a peptide as it enters a bilayer, we used pH-triggered insertion of a pHLIP peptide, observing the processes by optical spectroscopy. First, equilibrium studies on peptide-lipid systems were carried out. We varied lipid chain length, cholesterol content, and vesicle curvature using five different lipids: diC14:1PC, diC16:1PC, diC18:1PC, diC20:1PC, and diC22:1PC (Fig. S1). Cholesterol content ranged from 0 to 30%, and liposome sizes ranged from 50 to 1000 nm in diameter. The binding of pHLIP to the lipid bilayer at the high pH (State II) was monitored by the shift of the pHLIP fluorescence spectra to shorter wavelengths, which reflects the transfer of tryptophan fluorophores from aqueous solution to a more hydrophobic membrane surface environment (24). The emission maximum was 351–352 nm for pHLIP interacting with large liposomes (1000 nm in diameter) of different compositions, indicating significant exposure of tryptophan residues to water (Fig. 1 a). On the other hand, a more blue-shifted fluorescence was observed when pHLIP was bound to membranes of greater curvature (i.e., smaller diameter), and much less variability (<2 nm shift of the fluorescence maximum) was seen for the interactions of pHLIP with vesicles of different sizes composed of short acyl chain diC14:1PC lipids. We also observed progressively larger blue shifts of pHLIP fluorescence in liposomes composed of diC18:1PC lipids containing increasing amounts of cholesterol (up to 30%) (Fig. 1 b). Increasing cholesterol content decreases membrane fluidity, especially in the vicinity of membrane surface, and increases lipid bilayer thickness (7).
Figure 1.

pHLIP interaction with membranes of different curvature and cholesterol content at pH 8. The position of maximum (Lmax) of fluorescence spectra of pHLIP was measured at pH 8.0 in the presence of liposomes of various lipid compositions, diC14:1PC, diC16:1PC, diC18:1PC, diC20:1PC, and diC22:1PC and various sizes from 50 to 1000 nm in diameter (a), and diC18:1 PC liposomes of 100 nm in diameter with varying amount of cholesterol (b).
We have emphasized the study of pHLIP interactions with small liposomes (50 nm in diameter), because small vesicle diameter minimizes the contribution of the light scattering signal in kinetics experiments. In small vesicles, a blue shift of the position of the pHLIP fluorescence maximum at pH 8 correlates with a decrease of bilayer thickness (Figs. S2 a and 2 a). CD measurements show formation of peptide helical structure in the presence of liposomes composed of lipids of different acyl chain lengths at low pH (Fig. S2 b). The increase of helicity was monitored by the appearance of CD signal at 222 nm and presented as the ratio of the CD signal at 222–208 nm (Fig. 2 b) (25, 26, 27). The increasing 222/208 nm CD ratio with increasing acyl chain length at pH 8 indicates the appearance of peptide helical content. The helicity of the State II peptide in thick bilayers approaches that of the inserted form in State III. At the same time, the fluorescence anisotropy varies just slightly, within a range from 0.06 to 0.07, with a maximal value observed for diC18:1PC liposomes at pH 8 (Fig. 2 c). The values obtained for the fluorescence anisotropy (close to zero) reflect a rather high flexibility of tryptophan residues in State II. Despite the fact that fluorescence anisotropy measurements were carried out at long wavelength (350 nm), the absolute values obtained for the fluorescence anisotropy should be treated with caution, because polarized emission intensities were corrected for background scattering (see Materials and Methods).
Figure 2.
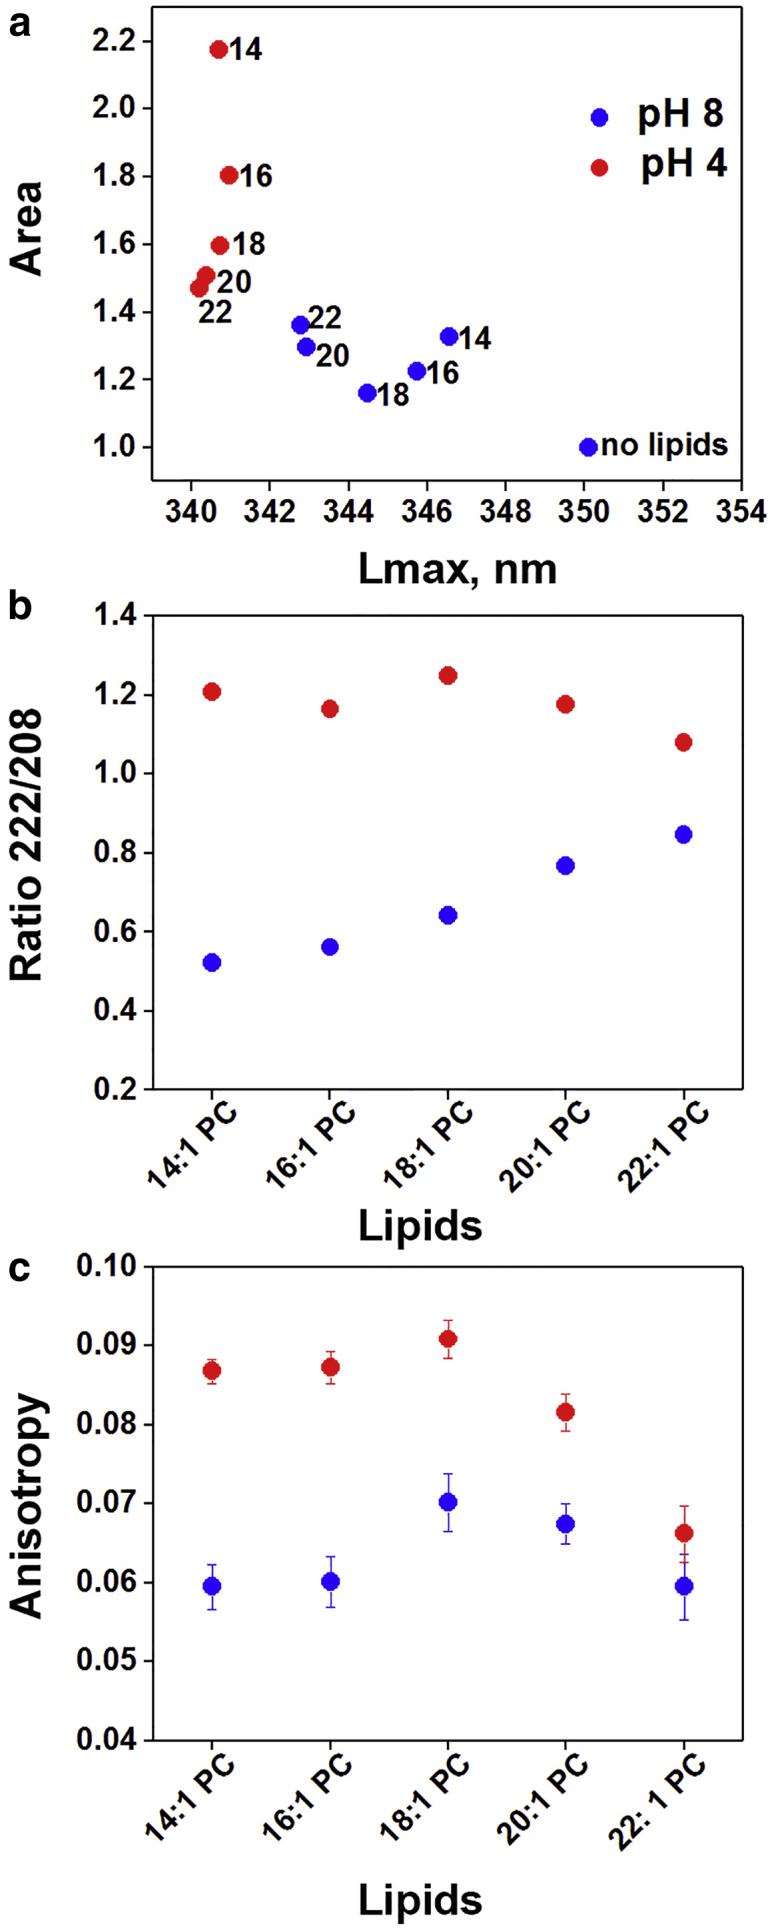
pHLIP interaction with membranes of different thickness at pH 8 and pH 4. (a) The relations between normalized area under the pHLIP fluorescence spectra and position of maxima of emission (Lmax) are shown. The fluorescence intensity was normalized for the intensity of 2 μM of pHLIP in the solution without liposomes. Numbers next to the points denote the acyl chain length of the lipids. Fluorescence spectra of pHLIP in different states are shown in Fig. S2a. (b) Ratio of ellipticity at 222 and 208 nm of pHLIP measured in the presence of liposomes of various lipid compositions are presented. CD spectra of pHLIP in different states are shown in Fig. S2b. (c) Anisotropy of pHLIP tryptophan fluorescence measured at 350 nm in the presence of liposomes of various lipid compositions are shown; error bars are SD (n = 10 experiments). Peptide and lipid concentrations were 2 μM and 0.4 mM consequently, and an average liposome diameter was 50 nm in all measurements. The data obtained at pH 8 and pH 4 are shown in blue and red, respectively.
Several significant spectral changes are seen with a drop of pH from pH 8 to pH 4: 1) the fluorescence intensity increases, 2) there is a short-wavelength shift of the emission maximum, 3) there is an increase of fluorescence anisotropy, and 4) the helicity increases (Figs. S2 and 2). These signals are each consistent with the formation and partitioning of helical peptide structures into the lipid bilayer. pHLIP interacting with membranes comprised of long lipids, diC20:1PC and diC22:1PC, exhibited reduced quantum yields and the smallest fluorescence anisotropy values in State III compared to the liposomes of thinner bilayers. Quantum yield or fluorescence intensity correlates with the degree of tryptophan residue’s exposure to potential quenchers, such as polar and flexible water molecules, reflecting less exposure of pHLIP to aqueous solution in thicker bilayers.
The formation of a helix in State III does not, by itself, establish that the helix has a transmembrane orientation. To determine the orientation of the pHLIP α-helix with respect to the bilayer plane at low pH, we recorded OCD spectra (28). When pHLIP was incubated with supported bilayers made of diC14:1PC, diC18:1PC, and diC22:1PC lipids at pH 3.6, a characteristic OCD spectrum corresponding to the transmembrane orientation was obtained for each lipid type with positive and negative bands around 197 and 222 nm, respectively, and the absence of a 208-nm band (Fig. 3). Because pHLIP was in its helical configuration when interacting with a thick bilayer, especially diC22:1PC liposomes in State II (at pH 8), we performed comparative OCD measurements at high and low pH values (Fig. S3). In contrast to the transmembrane helical orientation that the peptide adopts at low pH, a surface helical orientation was observed at high pH in State II, because OCD spectrum recorded at high pH has both negative peaks, at 208 and 222 nm, corresponding to a membrane-surface helix (28). To keep a focus on bilayer variables, we emphasize examination of pHLIP insertion into membranes composed of diC14:1PC, diC16:1PC, and diC18:1PC lipids, which are associated with the coil to helix transition, and completed by the formation of a stable transmembrane helix. By having three comparable transitions, we cover a range of bilayer properties that more closely resembles a biological membrane.
Figure 3.
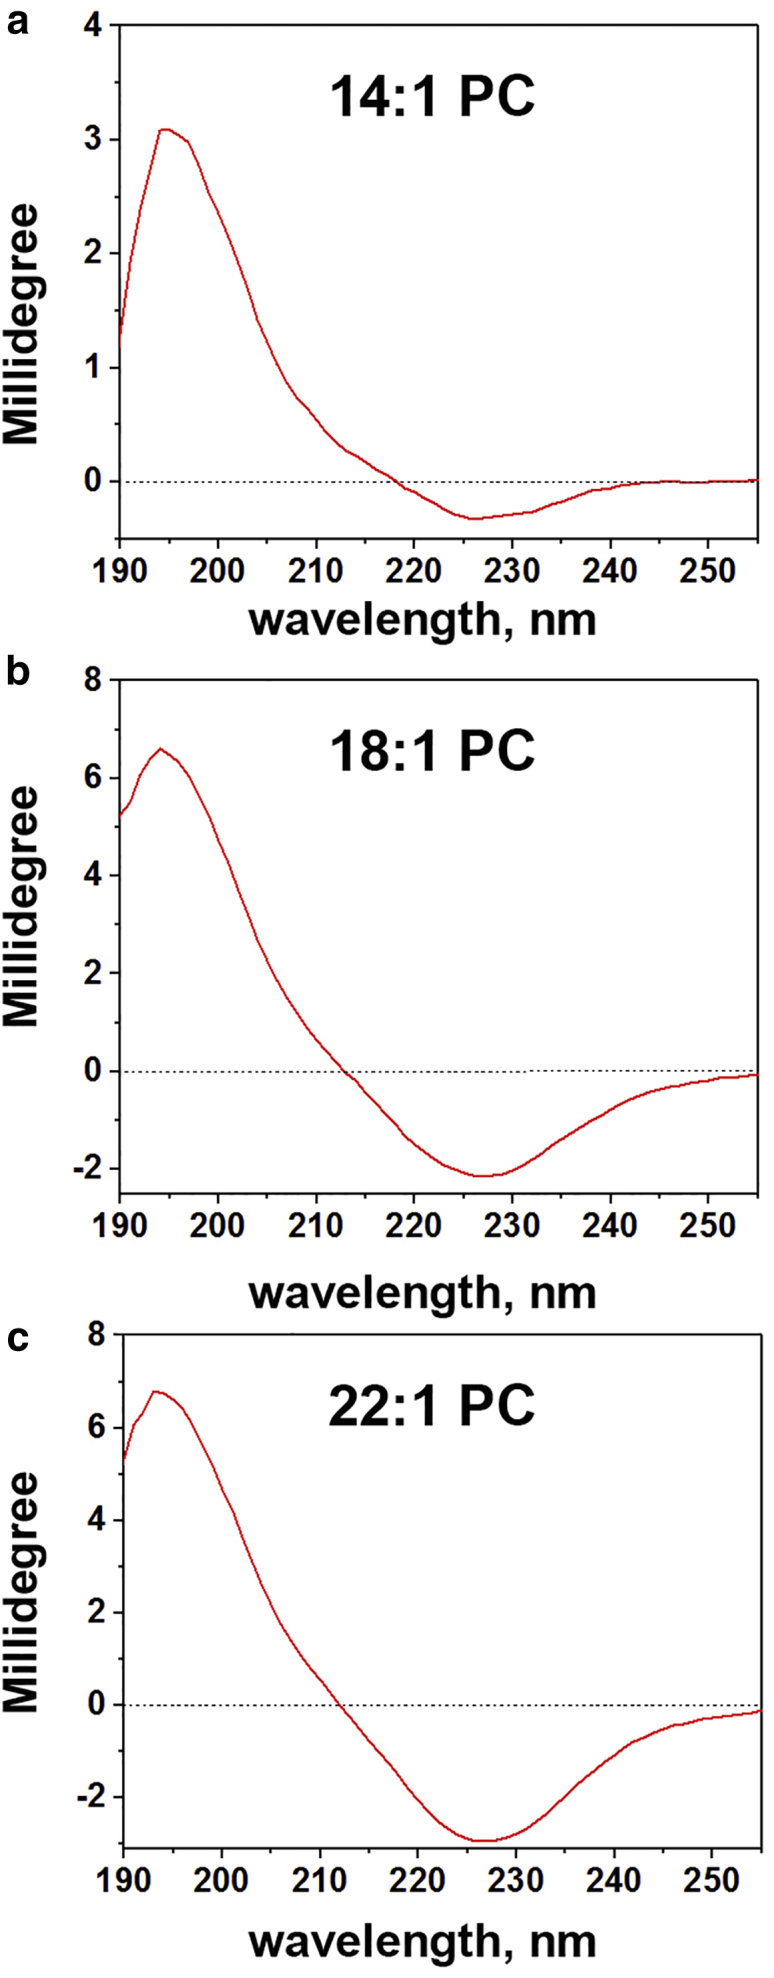
OCD of pHLIP. OCD spectra of pHLIP interacting with diC14:1PC (a), diC18:1PC (b), and diC22:1PC (c) lipid membranes at pH 3.6 are shown.
We found that pHLIP insertion kinetics is highly dependent upon membrane composition and membrane fluidity (Fig. S4). Stopped-flow kinetic studies were based on the following changes in the tryptophan fluorescence of pHLIPs interacting with liposomes of various lipid compositions and liposomes of diC18:1PC lipids in the presence of 20% cholesterol. The excitation wavelength was set at 295 nm to minimize the contribution of tyrosine fluorescence and the possibility of tyrosine-tryptophan energy transfer. The liposome diameter was kept at 50 nm to minimize light scattering, and the insertion of pHLIPs into the liposomes was triggered by a pH drop from 8 to 3.6. The insertion occurred through three statistically identifiable steps (transitions), and the changes of fluorescence signals were fitted with a four-state model (see details in (17)) that assumes a sequential pathway for the processes of insertion that starts from State II and proceeds to final State III via two intermediates: State I → Int1 → Int2 → State III.
The characteristic rate constants that were obtained as the result of exponential fittings were related to the real rate constants reflecting three transitions from State I to Int1, Int1 to Int2, and Int2 to State III through a set of equations:
where v1, v2, and v3 are the characteristic rates of the transitions and k1, k2, and k3 are the rate constants (Table 1). The rates for pHLIP insertion to adopt a State III decrease with increasing acyl chain length or the presence of 20% of cholesterol in the membrane.
Table 1.
The Rate Constants Characterizing Transitions
| 14:1 PC | 16:1 PC | 18:1 PC | 18:1 PC 20% chol. | |
|---|---|---|---|---|
| k1 k2 k3 |
57 3.4 0.14 |
77 3.1 0.13 |
103 4.9 0.06 |
100 1.9 0.01 |
The rate constants (k, sec−1) characterizing transitions from State I to Int1; Int1 to Int2; and Int2 to State III along the pHLIP insertion pathway into the lipid bilayer of liposomes of various lipid compositions and cholesterol content.
To obtain kinetics activation energies, we monitored changes in tryptophan fluorescence at different temperatures (7, 14, 18, and 25°C) (Fig. 4, a–c). As expected, increasing the temperature speeds up the process of insertion for membrane systems of different thickness. To calculate activation energies associated with transitions from one state to another, Arrhenius plots were constructed for each membrane type (Fig. S5) by fitting of the data-points with the linear equation:
where Ea is the activation energy and A is the frequency factor. The total activation energy barriers of pHLIP insertion into 50 nm liposomes composed of diC14:1PC, diC16:1PC, and diC18:1PC increased with bilayer thickness and were: 36.4, 40.2, and 46.8 kcal/mol, respectively (Fig. 4 d; Table 2). Activation energies of the first step of pHLIP insertion (∼11 kcal/mol) do not depend on the lipid type. The first step is associated with the transition from coil to helical structure on the surface of the lipid bilayer, as was shown previously (17). The second step is slightly influenced, with a varied activation energy from 13.0 to 12.7 to 14.1 kcal/mol. But, the strongest effects are seen in the final step of pHLIP insertion across the bilayer, which correlate with the lipid bilayer thickness. For diC14:1PC, diC16:1PC, and diC18:1PC the activation energy barriers are found to be 10.1, 16.6, and 21.3 kcal/mol, respectively, for the final insertion step across the hydrophobic core of the membrane. It is interesting to note that the frequency factors for the final transition from Int2 → State III also increased with bilayer thickness (LnA in Fig. S6). The activation barrier for thin bilayers is low, and the probability of the final transition is also low, whereas thicker lipids create a higher activation barrier that is accompanied by a higher rate of transition. These observations might be attributed to the different configurations of the peptide in the initial (adsorbed) State II and the final (inserted) State III in liposomes of different thicknesses. Molecular dynamics calculations might be helpful to reveal atomic positioning of peptides at various states in various lipid systems.
Figure 4.

Insertion kinetics of pHLIP across different bilayers at different temperatures and calculated activation energies. Kinetics of pHLIP insertion across the lipid bilayer of 50 nm liposomes comprising diC14:1PC (a), diC16:1PC (b), and diC18:1PC (c) lipids were monitored by changes of tryptophan fluorescence of pHLIP as a result of pH jump from 8.0 to 3.6 at different temperatures. Activation energy, Ea, and SE were calculated for the transitions between four states along the pHLIP insertion pathway by the fitting of rates (Fig. S5) with an Arrhenius function (d). The activation energy values are given in Table 2.
Table 2.
The Values of the Activation Energies
| Transitions | 14:1 PC | 16:1 PC | 18:1 PC |
|---|---|---|---|
| State II → Int1 Int1 → Int2 Int2 → State III |
11.4 ± 1.7 13.0 ± 1.0 10.1 ± 2.2 |
10.9 ± 1.3 12.7 ± 2.4 16.6 ± 0.9 |
11.4 ± 1.5 14.1 ± 2.3 21.3 ± 2.2 |
| Total: State II → State III | 34.6 | 40.2 | 46.8 |
The values of the activation energies (Ea, kcal/mol) and St. Er. were calculated for the transitions from State I to Int1; Int1 to Int2; and Int2 to State III along the pHLIP insertion pathway into the lipid bilayer of liposomes of various lipid compositions by fitting of rates (Fig. S5) with Arrhenius function.
Discussion
As expected, interactions of a pHLIP with membranes at both high and low pH are perturbed by altering the thickness, curvature, and flexibility of lipid bilayers, but now we can reach a greater understanding of these effects. Deeper partitioning of the peptide is observed with thicker (less flexible/fluid) bilayers (diC20:1PC and diC22:1PC) as well as more curved bilayers (50 nm), this deeper partitioning is accompanied by formation of helical structures parallel to the membrane surface. Although the peptide adopts the transmembrane State III configuration in all bilayer types at low pH, in thick bilayers the lipids can be perturbed by the pHLIP helix caused by a possible “hydrophobic mismatch”: a difference in the thickness of the bilayer core and the length of the peptide’s transmembrane domain. Hypothetically, water molecules at the interface of a disturbed bilayer can more readily access the fluorophore’s indole ring and quench its fluorescence. The decrease of fluorescence anisotropy in thick bilayers could also be explained by enhanced flexibility of tryptophan residues because of this partial exposure to water molecules where there is a hydrophobic mismatch.
Our previous thermodynamics and kinetics studies indicated that ∼200 lipids are perturbed, when unstructured pHLIP occupies membrane surface at pH 8 in State II (15), and ∼85% of interfacial helical structure is formed within first ∼0.1 s after pH drop from 8 to 3.6 (18). We assume that when a peptide forms a rigid helical structure and penetrates deeply into one monolayer of a lipid bilayer, it leads to the disruption of the ordered alignment of lipids, promoting instability and dynamic membrane tension, which presumably drives peptide insertion. The membrane tensions and instability are released when the peptide adopts a transmembrane orientation, when only 10–20 lipids are interacting with helix in State III at low pH (15). Bilayer curvature and lipid composition would influence that tension, due to the differences in flexibility between thick versus thin or highly curved versus planar bilayers. The hydrophobic core of the bilayer represents a barrier for the insertion that requires energy to overcome.
In the kinetics studies of pHLIP insertion into membranes composed of diC14:1PC, diC16:1PC, and diC18:1PC lipids, increased lipid acyl chain length is predicted to increase the hydrophobic thickness of the bilayer from 20 to 28 Å (5) and decrease membrane fluidity (9) by creating a higher hydrophobic barrier. The increased content of cholesterol (20%) in liposomes comprised of diC18:1PC lipids also leads to the increase of bilayer thickness and decrease of membrane fluidity (7). The rate of pHLIP insertion was correlated with the acyl chain length of the lipid bilayer and the presence of cholesterol in diC18:1PC membranes, as the fastest insertion was observed into the thinner bilayers (diPC14:1) and slowest insertion into the thicker bilayers (diPC18:1) with 20% cholesterol. The process of pHLIP insertion from State II to State III follows a four-state kinetic model with three transition steps. The first step (interfacial helix formation) does not depend much on the lipid acyl chain length. However, the final step of insertion (translocation of pHLIP’s C terminus across the membrane) increases substantially in activation energy with increasing of lipid bilayer thickness and order. These results correlate with previous studies that showed State II helix formation is independent of the number of protonatable groups at the inserting end of pHLIP, whereas the time of transmembrane helix formation increases with increasing number of charged groups or presence of cargo in the inserting C terminus (17). Thus, the activation barrier for a polypeptide insertion into membrane is affected by 1) thickness and fluidity of membrane bilayer and/or 2) by charges and polarity of cargo attached to the peptide inserting end.
It is also important to note that the process of peptide insertion starts from different initial configurations of pHLIPs (and potentially slightly different final inserted configurations) for different lipid bilayers. In State II, pHLIPs have more helical structure and deeper penetration into the outer monolayer of bilayers with longer acyl chains and with highly curved membranes (29). We demonstrated that pHLIP is sensing hydrophobic exposure in the membrane lipids. The exposure results from a combination of two factors: high curvature of the bilayer (small unilamellar vesicles versus LUVs and versus giant unilamellar vesicles), and long acyl chains of the lipids that compose this bilayer. Packing defects of the lipid headgroups located on the outer leaflets create the spaces for peptide-enhanced binding to membrane.
pHLIPs have been under development for clinical applications due to their tumor targeting activity in vivo (19, 20, 21, 30, 31). Their specific accumulation in tumors is thought to primarily result from its differential interaction with membranes at basic versus acidic pH. The observations we report here allow us to view additional factors that may influence pHLIP targeting in the body or translocation of cargo molecules across bilayers of various membranes within a cell, because peptide insertion could be promoted in membranes with lower thickness and higher fluidity or regions of high curvature. It has been shown that the membranes of human leukemia and lymphoma cancer cells have an increased fluidity, which is attributed to changes in their phospholipid and cholesterol content (32, 33). With abnormally high rates of cell division, cancer cells often exhibit such changes in membrane composition as they must upregulate biosynthetic pathways to provide cell building blocks, such as membrane components, rather than relying on circulating supplies. Because biosynthesis-sourced membranes significantly differ from the membrane composition of healthy cells, cancer cells are likely to have an abnormal set of membrane physical properties. Although the physical properties of biological membranes are a likely factor influencing the selective targeting of cancer cells by pHLIPs and other membrane-interactive molecules, we find the effects are not dramatically large in our model systems. Nevertheless, local fluidity enhances local curvature in membranes, locally exposing more hydrophobic area in a bilayer. Surface binding of a peptide could be enhanced in tumor cells by such effects.
Author Contributions
A.G.K., O.A.A., Y.K.R., and D.M.E. designed research. A.G.K. and D.W. performed research. A.G.K., Y.K.R., and D.M.E. analyzed data. A.G.K., J.D., Y.K.R., and D.M.E. wrote the paper.
Acknowledgments
O.A.A., D.M.E., and Y.K.R. have founded and have a financial interest in a company, pHLIP, Inc., with the aim of bringing pHLIP technology to the clinic. The company has had no involvement in funding the studies reported here.
This work was supported by grants from the National Institute of General Medical Sciences of the National Institutes of Health under award No. GM073857.
Editor: Charles Deber.
Footnotes
Six figures are available at http://www.biophysj.org/biophysj/supplemental/S0006-3495(18)30458-2.
Contributor Information
Yana K. Reshetnyak, Email: reshetnyak@uri.edu.
Donald M. Engelman, Email: donald.engelman@yale.edu.
Supporting Material
References
- 1.Wallin E., von Heijne G. Genome-wide analysis of integral membrane proteins from eubacterial, archaean, and eukaryotic organisms. Protein Sci. 1998;7:1029–1038. doi: 10.1002/pro.5560070420. [DOI] [PMC free article] [PubMed] [Google Scholar]
- 2.van Meer G., Voelker D.R., Feigenson G.W. Membrane lipids: where they are and how they behave. Nat. Rev. Mol. Cell Biol. 2008;9:112–124. doi: 10.1038/nrm2330. [DOI] [PMC free article] [PubMed] [Google Scholar]
- 3.McIntosh T.J., Simon S.A. Roles of bilayer material properties in function and distribution of membrane proteins. Annu. Rev. Biophys. Biomol. Struct. 2006;35:177–198. doi: 10.1146/annurev.biophys.35.040405.102022. [DOI] [PubMed] [Google Scholar]
- 4.Lee A.G. How lipids affect the activities of integral membrane proteins. Biochim. Biophys. Acta. 2004;1666:62–87. doi: 10.1016/j.bbamem.2004.05.012. [DOI] [PubMed] [Google Scholar]
- 5.Lewis B.A., Engelman D.M. Lipid bilayer thickness varies linearly with acyl chain length in fluid phosphatidylcholine vesicles. J. Mol. Biol. 1983;166:211–217. doi: 10.1016/s0022-2836(83)80007-2. [DOI] [PubMed] [Google Scholar]
- 6.Oldfield E., Chapman D. Dynamics of lipids in membranes: heterogeneity and the role of cholesterol. FEBS Lett. 1972;23:285–297. doi: 10.1016/0014-5793(72)80300-4. [DOI] [PubMed] [Google Scholar]
- 7.Subczynski W.K., Pasenkiewicz-Gierula M., Raguz M. High cholesterol/low cholesterol: effects in biological membranes: a review. Cell Biochem. Biophys. 2017;75:369–385. doi: 10.1007/s12013-017-0792-7. [DOI] [PMC free article] [PubMed] [Google Scholar]
- 8.Mitchell D.C. Progress in understanding the role of lipids in membrane protein folding. Biochim. Biophys. Acta. 2012;1818:951–956. doi: 10.1016/j.bbamem.2011.12.029. [DOI] [PubMed] [Google Scholar]
- 9.Anbazhagan V., Schneider D. The membrane environment modulates self-association of the human GpA TM domain—implications for membrane protein folding and transmembrane signaling. Biochim. Biophys. Acta. 2010;1798:1899–1907. doi: 10.1016/j.bbamem.2010.06.027. [DOI] [PubMed] [Google Scholar]
- 10.Curran A.R., Templer R.H., Booth P.J. Modulation of folding and assembly of the membrane protein bacteriorhodopsin by intermolecular forces within the lipid bilayer. Biochemistry. 1999;38:9328–9336. doi: 10.1021/bi982322+. [DOI] [PubMed] [Google Scholar]
- 11.Seddon A.M., Lorch M., Booth P.J. Phosphatidylglycerol lipids enhance folding of an α-helical membrane protein. J. Mol. Biol. 2008;380:548–556. doi: 10.1016/j.jmb.2008.05.001. [DOI] [PubMed] [Google Scholar]
- 12.Kleinschmidt J.H., Tamm L.K. Secondary and tertiary structure formation of the β-barrel membrane protein OmpA is synchronized and depends on membrane thickness. J. Mol. Biol. 2002;324:319–330. doi: 10.1016/s0022-2836(02)01071-9. [DOI] [PubMed] [Google Scholar]
- 13.Pocanschi C.L., Apell H.J., Kleinschmidt J.H. The major outer membrane protein of Fusobacterium nucleatum (FomA) folds and inserts into lipid bilayers via parallel folding pathways. J. Mol. Biol. 2006;355:548–561. doi: 10.1016/j.jmb.2005.10.060. [DOI] [PubMed] [Google Scholar]
- 14.Reshetnyak Y.K., Segala M., Engelman D.M. A monomeric membrane peptide that lives in three worlds: in solution, attached to, and inserted across lipid bilayers. Biophys. J. 2007;93:2363–2372. doi: 10.1529/biophysj.107.109967. [DOI] [PMC free article] [PubMed] [Google Scholar]
- 15.Reshetnyak Y.K., Andreev O.A., Engelman D.M. Energetics of peptide (pHLIP) binding to and folding across a lipid bilayer membrane. Proc. Natl. Acad. Sci. USA. 2008;105:15340–15345. doi: 10.1073/pnas.0804746105. [DOI] [PMC free article] [PubMed] [Google Scholar]
- 16.Musial-Siwek M., Karabadzhak A., Engelman D.M. Tuning the insertion properties of pHLIP. Biochim. Biophys. Acta. 2010;1798:1041–1046. doi: 10.1016/j.bbamem.2009.08.023. [DOI] [PMC free article] [PubMed] [Google Scholar]
- 17.Karabadzhak A.G., Weerakkody D., Reshetnyak Y.K. Modulation of the pHLIP transmembrane helix insertion pathway. Biophys. J. 2012;102:1846–1855. doi: 10.1016/j.bpj.2012.03.021. [DOI] [PMC free article] [PubMed] [Google Scholar]
- 18.Andreev O.A., Karabadzhak A.G., Reshetnyak Y.K. pH (low) insertion peptide (pHLIP) inserts across a lipid bilayer as a helix and exits by a different path. Proc. Natl. Acad. Sci. USA. 2010;107:4081–4086. doi: 10.1073/pnas.0914330107. [DOI] [PMC free article] [PubMed] [Google Scholar]
- 19.Andreev O.A., Dupuy A.D., Reshetnyak Y.K. Mechanism and uses of a membrane peptide that targets tumors and other acidic tissues in vivo. Proc. Natl. Acad. Sci. USA. 2007;104:7893–7898. doi: 10.1073/pnas.0702439104. [DOI] [PMC free article] [PubMed] [Google Scholar]
- 20.Viola-Villegas N.T., Carlin S.D., Lewis J.S. Understanding the pharmacological properties of a metabolic PET tracer in prostate cancer. Proc. Natl. Acad. Sci. USA. 2014;111:7254–7259. doi: 10.1073/pnas.1405240111. [DOI] [PMC free article] [PubMed] [Google Scholar]
- 21.Reshetnyak Y.K., Yao L., Andreev O.A. Measuring tumor aggressiveness and targeting metastatic lesions with fluorescent pHLIP. Mol. Imaging. Biol. 2011;13:1146–1156. doi: 10.1007/s11307-010-0457-z. [DOI] [PMC free article] [PubMed] [Google Scholar]
- 22.Karabadzhak A.G., An M., Engelman D.M. pHLIP-FIRE, a cell insertion-triggered fluorescent probe for imaging tumors demonstrates targeted cargo delivery in vivo. ACS Chem. Biol. 2014;9:2545–2553. doi: 10.1021/cb500388m. [DOI] [PMC free article] [PubMed] [Google Scholar]
- 23.Sosunov E.A., Anyukhovsky E.P., Andreev O.A. pH (low) insertion peptide (pHLIP) targets ischemic myocardium. Proc. Natl. Acad. Sci. USA. 2013;110:82–86. doi: 10.1073/pnas.1220038110. [DOI] [PMC free article] [PubMed] [Google Scholar]
- 24.Reshetnyak Y.K., Koshevnik Y., Burstein E.A. Decomposition of protein tryptophan fluorescence spectra into log-normal components. III. Correlation between fluorescence and microenvironment parameters of individual tryptophan residues. Biophys. J. 2001;81:1735–1758. doi: 10.1016/S0006-3495(01)75825-0. [DOI] [PMC free article] [PubMed] [Google Scholar]
- 25.Wallimann P., Kennedy R.J., Kemp D.S. Dual wavelength parametric test of two-state models for circular dichroism spectra of helical polypeptides: anomalous dichroic properties of alanine-rich peptides. J. Am. Chem. Soc. 2003;125:1203–1220. doi: 10.1021/ja0275360. [DOI] [PubMed] [Google Scholar]
- 26.Kwok S.C., Hodges R.S. Stabilizing and destabilizing clusters in the hydrophobic core of long two-stranded α-helical coiled-coils. J. Biol. Chem. 2004;279:21576–21588. doi: 10.1074/jbc.M401074200. [DOI] [PubMed] [Google Scholar]
- 27.Bürck J., Wadhwani P., Ulrich A.S. Oriented circular dichroism: a method to characterize membrane-active peptides in oriented lipid bilayers. Acc. Chem. Res. 2016;49:184–192. doi: 10.1021/acs.accounts.5b00346. [DOI] [PubMed] [Google Scholar]
- 28.Wu Y., Huang H.W., Olah G.A. Method of oriented circular dichroism. Biophys. J. 1990;57:797–806. doi: 10.1016/S0006-3495(90)82599-6. [DOI] [PMC free article] [PubMed] [Google Scholar]
- 29.Barrera F.N., Fendos J., Engelman D.M. Membrane physical properties influence transmembrane helix formation. Proc. Natl. Acad. Sci. USA. 2012;109:14422–14427. doi: 10.1073/pnas.1212665109. [DOI] [PMC free article] [PubMed] [Google Scholar]
- 30.Cruz-Monserrate Z., Roland C.L., Logsdon C.D. Targeting pancreatic ductal adenocarcinoma acidic microenvironment. Sci. Rep. 2014;4:4410. doi: 10.1038/srep04410. [DOI] [PMC free article] [PubMed] [Google Scholar]
- 31.Macholl S., Morrison M.S., Johannesen E. In vivo pH imaging with (99m)Tc-pHLIP. Mol. Imaging Biol. 2012;14:725–734. doi: 10.1007/s11307-012-0549-z. [DOI] [PMC free article] [PubMed] [Google Scholar]
- 32.Sherbet G.V. Membrane fluidity and cancer metastasis. Exp. Cell Biol. 1989;57:198–205. doi: 10.1159/000163526. [DOI] [PubMed] [Google Scholar]
- 33.Kiss C., Balázs M., Kéri-Fülöp I. Dexamethasone decreases membrane fluidity of leukemia cells. Leuk. Res. 1990;14:221–225. doi: 10.1016/0145-2126(90)90129-w. [DOI] [PubMed] [Google Scholar]
Associated Data
This section collects any data citations, data availability statements, or supplementary materials included in this article.