Abstract
Escalating healthcare costs and inconsistent quality is exacerbated by clinical practice variability. Diagnostic testing is the highest volume medical activity, but human intuition is typically unreliable for quantitative inferences on diagnostic performance characteristics. Electronic medical records from a tertiary academic hospital (2008-2014) allow us to systematically predict laboratory pre-test probabilities of being normal under different conditions. We find that low yield laboratory tests are common (e.g., ~90% of blood cultures are normal). Clinical decision support could triage cases based on available data, such as consecutive use (e.g., lactate, potassium, and troponin are >90% normal given two previously normal results) or more complex patterns assimilated through common machine learning methods (nearly 100% precision for the top 1% of several example labs).
Introduction
Unsustainable growth in health care costs is in part due to waste that does not actually improve health1. The Institute of Medicine estimates that over two hundred billion dollars a year are spent on tests and procedures that are unnecessary2. Given this sobering amount of misallocated resources, there has been an increasing emphasis on high value care, notably with the American Board of Internal Medicine’s (ABIM) Choosing Wisely guidelines3. Lab testing is an important target for high value care efforts as it constitutes the highest volume medical activity.4 Prior research suggests that in the inpatient setting, unnecessary labs constitute a quarter to half of all testing.5,6 Consequently, guidelines regarding high value care and lab testing have been emphasized by numerous professional medical societies in both general inpatient and critical care settings (http://www.choosingwisely.org).
A major barrier to high value care is variability in clinical practice among providers. A meta-analysis of lab testing reports both over- and under-utilization, depending on the clinical setting4. When used properly, diagnostic testing yields information that positively impacts decision-making. The consequences of inappropriate ordering are not merely financial. Poorly chosen diagnostics may lead to misinterpreted results and treatment. For example, cardiac stress testing often does not reclassify patients beyond risk assessments achievable from a basic history, physical exam, and laboratory tests. More so, for a patient complaining of chest pain with a high pre-test probability of cardiac disease (e.g., elderly male with a history of diabetes and cigarette smoking), accepting a “normal” cardiac stress test as reassurance of health reflects inappropriate medical care due to the high risk of a false negative test. Complementary false positives include incidental findings that subject patients to the risk of additional follow-up testing, procedures, and complications8. Serially repeated lab draws, for example, contribute to adverse outcomes including iatrogenic anemia,9 impaired sleep, risk of delirium and overall decreased patient comfort and satisfaction.5
Given the aforementioned issues, there is increasing emphasis on high value care education10- 13 to avoid diagnostics without reasonable expectation to change management decisions. Human doctors typically have heuristic impressions for diagnostic utilities, but an over-reliance on anecdotal data subject to availability, framing, and anchoring bias as well as fatigue and excess responsibilities can confound decision making. The result is that most human (physicians) have a poor intuition for quantitatively applying diagnostic test performance with gross mis-estimates of pre- and post-test probabilities.14
With the rising prevalence of electronic medical record data sources, the potential now exists to inform medical decisions with concrete data and high-throughput predictions models.15,16 For example. prior studies have illustrated high accuracy in imputing the value of ferritin laboratory results given all other labs coordered, indicating redundant information.17 Others have reviewed historical data to develop risk scores to estimate the yield of blood cultures. Finding extremes of high (or low) pre-test probabilities of normal laboratory test results reflect low “entropy” (and thus low “information” content) in a diagnostic test.19 These point to opportunities in clinical decision support to systematically identify low yield diagnostics and interventions.20,21
Objective
Here we describe the prevalence of common laboratory tests in a hospital environment and the rate of “normal” results to quantify pre-test probabilities under different conditions. Pre-test probabilities are estimated as a function of repeated testing as well as through a battery of machine learning methods applied to existing electronic medical record data to illustrate the potential for predictable lab results based only on existing data available before the laboratory tests were ever ordered.
Methods
We extracted deidentified patient data from the (Epic) electronic medical record for all inpatient hospitalizations at the Stanford tertiary academic hospital via a clinical data warehouse.22 The structured data covers patient encounters from their initial (emergency room) presentation until hospital discharge. With five years of data spanning 2008-2014, the dataset includes structured data elements (primarily laboratory orders and results in this study) for >71K patients. Numerical lab results were binned into categories based on “abnormal” flags established by the clinical laboratory. We aggregated patient problem list and admission ICD9 diagnosis codes based on the Charlson comorbidity categorizations.23 The study was deemed non-human subjects research by the Stanford IRB.
We restricted ourselves to laboratory diagnostics that the clinical lab pre-specified as “Normal” or “In Range” vs. not (e.g., “Abnormal.” “High,” or “Low”) to use an established reference for binary classification of result values. We reviewed serial normal results within several prior window periods (1, 2, 4, 7, 30, and 90 days) to assess how the normal rate shifts after k consecutive normal results are observed (e.g., daily lab tests). When k is 0, this reflects no previous results (normal or abnormal) exist within the window period. When k is 1, this reflects there is exactly one consecutive prior normal result.
Pseudocode for Counting Consecutive Normal Lab Results:
Initialize counts dictionary to zeros
Initialize queue to empty
For every lab result (chronological order):
Remove all results in the queue outside the current window
If the previous lab result is outside the current window:
k = length of queue
Else:
k = NULL
Increment total count for k
If result is normal:
Add the result to the queue
Increment normal count for k
Else:
Empty the queue
The length of the queue represents how many consecutive normal results fall within the window. Thus, when we see an abnormal result, the queue is cleared. The queue can be empty for two reasons: a) no prior result falls within the window, or b) the prior result is abnormal (but falls within the window). In order to distinguish between the two cases, we check whether the previous lab result falls within the window. In order to align with the definition of k = 0 given earlier, we disregard counts where k equals 0 as given by the pseudocode and instead use the values where k equals NULL.
Note that it is common for clinicians to order “panel” tests with multiple component results. For example, a common order is for a basic metabolic panel (BMP), which yields results for Sodium (Na), Potassium (K), Chloride (Cl), HCO3 (Bicarbonate), Blood Urea Nitrogen (BUN), Creatinine (Cr), Calcium (Ca) and Glucose. Individual results register as normal or abnormal, while the panel test is labeled normal if and only if all component results are normal.
For an example set of common laboratory tests (e.g., TSH=Thyroid Stimulating Hormone, SPLAC=Sepsis Protocol Lactate, FER=Ferritin, NTBNP=N-Terminal pro-Brain Natriuretic Peptide) with single result values (unlike panel tests that rarely have all normal results) we trained machine learning models to predict the binary result of whether a random sampling of orders in 2013 would yield a “normal” result. Data features extracted included:
Patient Age
Gender
Race (White Non-Hispanic-Latino, Asian, Black, Pacific Islander, etc)
Time of Day lab ordered (reflecting daily patterns)
Time of Year lab ordered (reflecting seasonal patterns)
- Presence and time since occurrence of a diagnosis in one of the Charlson comorbidity groups
- (e.g., Moderate-Severe Liver Disease, Rheumatic Disease, Congestive Heart Failure, etc.)
- Presence and time since primary or consulting treatment by hospital specialty teams
- (e.g., Cardiology, Hematology, Oncology, Medical Intensive Care Unit, etc.)
Presence and time since occurrence of the same lab test being predicted, with different window sizes (1 day, 7 days, 30 days, etc.)
- Summary statistics as below during the window period for results of the laboratory test being predicted, vital signs (blood pressure, pulse, respiration rate, temperature, urine output, Glasgow Coma Scale, FiO2) and laboratory result values (white blood cells, hemoglobin, sodium, potassium, bicarbonate, blood urea nitrogen, creatinine, lactate, ESR, CRP, Troponin, blood gases) commonly used in severity of illness prognosis systems.24,25 Missing values were simply imputed with the overall median observed values for each measure, while the “count” feature effectively acts as an indicator variable to reflect the informativeness of certain lab results not being available.
- Count
- Count In Range / Normal
- Min
- Max
- Median
- Mean
- Standard deviation
- First
- Last
- Difference = Last - First
- Slope = Difference / (Last Time - First Time)
For each example lab test evaluated, we randomly split the data into training and test sets, with 80% of the data going to the training set and the remainder being held out for testing. We used several popular machine learning models implemented in the scikit-learn Python library (http://scikit-learn.org). We performed a grid search on various hyperparameters to identify favorable configurations, using area under the receiver operating characteristic curve (ROC AUC) accuracy as an objective function to guide the hyperparameter search. Methods and hyperparameters used include:
- Decision Tree
- Max_depth: Maximum allowed depth of the decision tree
- Random Forest - Ensemble classifier that fits multiple decision trees and averages their results
- N_estimators: Number of decision trees to use in the ensemble
- Max_depth: Maximum allowed depth of any decision tree
- Ada Boost - Ensemble classifier that starts with a base model (Decision Tree) and then fits additional copies of the model to the data, but uses an adaptive learning rate to put emphasis on misclassified examples
- N_estimators: Number of decision trees to use in the ensemble
- Leaming_rate: Multiplier for the contribution of each successive classifier in the ensemble
- Logistic Regression
- C: Inverse of regularization strength (smaller means stronger regularization)
Results
Figure 1a and 1b report the most prevalent lab tests ordered and component results in the hospital along with the rate of “normal = “In Range” values for each, indicating a general pre-test probability. Figure 2 illustrates how this pre-test probability “normal rate” in most cases rapidly converges given a previous consecutive series of normal results for the same test (indicating reducing information value in repeated testing). Table 2 reports the prediction accuracy in terms of ROC AUC (c-statistic) of several machine learning methods for binary classification of “normal” results for example laboratory tests based on patient demographic and derived time series summary features to illustrate the overall discriminatory power and prediction accuracy. Figure 3 “zooms in” on the tail of example cases predicted most likely to yield normal results and the actual normal rate (“precision at K”).
Figure 1a.
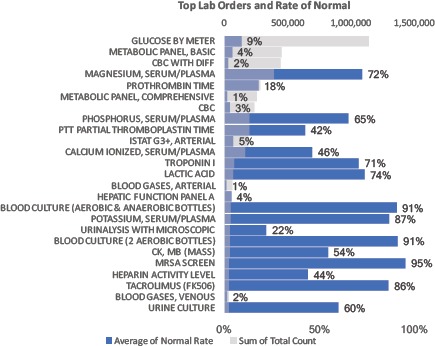
Top 25 most prevalent lab orders 2009-2014. Quantity noted by gray bars. Blue bars and data labels reflect percent of lab orders yielding all “Normal” = “In Range” results. For example, over there were over 1,000,000 orders to check a patient’s Glucose by Meter, with 9% of such test yielding a value in the normal range.
Figure 1b.
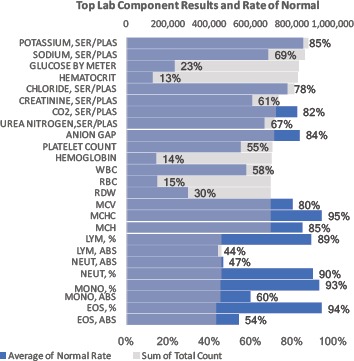
Top 25 most prevalent lab result components 2009-2014. Quantity noted by gray bars. Blue bars and outlying data labels reflect percent of lab results denoted as “Normal” = “In Range” results.
Figure 2.
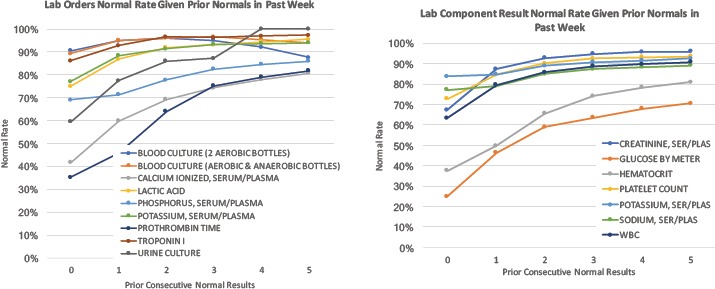
Common laboratory tests and component results with their rate of all “normal” results as a function of consecutive normal results previously observed in the prior week. For example, of all (Ionized) Calcium tests ordered where zero prior results existed in the week prior, just over 40% yielded a result in the normal range. For repeated testing of Ionized Calcium, the prevalence of normal results progressively increases with respect to the number of prior normal results. In this case, Ionized Calcium tests yield ~80% results in the normal range when preceded by 5 consecutively normal results in the past week. WBC:White Blood Cells
Table 2.
Prediction accuracy (ROC AUC) for example lab tests using electronic medical record data to train models by several machine learning methods and range of hyperparameters. The high discrimination power overall illustrates the significant predictive power of existing structured clinical data towards preemptively predicting these example laboratory results.
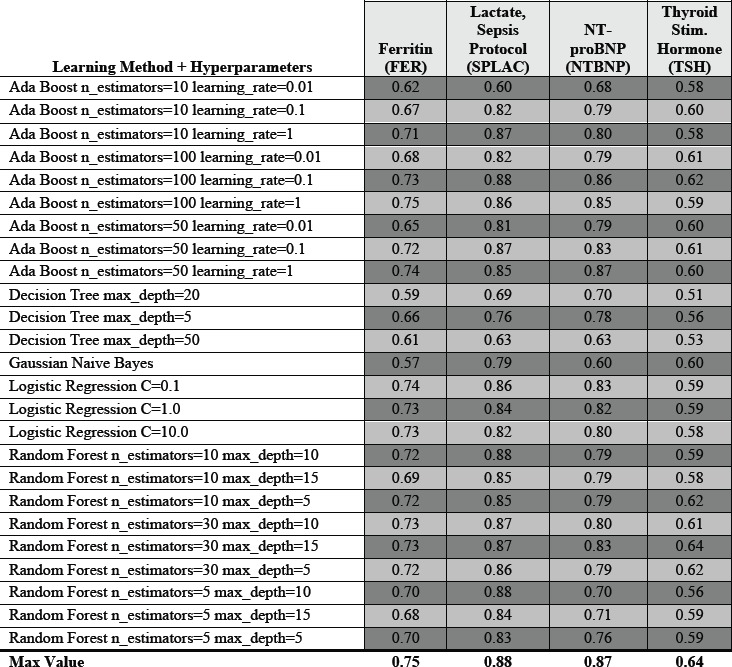
Figure 3.
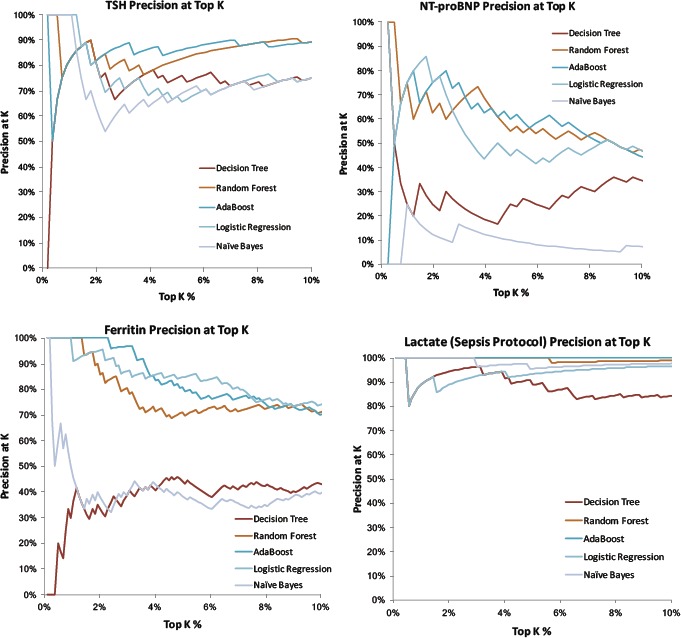
Top 10% tail distribution of several example lab results based on how likely they are to yield “normal” results as predicted by machine learning methods. Curves plot the precision (positive predictive value) = rate of normal lab results when assessing only the top K% of results). For many methods and many labs, the top few percent of lab results are essentially 100% predictable to be normal given existing data. Example hyperparameters illustrated: Decision Tree Max Depth = 20, Random Forest 30 Estimators with Max Depth =5, AdaBoost with 50 Estimators and Learning Rate = 0.1, Logistic Regression with Regularization C = 1.0, and Gaussian Naïve Bayes).
Discussion
Low (information) yield laboratory tests are commonly ordered in the hospital, with Figure 1a highlighting blood cultures with very high (~90%) pre-test probabilities of being normal. Figure 2 and Figure 3 illustrate how pre-test probabilities can be further refined by integrating additional information on prior consecutive results or more complex patterns of clinical data assimilated through machine learning methods. For cases where the pre-test probability of “normal” approaches 50%, this reflects high information entropy where the tests are most valuable to confirm information that is difficult to predict. We focus our attention on the tails of the distribution where test instances have an extremely high (or inversely an extremely low) pre-test probability. Figure 3 in particular illustrates the distribution of predictability for individual laboratory test instances at the extreme ends, where a percentage of cases is essentially 100% predictable to be normal.
Our approach provides a data-driven, systematic method to identify cases where the incremental value of testing is worth reconsidering. The low information entropy in these cases reflects low expected diagnostic value for medical decision making. When the pre-test probability of a diagnostic result is extremely high/low, finding the opposite test result may even reflect incorrect findings (false positive or false negative) rather than a surprising clinical result.14 For example, the ~90% of normal blood cultures does not even include false positive blood cultures growing (skin) contaminant organisms that do not reflect a clinically relevant infection. While this approach systematically identifies possible low yield diagnostic cases for review, it is important to acknowledge that a high pre-test probability of a normal result does not obviate the value of the test. Low information does not entail low importance or low value. A test with 99% pre-test probability of being normal may still be worthwhile if the consequence of missing the 1% event (e.g., a preventable cancer or bacteremia) is itself extreme. In such cases, a more nuanced cost-effectiveness or decision analysis is more appropriate than relying on prediction accuracy alone.
We focus on diagnostic laboratory testing in this work as a well-structured target, though the approach can be expanded to many other application (e.g., predicting low yield imaging tests). This approach can also easily predict which laboratory tests have a high pre-test probability of being abnormal. We do not target these cases however, as there are many contexts where it is clinically important to monitor abnormal lab results (e.g., tracking hemoglobin values in a bleeding patient or creatinine values in a patient recovering from kidney injury). Notably, normal (negative) results are often quite valuable and necessary to trigger subsequent care decisions. For example, confirming negative blood cultures is often a key decision point to guide antibiotic treatment, and our results should not be interpreted as a blanket argument that blood cultures are wasteful tests.
While normal results are often valuable, the more nuanced argument our approach presumes is that confirming a highly predictable “normal” lab result is often a waste. Clinicians, patients, and family members commonly argue that it is worth it “just to document” the normal results to “rule out all possibilities.” While a common rationale is that it “never hurts to have more information” that you might need “just in case,” information theory would explain that there is essentially no information gained from confirming results that are reliably predictable from available data. As a result, common practice may well reflect both an over-estimation of the benefits of lab testing and an under-estimation of the risks (iatrogenic anemia, erroneous or incidental findings leading to further unnecessary work-up, risks of delirium, etc.). Returning to our blood culture example, really we do not care about whether the culture is positive or negative. What we care about is whether the patient has a bloodstream infection. The diagnostic test is imperfectly correlated with the clinical status we actually care about, but provides enough predictive power to satisfy a decision making threshold. If diagnostic tests have imperfect accuracy and “it never hurts to have more information,” arguably we should always order more tests. Indeed we do routinely order blood cultures in sets of 4 bottles at a time (or even 12 bottles for suspected heart infections). We would not continue this indefinitely however, as once we have achieved enough confidence based on available information, further testing is not expected to change our assessment or decision making.
Limitations of this study include its basis at a single medical center. The methods are generalizable, but would be best reproduced with local data if attempting to predict local practice patterns that will constantly evolve.26 To help cope with model overfitting, we evaluated on randomly separated train-test splits of the data and focused on varying select model hyperparameters. With large values of max_depth, the tree models may strongly overfit the training data. With large values of ensemble n_estimators, we can reduce overfitting at a cost to training time. Based on the results analyzed here, the ensemble based AdaBoost and Random Forest approaches tend to yield better laboratory prediction accuracies, but many other learning methods (e.g., LASSO L1 regularization,27 support vector machines, and neural networks) and hyperparameter variants can be surveyed for their efficacy. The ensemble based approaches likely perform better in this problem construction when they can better cope with the many highly correlated or irrelevant feature variables. For example, if only a single prior vital sign reading was available for a prediction, the min, max, mean, and median values will all be identical (let alone correlated). Prior studies on predictions using semi-structured healthcare data have also integrated more sophisticated missing data imputation methods for laboratory values,17 though we focused on summary statistics of the laboratory ordering behavior (e.g., quantity and timing) that are often more predictive of clinical outcomes than the value of the results themselves.28 Future work can explore not just the overall predictive accuracy of these different methods but identify which data features are most informative, with prior work suggesting the “first derivative” of time series data may be more valuable than the primary data.29
We envision implementations where computerized provider order entry (CPOE) systems automatically provide patient-specific pre-test probability estimates whenever a clinician is about to order a diagnostic test. This would be similar to existing frameworks where systems can report the relative cost, turnaround time, and prior result values for diagnostic tests before attempted order entry. 30, 31, 32 Similar to these existing constructs, the clinician remains empowered to make the final decision as to whether the diagnostic test order is appropriate given all contextual information (including patient factors that may not be obvious in the computer record). Explanatory modules for why the system predicts extreme pre-test probabilities can further increase confidence and adoption. Short of such direct implementation, our approach can simply identify the outlier population of low yield diagnostic testing for expert clinician review to confirm or refute appropriateness. If inappropriate use is confirmed, this can lead to different interventions such as targeted education, standardized practice guidelines, and customized best practice alert rules33 (perhaps inspired by the relevant feature set learned from the machine learning algorithms).
While identifying low yield medical care via automated methods is necessary, it is insufficient, to deter ineffective use. Factors that contribute toward unnecessary testing ranges from ease of ordering with panels and electronic order entry, inexperience, fear of litigation and perceived pressure from colleagues and patients.34 Affecting change in clinical practice will require a range of processes. Patient education is necessary to illuminate when “less is more” in healthcare. The respective risks of pressuring providers to administer more diagnostics and treatments is important to clarify, particularly in the context of increasing emphasis on patient satisfaction (scores). Refinement of payment models are necessary to drive incentives for high value care, at both the institutional and provider-specific level. Clinician education remains crucial in the quantitative interpretation of diagnostic performance characteristics, backed by effective decision support. These challenges are significant, but effectively balancing the benefits and risks of diagnostic testing is critical towards simultaneously optimizing the cost, quality, and access in our healthcare system.
Conclusions
Low yield laboratory tests are commonly ordered in the hospital. These can be quantitatively targeted for clinical decision support based on machine learned patterns from readily available structured electronic medical record data.
Table 1a.
Population information for the 71K sampled patients.
| Inpatient Population Information | |
|---|---|
| Total Number of Patients | 71051 |
| Total Number of Hospitalizations | 114296 |
| Age – Mean (Years) | 60.12652 |
| Age – Standard Deviation (Years) | 18.68509 |
| Percentage Female / Male | 51.1 / 48.9 |
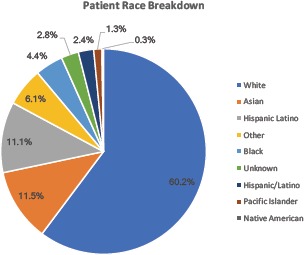
Table 1b.
Breakdown by race of the sampled patients.
Bibliography
- 1.Hackbarth A. D. Eliminating Waste in US Health Care. JAMA. 2012;307:1513. doi: 10.1001/jama.2012.362. [DOI] [PubMed] [Google Scholar]
- 2.Smith M. D., et al. Transformation of Health System Needed to Improve Care and Reduce Costs. Institute of Medicine News. 2012. Available at: http://www8.nationalacademies.org/onpinews/newsitem.aspx?RecordID=13444.
- 3.Colla C. H., Morden N. E., Sequist T. D., Schpero W. L., Rosenthal M. B. Choosing Wisely: Prevalence and Correlates of Low-Value Health Care Services in the United States. J. Gen. Intern. Med. 2014;30:221–228. doi: 10.1007/s11606-014-3070-z. [DOI] [PMC free article] [PubMed] [Google Scholar]
- 4.Zhi M., Ding E. L., Theisen-Toupal J., Whelan J., Arnaout R. The landscape of inappropriate laboratory testing: A 15-year meta-analysis. PLoS One. 2013;8:1–8. doi: 10.1371/journal.pone.0078962. [DOI] [PMC free article] [PubMed] [Google Scholar]
- 5.Konger R. L., et al. Reduction in unnecessary clinical laboratory testing through utilization management at a us government Veterans Affairs hospital. Am. J. Clin. Pathol. 2016;145:355–364. doi: 10.1093/ajcp/aqv092. [DOI] [PubMed] [Google Scholar]
- 6.Yeh D. D. A clinician’s perspective on laboratory utilization management. Clin. Chim. Acta. 2014;427:145–150. doi: 10.1016/j.cca.2013.09.023. [DOI] [PubMed] [Google Scholar]
- 7.Diercks D. B., et al. Incremental value of objective cardiac testing in addition to physician impression and serial contemporary troponin measurements in women. Acad. Emerg. Med. 2013;20:265–270. doi: 10.1111/acem.12092. [DOI] [PMC free article] [PubMed] [Google Scholar]
- 8.Hom J., Smith C. (daisy), Ahuja N., Wintermark M. R-SCAN: Imaging for Low Back Pain. J. Am. Coll. Radiol. 2016;13:1385–1386. doi: 10.1016/j.jacr.2016.06.043. e1. [DOI] [PubMed] [Google Scholar]
- 9.Salisbury A. C., et al. Diagnostic blood loss from phlebotomy and hospital-acquired anemia during acute myocardial infarction. Arch. Intern. Med. 2011;171:1646–1653. doi: 10.1001/archinternmed.2011.361. [DOI] [PubMed] [Google Scholar]
- 10.Levy A. E., Shah N. T., Moriates C., Arora V. M. Fostering value in clinical practice among future physicians: time to consider COST. Acad. Med. 2014;89:1440. doi: 10.1097/ACM.0000000000000496. [DOI] [PubMed] [Google Scholar]
- 11.Moriates C., Soni K., Lai A., Ranji S. The value in the evidence: teaching residents to ‘choose wisely’. JAMA Intern. Med. 2013;173:308–310. doi: 10.1001/jamainternmed.2013.2286. [DOI] [PubMed] [Google Scholar]
- 12.Moriates C., Mourad M., Novelero M., Wachter R. M. Development of a hospital-based program focused on improving healthcare value. J. Hosp. Med. 2014;9:671–677. doi: 10.1002/jhm.2235. [DOI] [PubMed] [Google Scholar]
- 13.Korenstein D. Charting the Route to High-Value Care: The Role of Medical Education. JAMA. 2015;314:2359–2361. doi: 10.1001/jama.2015.15406. [DOI] [PMC free article] [PubMed] [Google Scholar]
- 14.Manrai A. K., Bhatia G., Strymish J., Kohane I. S., Jain S. H. Medicine’s uncomfortable relationship with math: calculating positive predictive value. JAMA Intern. Med. 2014;174:991–993. doi: 10.1001/jamainternmed.2014.1059. [DOI] [PMC free article] [PubMed] [Google Scholar]
- 15.Chen J. H., Podchiyska T., Altman R. B. OrderRex: clinical order decision support and outcome predictions by data-mining electronic medical records. J. Am. Med. Inform. Assoc. 2016;23:339–348. doi: 10.1093/jamia/ocv091. [DOI] [PMC free article] [PubMed] [Google Scholar]
- 16.Chen J. H., Goldstein M. K., Asch S. M., Mackey L., Altman R. B. Predicting inpatient clinical order patterns with probabilistic topic models vs conventional order sets. J. Am. Med. Inform. Assoc. 2016:ocw136. doi: 10.1093/jamia/ocw136. [DOI] [PMC free article] [PubMed] [Google Scholar]
- 17.Luo Y., Szolovits P., Dighe A. S., Baron J. M. Using Machine Learning to Predict Laboratory Test Results. Am. J. Clin. Pathol. 2016;145:778–788. doi: 10.1093/ajcp/aqw064. [DOI] [PubMed] [Google Scholar]
- 18.Shapiro N. I., Wolfe R. E., Wright S. B., Moore R., Bates D. W. Who Needs a Blood Culture? A Prospectively Derived and Validated Prediction Rule. J. Emerg. Med. 2008;35:255–264. doi: 10.1016/j.jemermed.2008.04.001. [DOI] [PubMed] [Google Scholar]
- 19.Mezard M., Montanari A. Information, Physics, and Computation. Oxford University Press; 2009. Introduction to Information Theory. [Google Scholar]
- 20.Kawamoto K., Houlihan C. a., Balas E. A., Lobach D. F. Improving clinical practice using clinical decision support systems: a systematic review of trials to identify features critical to success. BMJ. 2005;330:765. doi: 10.1136/bmj.38398.500764.8F. [DOI] [PMC free article] [PubMed] [Google Scholar]
- 21.Varghese J., Kleine M., Gessner S. I., Sandmann S., Dugas M. Effects of computerized decision support system implementations on patient outcomes in inpatient care: a systematic review. J. Am. Med. Inform. Assoc. 2017 doi: 10.1093/jamia/ocx100. [DOI] [PMC free article] [PubMed] [Google Scholar]
- 22.Lowe H. J., Ferris T. A., Hernandez P. M., Weber S. C. STRIDE--An integrated standards-based translational research informatics platform. AMIA Annu. Symp. Proc. 2009;2009:391–395. [PMC free article] [PubMed] [Google Scholar]
- 23.Quan H., et al. Coding algorithms for defining comorbidities in ICD-9-CM and ICD-10 administrative data. Med. Care. 2005;43:1130–1139. doi: 10.1097/01.mlr.0000182534.19832.83. [DOI] [PubMed] [Google Scholar]
- 24.Lemeshow S., Le Gall J. R. Modeling the severity of illness of ICU patients. A systems update. JAMA. 1994;272:10491055. [PubMed] [Google Scholar]
- 25.Le Gall J.-R., Lemeshow S., Saulnier F. Simplified Acute Physiology Score (SAPS II) Based on a European / North American multicenter study. JAMA. 1993;270:2957–2963. doi: 10.1001/jama.270.24.2957. [DOI] [PubMed] [Google Scholar]
- 26.Chen J. H., Alagappan M., Goldstein M. K., Asch S. M., Altman R. B. Decaying relevance of clinical data towards future decisions in data-driven inpatient clinical order sets. Int. J. Med. Inform. 2017;102:71–79. doi: 10.1016/j.ijmedinf.2017.03.006. [DOI] [PMC free article] [PubMed] [Google Scholar]
- 27.Hastie T., Tibshirani R., Friedman J. The Elements of Statistical Learning. Elements. 2009;1:337–387. [Google Scholar]
- 28.Benik N., et al. Visualizing Healthcare System Dynamics in Biomedical Big Data. AMIA Joint Summits on Translational Science. 2017 [Google Scholar]
- 29.Küffner R., et al. Crowdsourced analysis of clinical trial data to predict amyotrophic lateral sclerosis progression. Nat. Biotechnol. 2015;33:51–57. doi: 10.1038/nbt.3051. [DOI] [PubMed] [Google Scholar]
- 30.Fang D. Z., et al. Cost and turn-around time display decreases inpatient ordering of reference laboratory tests: a time series. BMJ Qual Saf. 2014;23:994–1000. doi: 10.1136/bmjqs-2014-003053. [DOI] [PubMed] [Google Scholar]
- 31.Goetz C., et al. The effect of charge display on cost of care and physician practice behaviors: a systematic review. J. Gen. Intern. Med. 2015;30:835–842. doi: 10.1007/s11606-015-3226-5. [DOI] [PMC free article] [PubMed] [Google Scholar]
- 32.Silvestri M. T., et al. Impact of price display on provider ordering: A systematic review. J. Hosp. Med. 2016;11:65–76. doi: 10.1002/jhm.2500. [DOI] [PubMed] [Google Scholar]
- 33.Luo R. F., et al. Alerting physicians during electronic order entry effectively reduces unnecessary repeat PCR testing for Clostridium difficile. J. Clin. Microbiol. 2013;51:3872–3874. doi: 10.1128/JCM.01724-13. [DOI] [PMC free article] [PubMed] [Google Scholar]
- 34.Hom J., et al. A High Value Care Curriculum for Interns: A Description of Curricular Design, Implementation and Housestaff Feedback. Postgrad. Med. J. 2017 doi: 10.1136/postgradmedj-2016-134617. [DOI] [PubMed] [Google Scholar]


