Abstract
Encoding higher spatial resolution in simultaneous multi-slice (SMS) EPI is highly dependent on gradient performance, high density receiver coil arrays and pulse sequence optimization. We simulate gradient amplitude and slew rate determination of EPI imaging performance in terms of minimum TE, echo spacing (ES) and spatial resolution. We discuss the effects of image zooming in pulse sequences that have been used for sub-millimeter resolutions and the trade-offs in using partial Fourier and parallel imaging to reduce TE, PSF and ES. Using optimizations for SMS EPI pulse sequences with available gradient and receiver hardware, experimental results in ultra-high resolution (UHR) (0.45–0.5mm isotropic) SMS-EPI fMRI and mapping ocular dominance columns (ODC) in human brain at 0.5 mm isotropic resolution are demonstrated. We discuss promising future directions of UHR fMRI.
Introduction
MRI scanners are normally optimized for clinical imaging of the whole body which compromises the scanner performance for neuroscience research, particularly for echo planar imaging (EPI) which is used for functional MRI (fMRI) studies. Several of the scanner hardware sub-systems, specifically the magnetic gradients which encode spatial information and the receiver coil arrays, constrain spatial resolution of EPI imaging pulse sequences which limits the study of columnar and cortical laminar organization of the human brain.
Given human cortex can be less than 2 mm thick (Fischl and Dale, 2000; Hutton et al., 2008) and known columnar sizes range from ~1 mm for ocular dominance columns (ODCs) (Adams et al., 2007) (~0.5 mm in macaques (Horton and Hocking, 1996)) down to 0.6 mm for orientation columns (~.3 mm in macaques (Vanduffel et al., 2002)), the identification of columnar organization in other areas of cortex will all require ultra-high resolution (UHR) imaging on the order of 0.5 mm or higher. While cortical cell layers differ in their width, dividing the total cortex (~2 mm) into 6 depths would require ~0.35 mm isotropic resolution to possibly differentiate layer activity. A somewhat more conservative approach is to divide the cortex thickness into 4 regions, requiring ~0.5 mm spatial resolution. Assumptions of constant cortical volume (Waehnert et al., 2014) may permit delineation of cortical laminae, nevertheless, to date there is no direct validation of neuronal activity in specific laminae corresponding to neurovascular BOLD responses in the same cortical layer.
Several human fMRI studies demonstrated columnar organization with inner volume “zoomed” variants of SE-EPI (Yacoub et al., 2008; Yacoub et al., 2007) and zoomed 3D GRASE (De Martino et al., 2015; Zimmermann et al., 2011) but were limited in spatial volume coverage. Recent development of simultaneous multi-slice (SMS) EPI (Feinberg and Setsompop, 2013) have offered new approaches to obtain fMRI studies with improved volumetric coverage. SMS EPI relies upon the geometry and density of RF receiver arrays for spatial sensitivity, which determines the maximum acceleration factor (SMS) achievable for a given g-factor SNR penalty. Here, we take advantage of the fact that high-density receiver arrays, even with only a few small coil loops for limited acceleration, still give considerable SNR gains in targeted regions of the neocortex to support higher spatial resolution imaging.
The goal of our project in the BRAIN Initiative, (https://www.braininitiative.nih.gov), is to study the human cerebral cortex at the mesoscale which requires ultra-high resolution (UHR) fMRI. In the first part of this paper we examine the relative performance limitations of (and future improvements for) different scanner sub-systems as well as EPI pulse sequence acceleration options to achieve sub-millimeter isotropic resolution fMRI. We consider two aspects of gradient performance which are faster switching of the gradient polarity and the use of higher amplitude gradient pulses which are used together to shorten the readout of the echo train during T2* relaxation. We discuss the dependence and trade-offs in SNR, distortions and point-spread function (PSF) blurring in high resolution imaging when using partial Fourier (pF), SMS, parallel imaging, and reduced field of view techniques or zoomed imaging. In the second part of the paper, we describe our optimization of the current 7 Tesla scanner to perform UHR fMRI for 3D mapping of human ODCs at nominal 0.5 mm isotropic voxel resolution for visualization of columnar neuronal organization at different depths through the cortex.
Theory
Gradient limitations on resolution
To make EPI successful, the fast switching of magnetic field gradients placed a strong demand for gradient hardware development since its earliest days in Nottingham (Mansfield, 1977). With the rapid T2* decay of signal across an EPI echo train, both stronger gradients and faster gradient slew rate are required. More specifically, high resolution EPI imaging places demands on both the maximum gradient amplitudes, GMAX and gradient rise time (TR) and slew rate (SR) where SR = GMAX/TR in units of millitesla/meter/millisecond (mT/m/ms) or equivalently (T/m/s). Figure 1 depicts the read gradient waveform of EPI showing different timing parameters used in our simulations. The time to record each echo, the echo spacing (ES), is equal to the gradient pulse flat top plus its two ramp times: ES = (TFT+2TR). To achieve higher resolution the read gradient must increase in GMAX, SR, or gradient flat top duration, TFT. To shorten the echo train without changing resolution, the GMAX and SR must be increased (Figure 1B).
Figure 1.
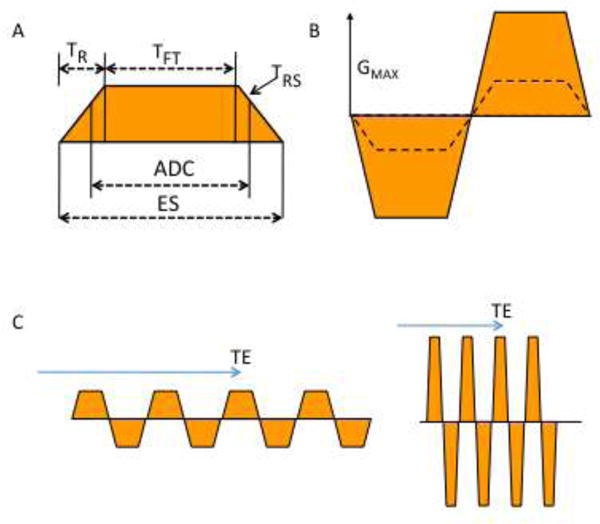
–A) Diagram shows read gradient used in EPI pulse sequence with defined time intervals (T) as follows: signal sampling (ADC), gradient ramp (R), ramp sampling (RS), echo spacing (ES), gradient pulse flat top period (FT), maximum gradient (GMAX)
B) To achieve higher spatial resolution, the pulse sequence uses a stronger gradient GMAX (solid line) with faster gradient switching using a higher slew rate (SR) = GMAX/TR. Comparison is made to a lower SR and lower GMAX (dashed line) or alternatively a longer gradient pulse with larger ES can be used.
C) Pulse sequence diagram of EPI GR read gradient performed at the same spatial resolution (equal gradient moment) using slow-weak gradients (left) and fast-strong gradients (right), the latter having higher GMAX and SR. To shorten the echo train without changing resolution the GMAX and/or SR must be increased without changing the gradient moment (color area) and this shortens the effective TE (arrow).
Faster SR and higher amplitude gradients can be used instead of lengthening the read gradient pulse and dependent ES to minimize T2 decay signal loss and geometric distortions. This also allows for shorter echo time (TE), higher image SNR, and for optimization of BOLD contrast in images (Figure 1C). Gradient performance is limited by the physiological constraint of peripheral nerve stimulation, mechanical and acoustic resonances, and gradient amplifier limitations. In general, the gradient system is an expensive component of the MRI system and its design requires considerations of several issues including heating, stability over long periods of scanning, elimination of eddy currents and linearity of the gradients. Currently the primary limitation on gradient performance is PNS, for which there are established safety guidelines given in different countries for acceptable levels of PNS (International Electrotechnical Commission, 2002; US Food and Drug Administration, 2014). A successful way to reduce PNS is to limit the extent of the gradient coil to only cover the head region and not the thorax, thereby greatly reducing the direct stimulation of the heart that may be located in the maximum gradient field having its polarity switched in time. While commercial clinical MRI scanners have reached for the widest whole body applications, several successful dedicated head gradient systems have been made (Green et al., 2008; Tan et al., 2016; vom Endt et al., 2007) allowing for SR up to 700 T/m/s. A recently developed head only gradient coils performs at 85 mT/m and SR of 700 T/m/s within PNS limits (Lee et al., 2015) whereas whole body gradient coils have reached 80 mT/m at SR of 200 T/m/s.
To illustrate the impact that improvements in gradient performance would have on EPI, we simulate different EPI pulse sequence parameters to reach 0.5 mm isotropic resolution brain imaging varying GMAX and SR to determine the resulting ES. The model equations are given below and the simulation methods are given in the Supplemental material, Appendix 1.
Figure 2A shows simulation plots that demonstrate the different combinations of GMAX and SR to achieve a particular ES for the resolution used in this experiment (additional resolutions are shown in Supplemental Figure S1). The minimum required GMAX and SR for any given ES is the local minimum (lower left bend) in each iso-ES curve, above which a higher GMAX has no effect on reducing ES to reduce the echo train readout time.
Figure 2.
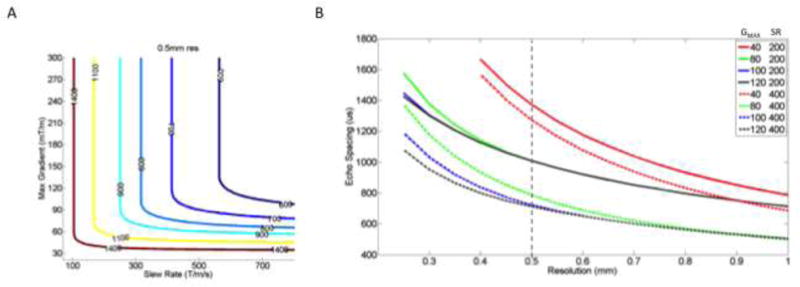
A) Plots of constant ES (color) achieved with different slew rates and maximum gradients. The lower left bend in each curve shows the minimally required Gmax and SR to achieve the ES in EPI at 0.5 mm resolution. Evaluation of curves allows optimization of gradient hardware performance as higher maximum gradients do little to reduce ES without concurrent increases in SR. (Optimization curves for other spatial resolutions are given in Supplemental Figure 1)
B) – The graph shows ES vs resolution using different performance of gradient hardware systems shown in legend (Gmax, SR). Color shows different Gmax. The solid and dashed lines show SR =200 and SR=400 mT/m/ms, respectively. To obtain 0.5 mm resolution with (80,200) performance gradient system requires ES =1100 us whereas (100, 400) performance achieves ES =750us allowing for an earlier effective TE and reduced image distortions. (Supplemental material shows similar plots 0.3 mm and 0.4 mm resolutions)
Figure 2B shows the minimum ES achievable at specified resolutions using different gradient systems, each with specified GMAX, SR. It is apparent that at 0.5 mm resolution ES could be reduced from 1100 to 750 μs using an unchanged 100 mT/m Gmax while increasing the SR from 200 to 400 T/m/s.
The shorter ES reduces T2* signal decay in the echo train which improves SNR in high resolution imaging. The optimal BOLD contrast-to-noise ratio (CNR) is optimal when TE = TEopt, which is a function of gray matter T2* during baseline and activation: , and is below 30 ms at 7T (Peters et al., 2007; Yacoub et al., 2001).
The specified resolution, ES and the number of echoes required can together be used to calculate the minimum effective TE (echo time of ko signal):
where FOVpe is the field of view in the phase encode direction, Respe is the resolution, pF is the partial Fourier factor, and R is the in-plane parallel imaging acceleration factor (aka iPAT or GRAPPA). Additionally, there typically are an initial 3 echoes used for phase correction (3*ES) and TE contribution from the excitation pulse (the second half of a sinc-modulated RF pulse, which can typically vary between 2.5–5 ms).
Figure 3 shows the minimum achievable TE at 0.5 mm resolution using the different gradient performances shown in Figure 2B and the equation above. It is clear that the TE is highly dependent on gradient amplitude and SR. Importantly, parallel imaging with a higher R factor can be chosen to further reduce TE (Additional effects of R and pF factor are shown in Supplemental Figure S2). The shortening of TE improves image SNR, which is determined by several factors:
with g-factor in parallel imaging (g), volume of pixel (V), and number phase encoded signals (Npe). ES ≈ 1/(BW per pixel), and is very dependent on the slew rate and the max gradient strength being used (Figure 2). It’s important to note that while signal to noise is approximately proportional to the square root of ES, increases in ES results in linear increases in TE which is exponentially coupled to SNR. The SMS factor may affect ES but only if the blip pulses between the echoes, used to achieve controlled aliasing in blipped-CAIPI, require a gradient moment that exceeds the maximum blip pulse gradient moment. If there is not enough time for the blipped-CAIPI pulse during the switching period of the read gradient, then there is need for increased pulse duration and concurrent increased ES (independent of BW/pixel) would result. However, most SMS factors and band distances require only minimal extension of the pulse duration (on the order of a couple hundredths of a millisecond).
Figure 3.
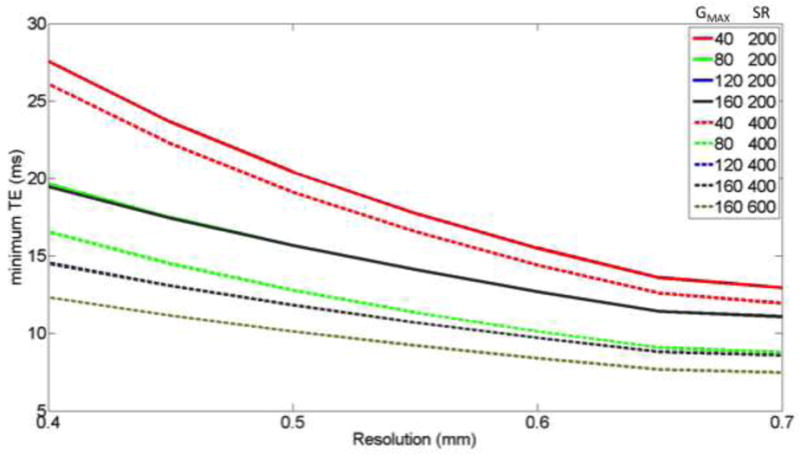
– The effect of resolution on minimum TE with different gradient performances (color) GMAX, slew rate. These TE calculations used partial Fourier 5/8 and R-factor 2 acceleration and imaging parameters described in text. (Supplemental material shows use of other R and pF values.)
Figure 4 shows, for the acquisition parameters used in this study (0.5 mm resolution, FOV = 80 mm, 7 T T2* gray matter = 25 ms), the simulations of PSF on the image phase encode axis which is highly dependent on T2* decay and pF factor. PSF was defined and simulated as in the prior work (Kemper et al., 2015a; Robson et al., 1997) as the anisotropic spread of information in the image stemming from an idealized point source. The full-width at half-maximum (FWHM) was used to calculate the extent of the simulated PSFs which were calculated by taking the magnitude of the Fourier transform of the function reflecting the modulation of k-space data (i.e., truncation associated with the finite nominal image resolution and signal reduction by relaxation weighting at different positions in k-space), whose magnitude is the so-called modulation transfer function (Robson et al., 1997). T2* weighting along an echo-train and truncation of k-space thus impose limits on the effective resolution of the image. To account for partial Fourier acquisitions (Feinberg et al., 1986), the missing k-space lines were zero-filled. Figure 4 top left shows that in general longer ES results in a broader PSF but that this can be significantly mitigated with the use of IPAT. This effect of broadening PSF with ES dominates the broadening effect of pF at low IPAT factors and long ES (e.g. when IPAT= 2 and ES is greater than 1.3ms (PSF=3.5 mm; which reflects the performance of our whole body gradient system together with our 8 channel surface coil array). Future use of head gradients for reduced ES or larger array coils for increased R factor will reduce the PSF of GE EPI to ~1.5 mm.
Figure 4.
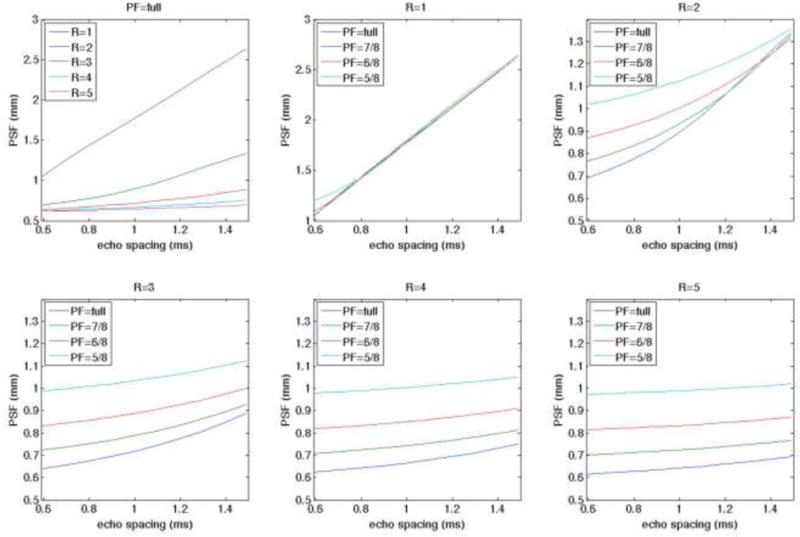
– Simulations of PSF on the image phase axis using different partial Fourier (pF) and in-plane parallel imaging acceleration (R) factor.
Compared to a whole body gradient coil, a head gradient coil does not extend beyond the neck and therefore has the advantage of avoiding cardiac stimulation as well as having more favorable electrical constraints including a reduced inductance in the coil. The head gradient coil thus can be operated at higher GMAX and faster SR. In our simulations we used SR of 200 for typical body gradient coils, SR of 400 for head gradient coils, and SR of 600 for potential future generations of head gradient coils. Simulation plots in Figures 2–3 show how higher GMAX and slew rate are essential in reducing ES.
High Density Receiver Array effects on SNR and Acceleration
As part of our BRAIN Initiative project, we compared the imaging performance of different loop diameters with the goal of maximizing the signal in cortex. The optimization evaluation was conducted utilizing loops of 3 cm–7 cm diameters and by evaluating at different depths, sufficient to cover the cortex. This work is described in detail elsewhere (Beckett et al., 2016; Beckett et al., Under Review). Use of the 4 cm diameter loops resulted in 2–2.5 times higher SNR than with existing commercially available 32 channel whole brain receiver coils. Beginning with the specific neuroscience research goals and then optimizing the receiver system for these purposes leads to considerable potential for improvement in signal quality. However, coil diameter and array density determine the number of receiver channels required cover the whole brain. An array with 4 cm loop diameter coils requires a 128 channel receiver systems to cover the entire brain. In contrast, most commercial systems today are limited to a 32 channel receiver system. Given this, we focus on the visual cortex utilizing SMS EPI with receiver arrays positioned to cover the posterior occipital cortex and perform studies of ocular dominance columns (ODCs) in human brain at 0.5 mm isotropic resolution.
SMS EPI
The SMS EPI pulse sequence is similar to EPI, with multiband excitation RF pulses replacing the conventional sinc RF pulses (Nunes et al., 2006). This places greater constraints on peak RF power, which can be mitigated by lengthening the pulse, optimizing the phases between sub pulses (Auerbach et al., 2013; Wong, 2012) and or using low flip angles (Auerbach et al., 2013; Feinberg et al., 2010; Moeller et al., 2010). A special feature of SMS EPI lies in the fact that spatial information is encoded not only by gradient encoding but also by the distances of signal from receivers in the array. Smaller diameter coils in larger arrays have finer spatial sensitivity and can be used to un-alias more information or more slices.
Rather than perform whole brain imaging at higher speed by reducing TR, we instead pursue optimizing the pulse sequence and receiver array for UHR imaging the neocortex, which is in superficial brain regions closest to the coil array. In this regime, there is considerable advantage in raising SNR with smaller coil loop diameters to support higher spatial resolution (Petridou et al., 2013). Two synergetic advantages in using high density receiver arrays are to raise SNR and to increase spatial sensitivity to better perform parallel imaging for higher IPAT and SMS acceleration. The spatial sensitivity increases by using smaller coils, therefore, the g-factor losses can be reduced in imaging with controlled aliasing blipped-CAIPI in SMS EPI and in general for parallel imaging techniques. A promising improvement of controlled aliasing is the wave-CAIPI that applies oscillating gradients which are highly dependent on SR during the ADC sampling (Bilgic et al., 2015) to distribute the aliased signal more completely in an additional dimensions of k-space for better reduction of g-factor noise. The maximum acceleration is the product of in-plane accelerations (R-factor) X (SMS-factor) and is limited by the total g-factor. Note, an independent advantage of higher density coil arrays may be to use the receiver array for local real-time control of local shimming of Bo to reduce susceptibility dependent signal loss and artifacts in EPI brain imaging (Darnell et al., 2016; Stockmann et al., 2016).
Zoomed Imaging
Whole brain, high-resolution imaging in fMRI requires significant acquisition time (e.g. TR) due to the larger number of slices and the longer time required for each EPI image readout (demanded by larger ES and larger number of echoes). To keep TR to reasonable values for sampling the hemodynamic response function (~2 to 3s) and T2* decay to within a useful range, many neuroscience studies of columns and layers utilize zooming techniques to limit acquisition to a smaller cortical area. Zoomed MR imaging can be accomplished in spin-echo (SE) sequences (SE-EPI and GRASE) with inner volume imaging (IVI) by limiting the signal extent using a volume selective RF pulse that is either perpendicular or oblique to the image plane. Using either an excitation or refocusing pulse, to reduce the signal extent on the phase encoded axis allows for a reduced FOV at higher resolution without aliasing artifact (Feinberg et al., 1985). Inner volume imaging limits slice coverage to a single slice or a single 3D volume, since the perpendicular RF irradiation saturates adjacent slices that would be subsequently excited in multi-slice imaging. Hence the earliest ODC imaging performed with inner volume SE-EPI were limited to a single slice acquisition, requiring recruitment of volunteer subjects possessing relatively flat calcarine sulci (Yacoub et al., 2007). More recently, inner volume single-shot 3D GRASE provided a limited number of 8 –12 slices, allowing more complex gyral topology to be imaged at 0.8 mm isotropic resolution, revealing MT columnar organization (Zimmermann et al., 2011) and tonotopic organization in the auditory cortex (De Martino et al., 2015). Greater slice coverage and improved PSF on the slice axis can be achieved by increasing the number of refocusing RF pulses in a standard variable flip angle scheme (Kemper et al., 2015b) but with lower SNR and increased sensitivity to B1 homogeneity that can limit extent of the image in-plane.
For multi-slice gradient echo (GE) EPI sequences outer volume suppression (OVS) can be used, as it applies the orthogonal RF irradiation adjacent to the image region, outside of the FOV. The OVS repeated application is SAR intensive but the pulse does not directly interfere with the image volume, except due to unavoidable imperfections in the slice profile and magnetization transfer effects (Pfeuffer et al., 2002). Because it is nearly impossible to achieve complete suppression in all outer volume regions structured aliasing artifacts and reduced SNR can result. This has been mitigated by increasing the FOV and using parallel imaging with concurrent lower g-factor (Heidemann et al., 2012).
Current Implementation
In these experiments we used the 8 channel surface array with 4 cm diameter loops (Beckett et al., 2016; Beckett et al., Under Review) to gain higher signal in the cortex and enable higher resolution (0.5 mm nominal isotropic) imaging of columnar BOLD activity. Only a small SMS factor 2 with IPAT factor 2 could be used with this coil. The FOV on the phase axis (80 mm) was sufficient to cover an entire coronal slice through the occipital pole of the brain including the primary visual cortex without OVS or inner volume techniques.
Although head gradients with high GMAX and SR were not available for this study, large reductions in echo train length and TE were realized by limiting the FOV (to 80 mm) and by using partial Fourier factor (pF) and in-plane acceleration. However, there are the , and factor reductions in SNR due to reduced signal averaging. Furthermore, increased R-factor has advantage of reducing “effective” ES and reducing dependent image distortions, but it has an additional g-factor penalty that also reduces SNR depending on the coil geometry and R factor used. Partial Fourier does not reduce effective ES, and the lack of Hermitian symmetry due to phase errors in the gradient echo train and the typical use of zero filling reconstruction causes blurring on the image phase axis. To achieve nominal 0.5 mm isotropic resolution for these experiments, ES is lengthened from a typical 700 μs for 1.0 mm resolution to ES of 1400 μs for 0.5 mm resolution. To counter the dependent TE lengthening, a 5/8 pF factor is used. The alternative approach to reducing TE by using a higher R factor would also reduce PSF blurring, however, our small array coil did not have sufficient spatial sensitivity to support parallel imaging beyond an R-factor of 2. As such, the PSF along the phase encode axis was significant. Based on simulations (Figure 4) the expected PSF is 1.31 mm with IPAT 2, pF 5/8. Future use of larger arrays with small loop diameter would allow for a sharper PSF (e.g. 0.8 mm using IPAT 4 and pF 7/8). For reference, the slice axis in our study had a PSF of 1 mm whereas the frequency axis has minimal broadening with PSF close to 0.5 mm.
Methods
High-resolution fMRI was collected on 7 Tesla human scanners (Siemens) at the Martinos Imaging Center of Massachusetts General Hospital (MGH), and at the Center for Magnetic Resonance Research (CMRR), University of Minnesota. Data was collected on 3 human subjects. All studies were performed after review by that institution’s human research committee and informed consent was obtained from each subject.
Ocular dominance mapping was performed using a stimulus paradigm of colored moving dots in three different colors: red, green and yellow. Using custom anaglyph spectacles (using Kodak Wratten filters No. 25 (red) and 44A (cyan)) these dots stimulated either a single eye or both eyes simultaneously (Nasr et al., 2016) for 24 second blocks. Blank blocks (uniform black screen, 24s) were interspersed amongst the colored dot blocks. Each scan contained 4 blocks of each stimulus condition (left, right, both, blank) and lasted for ~7.5 minutes. Each subject was shown 4–6 scans of ODC mapping stimulus within a session. Subject one was scanned on two separate days.
The fMRI data were collected using an 8-channel prototype coil array with 4cm diameter receive coil loops (Beckett et al., 2016; Beckett et al., Under Review). The gradient set specifications on each of 3 orthogonal axes was Gmax = 70mT/m and SR= 200 mT/m/ms. The effective gradient specifications were set to Gmax = 42mT/m and SR= 190 mT/m/ms by inbuilt scanner software limits, increasing the minimum TE we were able to achieve. Data were collected using simultaneous multi-slice (SMS) EPI (0.5 mm isotopic resolution, SMS Factor 2, iPAT 2, Matrix Size 180×160, 60 slices, 0% distance factor, flip angle 67 deg, partial Fourier 5/8, TR=3000ms, TE=25.2ms, BW=817 Hz/pixel, ES=1.4ms, FOV 90×80, 60 slices). An FOV/3 controlled aliasing was used in a blipped-CAIPI EPI sequence (Setsompop et al., 2012). The imaging coil array was positioned below the head and to minimize motion there were foam cushions placed tightly against the side of the head. Slices were arranged coronally in a manner to minimize aliasing in the phase encode direction, by ensuring that the cortex filled the FOV. Any residual aliasing was into regions where no activity was expected.
To demonstrate the gains in SNR and CNR available with the test coils, 0.5 mm isotropic images were collected in a single subject on the test coil and commercially available 32 channel head coil (Nova Medical Inc.), and 0.45 mm isotropic data were collected on the test coil. For the acquisition of the 0.45 mm isotropic image data, some imaging parameters were changed: BW 758 Hz/Px, 50 slices, ES = 1.58 ms, TE=31ms, RF pulse duration = 6460 us. BOLD activation was measured for a visual localizer paradigm, consisting of a flashing checkerboard pattern alternating with a blank screen (18s on, 18s off, repeated 5 times per scan), using a T-Test.
The majority of ODC data acquisition was performed with slice dithering for enhanced resolution (SLIDER; (Vu et al., 2016; Vu et al., In Press)), in which the slice thickness was doubled to 1 mm, with slices overlapping and interleaved with two sets of acquisition while maintaining the same 0.5 mm slice spacing. The PSF on the slice axis was 1 mm given deblurring was not performed for maximum SNR. This decreased aliasing in high spatial frequencies in the slice direction compared to when using contiguous non-overlapping 1 mm slices, with the benefit of increased SNR relative to 0.5 mm slice thickness, leading to a net gain in sensitivity to ocular dominance columns. Subject One was scanned both with and without SLIDER during a single session, all remaining data acquisition was done with SLIDER.
Ocular dominance was tested on a voxel by voxel basis using a GLM as implemented using the mrTools toolbox for MATLAB (http://www.cns.nyu.edu/heegerlab). Ocular dominance maps were constructed by contrasting the response to the left eye against the response for the right eye and converting to a T-Score. Maps were thresholded using an F-Test for activation by either or both eyes (F, p<0.05, FDR adjustment by adaptive step-up method (Benjamini et al., 2006)). The borders between retinotopically organized visual areas (V1/V2) were identified on polar angle mapping scans (rotating wedge stimuli) either within session, or from a separate retinotopy session. Data for each session were aligned to a whole head T1-weighted MPRAGE collected in a separate session at 3T for that subject (0.8 mm isotopic resolution, Matrix Size 300×320×208, FOV 240×256×166, 0% distance factor, flip angle 8 deg, TR=2400ms, TE=2.22ms), which was used to generate white matter (WM) and gray matter (GM) surfaces using Freesurfer (Dale et al., 1999; Fischl et al., 1999). Flattened representations of the area around the calcarine sulcus were created using the mrFlastMesh algorithm included with the VISTA software package (http://white.stanford.edu/software/). To project the statistical maps (T-Scores) onto the flattened cortical surface, the values were sampled using nearest neighbor interpolation based on the coordinates of the inner (WM/GM) and outer (GM/pial), or at an intermediate cortical depth. Values at a given coordinate (and cortical depth) in the original whole-head anatomic space were then displayed on the flattened patch using the known correspondence between each point of the original inner/upper surface and each point of the flattened surface. Maps covering multiple depths (e.g. GM/WM border to the GM midpoint) could then be created by averaging together the maps created at those depths.
Results
Figure 5 shows fMRI performance (T-Score from a visual activation paradigm) at 0.5 mm isotropic resolution on a commercially available 32-channel coil and the 8 channel 4cm loop coil array, showing overall greater activation using the 4 cm coil compared to the standard 32 channel array. To examine the limits of resolution, BOLD activation was also measured using 0.45 mm isotropic voxels on the 4 cm loop array for the same visual localizer paradigm, repeated a single time, yielding robust activation using only 3 minutes of scan time (Figure 5). The activations shown were well localized to the grey matter (visualized on a T2-weighted anatomical image), in general following the cortical ribbon across visual cortex. This comparison demonstrates the SNR advantages using the 4cm test coils, resulting in CNR gains in a visual activation paradigm.
Figure 5.
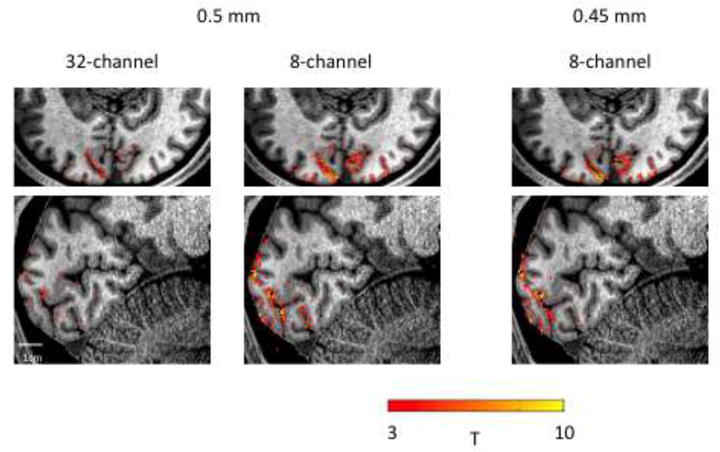
– Comparison of activation from a single visual localizer scan (~3 minutes) at different resolutions (0.5/0.45 mm isotropic) on a commercially available head coil (Nova Medical) and an 8-Channel coil with 4cm loops. Activation maps are overlaid on a high-resolution (0.8 mm isotropic) T1-weighted anatomy to demonstrate how the activations follow the gray-matter ribbon across the cortex.
In comparing 0.5 mm isotropic data with and without slice dithering (Figure 6), the increase in SNR available from increasing the slice thickness (Vu et al., 2016; Vu et al., In Press) can be clearly seen (Top Row). As expected, given that the Nyquist sampling criteria for ODCs is satisfied, the pattern of ODCs on the cortical surface remained consistent with and without SLIDER, indicating that this increase in slice thickness does not obscure the results. The results remained consistent across multiple days of scanning (Figure 7), a key concern for high-resolution imaging, indicating that these results have a consistent biological basis. This consistency allows us to combine data across two days to increase SNR, while still showing the utility data from a single session. Statistical assessment of this reliability was performed using the same method as Nasr et al (2016), wherein the correlation in 10,000 subsamples of the data was compared to a null distribution of correlations using spatially shuffled data, and the between days correlation was significant (p<0.0001). The patterns seen are not the result of slice dithering, as the pattern is also seen (with lower definition) in the isotropic data. Similar patterns, to a lesser extent, were also seen in two additional subjects (Figure 9).
Figure 6.
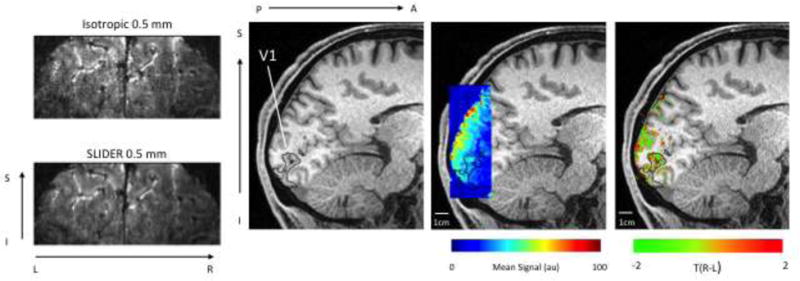
Left: Raw EPI images without and with SLIDER, which increases the SNR in the images, as, can be seen in the anatomic contrast in the image. Center: Mean EPI signal intensity overlaid on T1-weighted anatomical image, showing increase in signal in peripheral cortex from custom coil. Right: ODC maps: Green shows voxels with a preference for left eye stimulation, red shows voxels with a preference for right eye stimulation. Maps are thresholded by activation for either or both eyes (F-test, p<0.05). FDR corrected).
Figure 7.
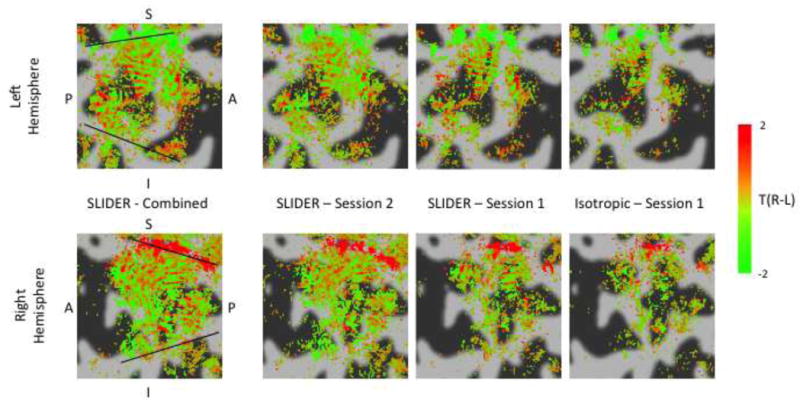
ODC maps for subject 1 (black lines = V1/V2 borders). Green shows voxels with a preference for left eye stimulation, red shows voxels with a preference for right eye stimulation. Maps are thresholded by activation for either or both eyes (F-test, p<0.05). Maps are averaged across 2 surfaces: the WM/GM boundary and the GM midpoint. From left to right: results from high-resolution EPI with SLIDER combined across two sessions, results from high-resolution EPI with SLIDER in induvial scanning sessions (Session 2 & Session 1), results from conventional isotropic high-resolution EPI. ODC like stripe patterns can be seen in both acquisitions, with higher SNR in the maps acquired using SLIDER.
Figure 9.
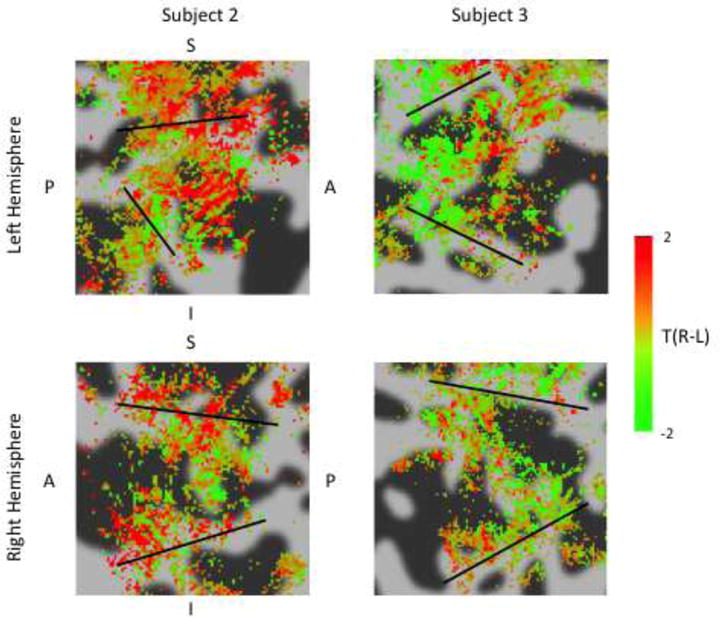
ODC maps for subjects 2 & 3 (black lines = V1/V2 borders). Green shows voxels with a preference for left eye stimulation, red shows voxels with a preference for right eye stimulation. Maps are thresholded by activation for either or both eyes (F-test, p<0.05). Maps are averaged across 2 surfaces: the WM/GM boundary and the GM midpoint. Some ODC like stripe patterns can be seen in both subjects, though results are patchy and less clear than Subject 1.
Although some differential response are seen outside of V1, these are unlikely to be genuine ocular dominance responses as these were not seen in post-mortem staining data (Adams et al., 2007). Previous fMRI studies of ODCs have seen selective responses outside of V1 (Cheng et al., 2001; Nasr et al., 2016), but similar to our results they lack the distinctive alternating stripes selective for one eye versus the other seen in V1. Additional data collection may serve to reduce these noisy responses, or ocular selectivity may in fact exist in some form outside of V1.
Discussion
Earlier fMRI studies of human ODC used 2D rather than 3D volumetric coverage (Cheng et al., 2001; Yacoub et al., 2007) and required subjects with sufficiently flat V1 areas that could be sampled with a single 3 mm thick slice. As such, these studies could not fully examine the structure of ODCs on the cortical surface. More recent work (Nasr et al., 2016) utilized 3D sampling at 1.0 mm (and at 0.8 mm for one subject) isotropic resolution to show the pattern of ODC on the flattened cortical surface, however given that the underlying ODCs are roughly 1.0 mm, sampling at this course (approximately Nyquist) resolution will result in significant partial voluming and aliasing of the true underlying ODC patterns which also impacts cross session reproducibility. Current work expands on this to show reproducible ODC patterns utilizing 0.5 mm resolution to demonstrate the pattern of ODCs at multiple cortical depths. The pattern and spacing qualitatively matches that seen in post-mortem staining experiments (Adams et al., 2007). These results add to the growing array of 3D imaging experiments of columnar architecture (De Martino et al., 2015; Nasr et al., 2016; Zimmermann et al., 2011), and point towards a new direction for fMRI research whereby neuronal circuitry can be studied by differentiating fMRI responses involving different cell populations in different cortical laminae. The ability to resolve 3D depth in the cortex may help reveal the involvement of long range and local circuitry during neuronal processes, given our expanding knowledge of cell populations in different cortical layers. Also, this isotropic 3D coverage enables analysis of the data on the extracted and flattened cortical surfaces. This has the potential for future in depth analysis of neural architecture utilizing these methods, for example looking at functional differences between layers within individual columns, at higher resolutions than currently readily available.
One puzzling feature of this subjects ocular dominance maps is the large area selective for one eye at the dorsal V1/V2 border (Figure 7). This is seen in both hemispheres (for two different eyes), and is reliable across days and sequence types. Such a feature of ocular dominance maps is not expected from known physiology (Adams et al., 2007), and may be draining veins with a bias for one eye over the other as previously seen in optical imaging studies (Lu et al., 2010), or a possible shift in fixation between the two stimulus conditions leading to a retinotopic shift in the activation for either eye. It could also be related to the larger responses to contra-lateral eye stimulation, or more local biases for either eye, seen in previous studies of ocular dominance (Shmuel et al., 2010). However, none of these effects would explain the alternating bands of eye preference seen in V1, which we attribute to ODCs.
Sampling with high nominally isotropic resolution allowed us to examine the effect of cortical depth on the ODC patterns (Figure 8). At the most superficial layer (the GM/CSF boundary), the pattern is partially obscured, most likely due to the effect of pial veins. At the deepest layer (WM/GM) there also seems to be some obscuration of the pattern, although this is unlikely to be the influence of pial veins. Some potential sources of this are distortions in the EPI leading to partial volumes effects at the WM/GM border. The use of higher in-plane acceleration (limited to IPAT factor 2 in the 8-channel test coils), post-hoc distortion correction techniques, or using surfaces generated from T1-weighted EPI could ameliorate this effect in future acquisitions. Averaging across surfaces at different depths (Middle and Bottom rows) increases the extent of the ocular dominance maps seen, at the cost of some loss of definition and blurring.
Figure 8.
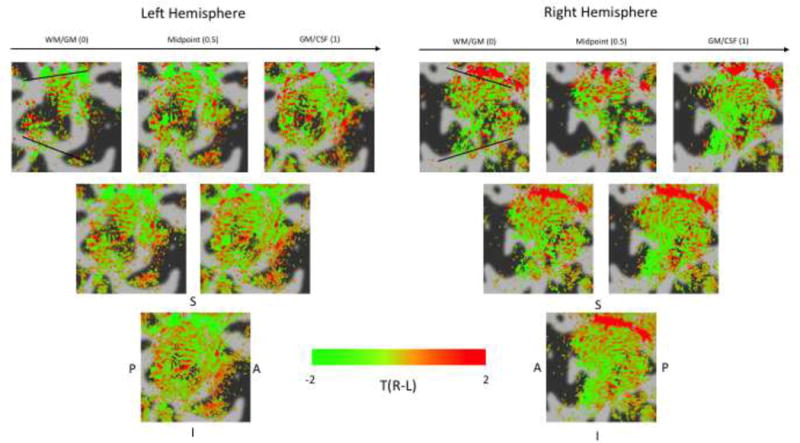
ODC maps for subject 1, right and left hemisphere visual cortex (black lines = V1/V2 borders). Same configuration as Figure 6. Top row shows results from five evenly spaced surfaces, rows below this show results from averaging surfaces together. Evidence of ODC like stripe patterns can be seen at certain cortical depths.
The fact that we could obtain ODC-like patterns in as few as four scans (28 minutes total scan time) (Figure 7) indicates that our methods are promising for robust, reliable imaging of mesoscale neural architecture. Results were variable from subject to subject (Figure 9), with the latter two subjects showing intermittent patches of preference for either eye, without the more diffuse patterns of stripes seen in the first subject. Activation overall was lower (fewer voxels passing the threshold for activation in the F-Test), pointing to a likely reduction in subjects’ general alertness throughout the scans which likely accounts for the compromised mapping. While we cannot entirely exclude head motion as a contributing problem, an additional issue was the limited field of view (FOV) of this prototype coil array causing the largest gains in signal to be outside of the region of interest (V1) (Figure 6), reducing SNR in V1. To mitigate the limited FOV, we are currently developing a 48 channel array with the same high-density of coil loops, which will allow larger cortical areas to be imaged.
Ultimately a revision of the scanner sub-systems with up to 128 receiver channels to support 4 cm diameter coils covering the entire brain and improved gradient performance with higher GMAX and SR will provide more optimal brain coverage with even higher spatial resolution. The use of such high density coil arrays will have synergetic benefits, increasing both R and SMS factors and obtaining more signal in the neocortex. Higher performance gradient systems with higher GMAX and SR will impact achieving optimal TE and reduce image distortions and higher SR will also enable wave-CAIPI to potentially reduce g-factor noise in very accelerated SMS EPI. A next generation UHR human brain scanner optimized with these improvements is estimated to achieve 300–400 μm isotropic resolution in whole brain fMRI in the TR range of 4–3 second. These achievable improvements in UHR imaging create a promising future for fMRI of cortical layers and columns as well as brain structural imaging and will allow exciting evaluations of neuronal circuitry and new medical discoveries in the human brain.
Supplementary Material
Highlights of this manuscript.
To achieve unprecedented high-resolution fMRI of human brain at 7 Tesla:
We simulated the impact of magnetic gradient performance and image acquisition parameters (partial Fourier, parallel imaging, TE, echo spacing).
We demonstrated 0.45–0.5 mm isotropic fMRI with simultaneous multi-slice (SMS) EPI.
We demonstrated ocular dominance columns (ODCs) in 3D imaging through cortex depth.
Acknowledgments
This research was supported by NIH Brain Initiative 1R24MH106096-03, R01MH111444 and NIH 1R44 NS073417.
The authors wish to thank Dr. Liyong Chen for providing the graphs of gradient simulations and to thank Drs. Jon Polimeni and Kawin Setsompop for their assistance using the MGH 7T scanner.
Footnotes
Publisher's Disclaimer: This is a PDF file of an unedited manuscript that has been accepted for publication. As a service to our customers we are providing this early version of the manuscript. The manuscript will undergo copyediting, typesetting, and review of the resulting proof before it is published in its final citable form. Please note that during the production process errors may be discovered which could affect the content, and all legal disclaimers that apply to the journal pertain.
References
- Adams D, Sincich L, Horton J. Complete pattern of ocular dominance columns in human primary visual cortex. The Journal of Neuroscience. 2007;27:10391–10403. doi: 10.1523/JNEUROSCI.2923-07.2007. [DOI] [PMC free article] [PubMed] [Google Scholar]
- Auerbach EJ, Xu J, Yacoub E, Moeller S, Uğurbil K. Multiband accelerated spin-echo echo planar imaging with reduced peak RF power using time-shifted RF pulses. Magnetic Resonance in Medicine. 2013;69:1261–1267. doi: 10.1002/mrm.24719. [DOI] [PMC free article] [PubMed] [Google Scholar]
- Beckett AJ, Vu AT, Keil B, Setsompop K, Wald LL, Schillak S, Feinberg DA. Assessment of coil arrays with small loop diameter at 7T for micron-scale resolution fMRI of human neocortex. ISMRM; Singapore: 2016. [Google Scholar]
- Beckett AJ, Vu AT, Schillak S, Feinberg DA. Under Review. Optimization of receiver array coils for 7T high-resolution imaging of human cerebral cortex [Google Scholar]
- Benjamini Y, Krieger AM, Yekutieli D. Adaptive linear step-up procedures that control the false discovery rate. Biometrika. 2006:491–507. [Google Scholar]
- Bilgic B, Gagoski BA, Cauley SF, Fan AP, Polimeni JR, Grant PE, Wald LL, Setsompop K. Wave-CAIPI for highly accelerated 3D imaging. Magnetic Resonance in Medicine. 2015;73:2152–2162. doi: 10.1002/mrm.25347. [DOI] [PMC free article] [PubMed] [Google Scholar]
- Cheng K, Waggoner R, Tanaka K. Human ocular dominance columns as revealed by high-field functional magnetic resonance imaging. Neuron. 2001;32:359–374. doi: 10.1016/s0896-6273(01)00477-9. [DOI] [PubMed] [Google Scholar]
- Dale A, Fischl B, Sereno M. Cortical Surface-Based Analysis* 1∷ I. Segmentation and Surface Reconstruction. NeuroImage. 1999;9:179–194. doi: 10.1006/nimg.1998.0395. [DOI] [PubMed] [Google Scholar]
- Darnell D, Truong TK, Song AW. Integrated parallel reception, excitation, and shimming (iPRES) with multiple shim loops per radio-frequency coil element for improved B0 shimming. Magnetic Resonance in Medicine. 2016 doi: 10.1002/mrm.26267. [DOI] [PMC free article] [PubMed] [Google Scholar]
- De Martino F, Moerel M, Ugurbil K, Goebel R, Yacoub E, Formisano E. Frequency preference and attention effects across cortical depths in the human primary auditory cortex. Proceedings of the National Academy of Sciences. 2015;112:16036–16041. doi: 10.1073/pnas.1507552112. [DOI] [PMC free article] [PubMed] [Google Scholar]
- Feinberg D, Hoenninger J, Crooks L, Kaufman L, Watts J, Arakawa M. Inner volume MR imaging: technical concepts and their application. Radiology. 1985;156:743–747. doi: 10.1148/radiology.156.3.4023236. [DOI] [PubMed] [Google Scholar]
- Feinberg D, Moeller S, Smith S, Auerbach E, Ramanna S, Glasser M, Miller K, Ugurbil K, Yacoub E. Multiplexed echo planar imaging for sub-second whole brain FMRI and fast diffusion imaging. PLoS One. 2010;5:e15710. doi: 10.1371/journal.pone.0015710. [DOI] [PMC free article] [PubMed] [Google Scholar]
- Feinberg DA, Hale JD, Watts JC, Kaufman L, Mark A. Halving MR imaging time by conjugation: demonstration at 3.5 kG. Radiology. 1986;161:527–531. doi: 10.1148/radiology.161.2.3763926. [DOI] [PubMed] [Google Scholar]
- Feinberg DA, Setsompop K. Ultra-fast MRI of the human brain with simultaneous multi-slice imaging. Journal of Magnetic Resonance. 2013;229:90–100. doi: 10.1016/j.jmr.2013.02.002. [DOI] [PMC free article] [PubMed] [Google Scholar]
- Fischl B, Dale AM. Measuring the thickness of the human cerebral cortex from magnetic resonance images. Proceedings of the National Academy of Sciences. 2000;97:11050–11055. doi: 10.1073/pnas.200033797. [DOI] [PMC free article] [PubMed] [Google Scholar]
- Fischl B, Sereno M, Dale A. Cortical Surface-Based Analysis* 1:: II: Inflation, Flattening, and a Surface-Based Coordinate System. NeuroImage. 1999;9:195–207. doi: 10.1006/nimg.1998.0396. [DOI] [PubMed] [Google Scholar]
- Green D, Pittard S, de Graaf R, Nixon T, Hetherington H. Asymmetric head gradient coil for imaging and spectroscopy at 7T Proc 16 th Annual Meeting. ISMRM; Toronto: 2008. [Google Scholar]
- Heidemann RM, Ivanov D, Trampel R, Fasano F, Meyer H, Pfeuffer J, Turner R. Isotropic submillimeter fMRI in the human brain at 7 T: Combining reduced field-of-view imaging and partially parallel acquisitions. Magnetic Resonance in Medicine. 2012;68:1506–1516. doi: 10.1002/mrm.24156. [DOI] [PubMed] [Google Scholar]
- Horton JC, Hocking DR. Intrinsic variability of ocular dominance column periodicity in normal macaque monkeys. The Journal of Neuroscience. 1996;16:7228–7339. doi: 10.1523/JNEUROSCI.16-22-07228.1996. [DOI] [PMC free article] [PubMed] [Google Scholar]
- Hutton C, De Vita E, Ashburner J, Deichmann R, Turner R. Voxel-based cortical thickness measurements in MRI. NeuroImage. 2008;40:1701–1710. doi: 10.1016/j.neuroimage.2008.01.027. [DOI] [PMC free article] [PubMed] [Google Scholar]
- International Electrotechnical Commission. Medical electrical equipment-Part 2-33: Particular requirements for the safety of magnetic resonance equipment for medical diagnosis. International Electrotechnical Commission; 2002. [Google Scholar]
- Kemper VG, De Martino F, Vu AT, Poser BA, Feinberg DA, Goebel R, Yacoub E. Sub-millimeter T2 weighted fMRI at 7 T: comparison of 3D-GRASE and 2D SE-EPI. Frontiers in neuroscience. 2015a;9 doi: 10.3389/fnins.2015.00163. [DOI] [PMC free article] [PubMed] [Google Scholar]
- Kemper VG, De Martino F, Yacoub E, Goebel R. Variable flip angle 3D-GRASE for high resolution fMRI at 7 tesla. Magnetic Resonance in Medicine. 2015b doi: 10.1002/mrm.25979. [DOI] [PMC free article] [PubMed] [Google Scholar]
- Lee SK, Mathieu JB, Graziani D, Piel J, Budesheim E, Fiveland E, Hardy CJ, Tan ET, Amm B, Foo TKF. Peripheral nerve stimulation characteristics of an asymmetric head-only gradient coil compatible with a high-channel-count receiver array. Magnetic Resonance in Medicine. 2015 doi: 10.1002/mrm.26044. [DOI] [PMC free article] [PubMed] [Google Scholar]
- Lu H, Chen G, Tanigawa H, Roe A. A Motion Direction Map in Macaque V2. Neuron. 2010;68:1002–1013. doi: 10.1016/j.neuron.2010.11.020. [DOI] [PMC free article] [PubMed] [Google Scholar]
- Mansfield P. Multi-planar image formation using NMR spin echoes. Journal of Physics C Solid State Physics. 1977;10:L55–L58. [Google Scholar]
- Moeller S, Yacoub E, Olman CA, Auerbach E, Strupp J, Harel N, Uğurbil K. Multiband multislice GE-EPI at 7 tesla, with 16-fold acceleration using partial parallel imaging with application to high spatial and temporal whole-brain fMRI. Magnetic Resonance in Medicine. 2010;63:1144–1153. doi: 10.1002/mrm.22361. [DOI] [PMC free article] [PubMed] [Google Scholar]
- Nasr S, Polimeni JR, Tootell RB. Interdigitated color-and disparity-selective columns within human visual cortical areas V2 and V3. The Journal of Neuroscience. 2016;36:1841–1857. doi: 10.1523/JNEUROSCI.3518-15.2016. [DOI] [PMC free article] [PubMed] [Google Scholar]
- Nunes R, Hajnal J, Golay X, Larkman D. Simultaneous slice excitation and reconstruction for single shot EPI; Proceedings of the 14th annual meeting of ISMRM; Washington, USA: Seattle; 2006. p. 293. [Google Scholar]
- Peters AM, Brookes MJ, Hoogenraad FG, Gowland PA, Francis ST, Morris PG, Bowtell R. T 2* measurements in human brain at 1.5, 3 and 7 T. Magnetic resonance imaging. 2007;25:748–753. doi: 10.1016/j.mri.2007.02.014. [DOI] [PubMed] [Google Scholar]
- Petridou N, Italiaander M, Bank B, Siero J, Luijten P, Klomp D. Pushing the limits of high-resolution functional MRI using a simple high-density multi-element coil design. NMR in Biomedicine. 2013;26:65–73. doi: 10.1002/nbm.2820. [DOI] [PubMed] [Google Scholar]
- Pfeuffer J, van de Moortele PF, Yacoub E, Shmuel A, Adriany G, Andersen P, Merkle H, Garwood M, Ugurbil K, Hu X. Zoomed Functional Imaging in the Human Brain at 7 Tesla with Simultaneous High Spatial and High Temporal Resolution. NeuroImage. 2002;17:272–286. doi: 10.1006/nimg.2002.1103. [DOI] [PubMed] [Google Scholar]
- Robson MD, Gore JC, Constable RT. Measurement of the point spread function in MRI using constant time imaging. Magnetic Resonance in Medicine. 1997;38:733–740. doi: 10.1002/mrm.1910380509. [DOI] [PubMed] [Google Scholar]
- Setsompop K, Gagoski BA, Polimeni JR, Witzel T, Wedeen VJ, Wald LL. Blipped-controlled aliasing in parallel imaging for simultaneous multislice echo planar imaging with reduced g-factor penalty. Magnetic Resonance in Medicine. 2012;67:1210–1224. doi: 10.1002/mrm.23097. [DOI] [PMC free article] [PubMed] [Google Scholar]
- Shmuel A, Chaimow D, Raddatz G, Ugurbil K, Yacoub E. Mechanisms underlying decoding at 7 T: Ocular dominance columns, broad structures, and macroscopic blood vessels in V1 convey information on the stimulated eye. NeuroImage. 2010;49:1957–1964. doi: 10.1016/j.neuroimage.2009.08.040. [DOI] [PMC free article] [PubMed] [Google Scholar]
- Stockmann JP, Witzel T, Keil B, Polimeni JR, Mareyam A, LaPierre C, Setsompop K, Wald LL. A 32-channel combined RF and B0 shim array for 3T brain imaging. Magnetic Resonance in Medicine. 2016;75:441–451. doi: 10.1002/mrm.25587. [DOI] [PMC free article] [PubMed] [Google Scholar]
- Tan ET, Lee SK, Weavers PT, Graziani D, Piel JE, Shu Y, Huston J, Bernstein MA, Foo TK. High slew-rate head-only gradient for improving distortion in echo planar imaging: Preliminary experience. Journal of Magnetic Resonance Imaging. 2016 doi: 10.1002/jmri.25210. [DOI] [PMC free article] [PubMed] [Google Scholar]
- US Food and Drug Administration. Criteria for significant risk investigations of magnetic resonance diagnostic devices-guidance for industry and food and drug administration staff. Silver Spring, MD: US Food and Drug Administration; p. 2014. [Google Scholar]
- Vanduffel W, Tootell RB, Schoups AA, Orban GA. The organization of orientation selectivity throughout macaque visual cortex. Cerebral Cortex. 2002;12:647–662. doi: 10.1093/cercor/12.6.647. [DOI] [PubMed] [Google Scholar]
- vom Endt A, Riegler J, Eberlein E, Schmitt F, Dorbert U, Krüger G, Gruetter R. A high-performance head gradient coil for 7T systems. Proc Intl Soc magn Reson Med. 2007:451. [Google Scholar]
- Vu A, Beckett A, Setsompop K, Feinberg D. Evaluation of SLIce Dithered Enhanced Resolution Simultaneous MultiSlice (SLIDER-SMS) for human fMRI at 3T. ISMRM; Singapore: 2016. [DOI] [PMC free article] [PubMed] [Google Scholar]
- Vu AT, Beckett AJ, Setsompop K, Feinberg DA. Evaluation of SLIce Dithered Enhanced Resolution Simultaneous MultiSlice (SLIDER-SMS) for human fMRI. NeuroImage. doi: 10.1016/j.neuroimage.2017.02.001. In Press. [DOI] [PMC free article] [PubMed] [Google Scholar]
- Waehnert M, Dinse J, Weiss M, Streicher M, Waehnert P, Geyer S, Turner R, Bazin PL. Anatomically motivated modeling of cortical laminae. NeuroImage. 2014;93:210–220. doi: 10.1016/j.neuroimage.2013.03.078. [DOI] [PubMed] [Google Scholar]
- Wong E. Optimized phase schedules for minimizing peak RF power in simultaneous multi-slice RF excitation pulses. ISMRM; Melbourne, Australia: 2012. p. 2209. [Google Scholar]
- Yacoub E, Harel N, Ugurbil K. High-field fMRI unveils orientation columns in humans. Proceedings of the National Academy of Sciences. 2008;105:10607–10612. doi: 10.1073/pnas.0804110105. [DOI] [PMC free article] [PubMed] [Google Scholar]
- Yacoub E, Shmuel A, Logothetis N, Ugurbil K. Robust detection of ocular dominance columns in humans using Hahn Spin Echo BOLD functional MRI at 7 Tesla. NeuroImage. 2007;37:1161–1177. doi: 10.1016/j.neuroimage.2007.05.020. [DOI] [PMC free article] [PubMed] [Google Scholar]
- Yacoub E, Shmuel A, Pfeuffer J, Van De Moortele P, Adriany G, Andersen P, Vaughan J, Merkle H, Ugurbil K, Hu X. Imaging brain function in humans at 7 Tesla. Magnetic Resonance in Medicine. 2001;45:588–594. doi: 10.1002/mrm.1080. [DOI] [PubMed] [Google Scholar]
- Zimmermann J, Goebel R, De Martino F, van de Moortele PF, Feinberg D, Adriany G, Chaimow D, Shmuel A, Uğurbil K, Yacoub E. Mapping the organization of axis of motion selective features in human area MT using high-field fMRI. PLoS One. 2011;6:e28716. doi: 10.1371/journal.pone.0028716. [DOI] [PMC free article] [PubMed] [Google Scholar]
Associated Data
This section collects any data citations, data availability statements, or supplementary materials included in this article.


