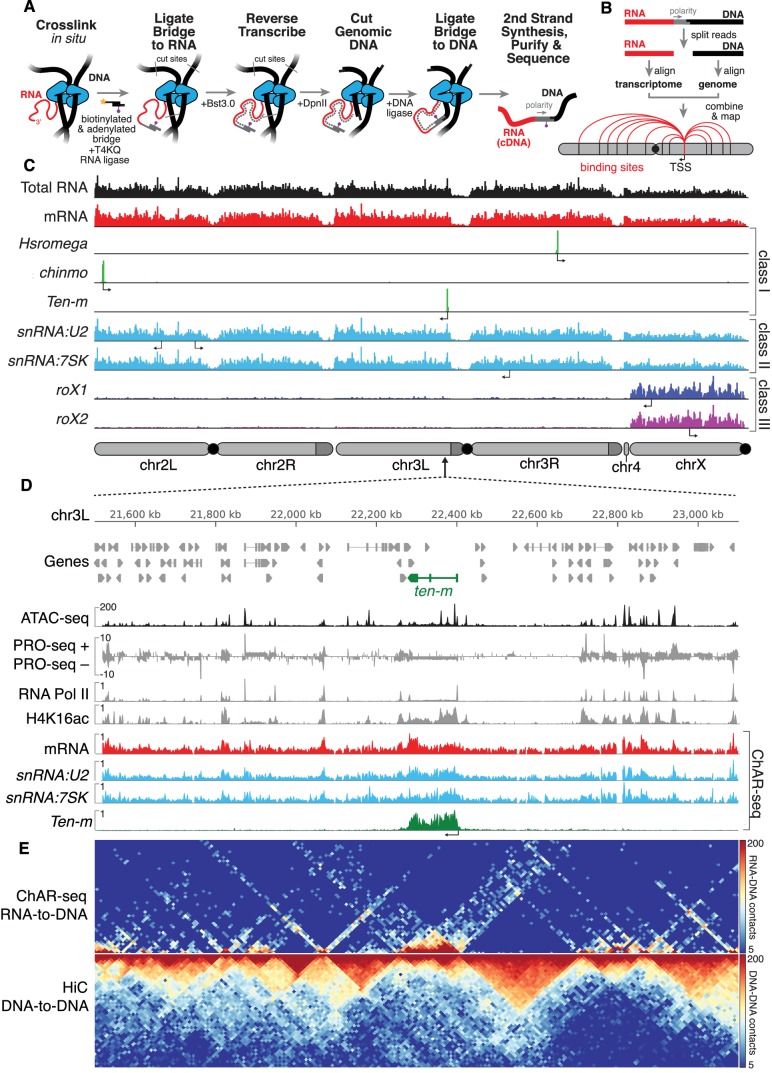
Figure 1. ChAR-seq uses proximity ligation of chromatin-associated RNA and deep sequencing to map RNA-DNA contacts in situ.
(A) Overview of the ChAR-seq method wherein RNA-DNA contacts are preserved by crosslinking, followed by in situ ligation of the 3’ end of RNAs to the adenylated 5’ end of the ssDNA tail of an oligonucleotide ‘bridge’ containing a biotin modification and a DpnII-complementary overhang on the opposite end. After extending the bridge by reverse transcription to generate a strand of cDNA complementary to the RNA, the genomic DNA is then digested with DpnII and then re-ligated, capturing proximally-associated bridge molecules and RNA. The chimeric molecules are reverse-transcribed, purified and sequenced. (B) Chimeric molecules are sequenced and the RNA and DNA ends are distinguished owing to the polarity of the bridge, which preferentially ligates to RNA via the 5'-adenylated tail and to DNA via the DpnII overhang. The RNA and DNA reads are then computationally recombined to produce contact maps for each annotated RNA in the genome. (C) Representative examples of genome-wide RNA coverage plots generated for Total RNA (black), mRNA (red), Hsromega (green), chinmo (green), ten-m (green), snRNA:U2 (cyan), snRNA:7SK (cyan), rox1 (blue) and roX2 (purple). Arrows show the transcription start site for each gene. In chromosome cartoons throughout the paper, light gray represents the primary chromosome scaffolds, darker gray regions are heterochromatic scaffolds, and black circles are centromeres. (D) Zoomed in region for an 850 kilobase region of chromosome 3L (chr3L). ChAR-seq tracks for Total RNA, ten-m, snRNA:U2, and snRNA:7SK are shown in comparison with PRO-seq tracks (Drosophila S2 [Kwak et al., 2013]) and ATAC-seq (this study, CME-W1-cl8+). (E) ChAR-seq contact matrix (RNA-to-RNA, top) plotted and aligned with same 850 kb region as panel D. ChAR-seq was performed without bridge addition (Hi-C/Mock-ChAR), resulting in DNA-DNA proximity ligation as in Hi-C (‘Hi-C, DNA-to-DNA’, bottom).
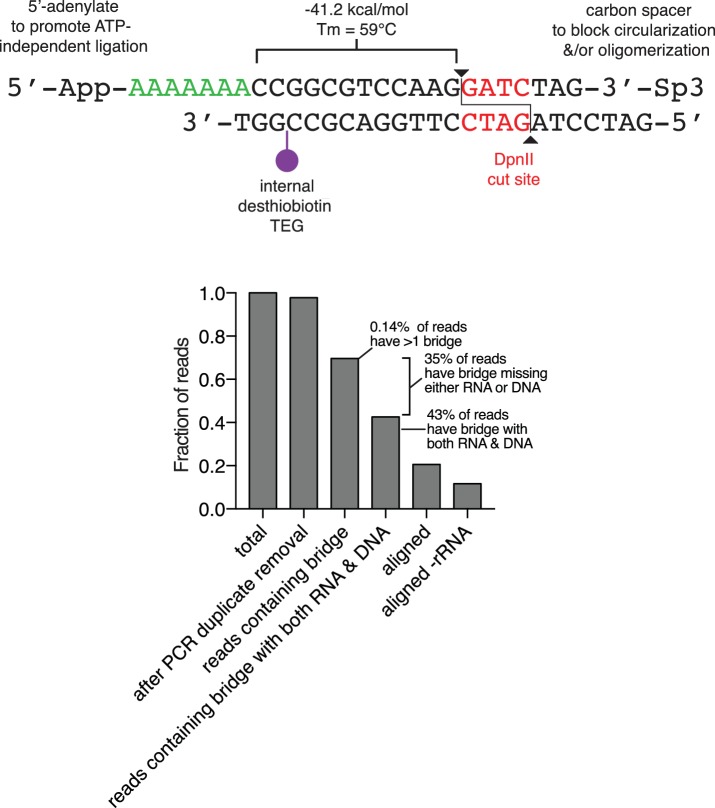
Figure 1—figure supplement 1. Diagram of the oligonucleotide bridge and efficiency of bridge ligation and capture.
Figure 1—figure supplement 2. In vitro optimization of RNA-to-DNA ligation conditions.
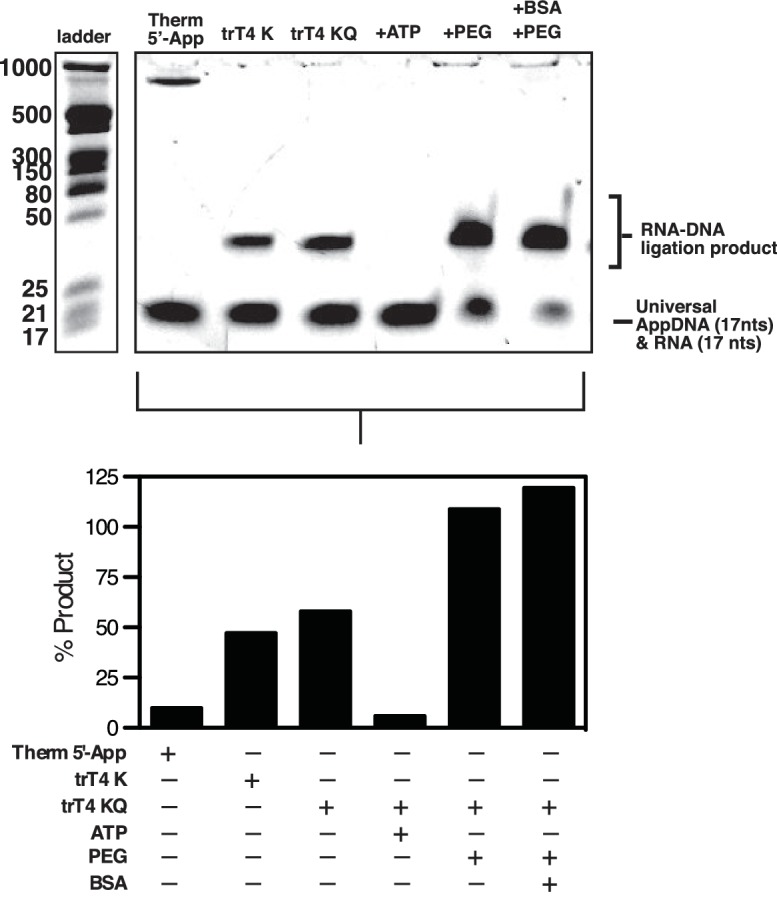
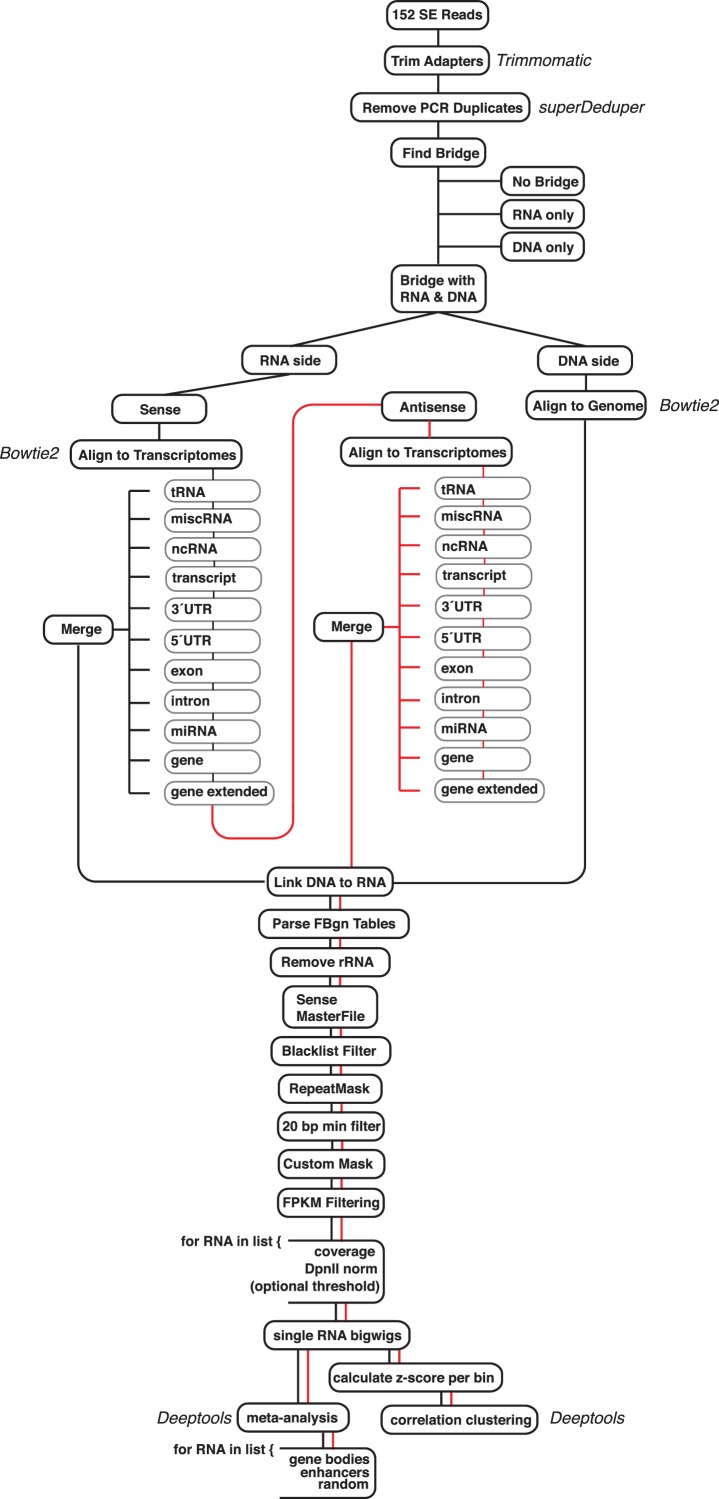
Figure 1—figure supplement 3. Diagram of the ChAR-seq data processing pipeline and bar plot of RNA alignment.
Figure 1—figure supplement 4. ChAR-seq RNA-to-bridge ligation is sensitive to RNase treatment.
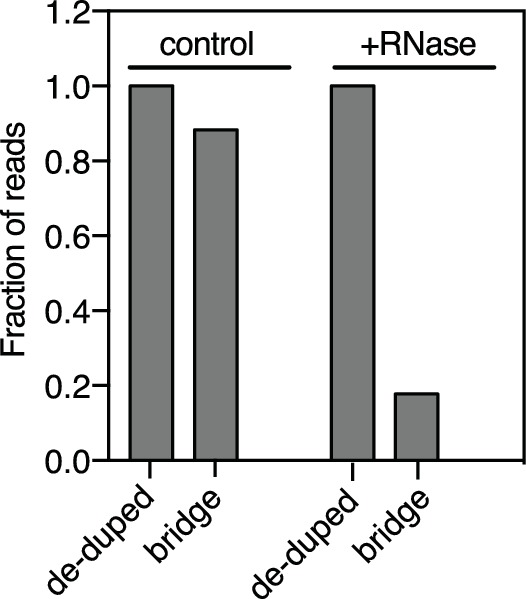
Figure 1—figure supplement 5. Comparison of RNA-to-DNA contacts between replicates.

Figure 1—figure supplement 6. False positive contacts are proportional to RNA spike-in level.
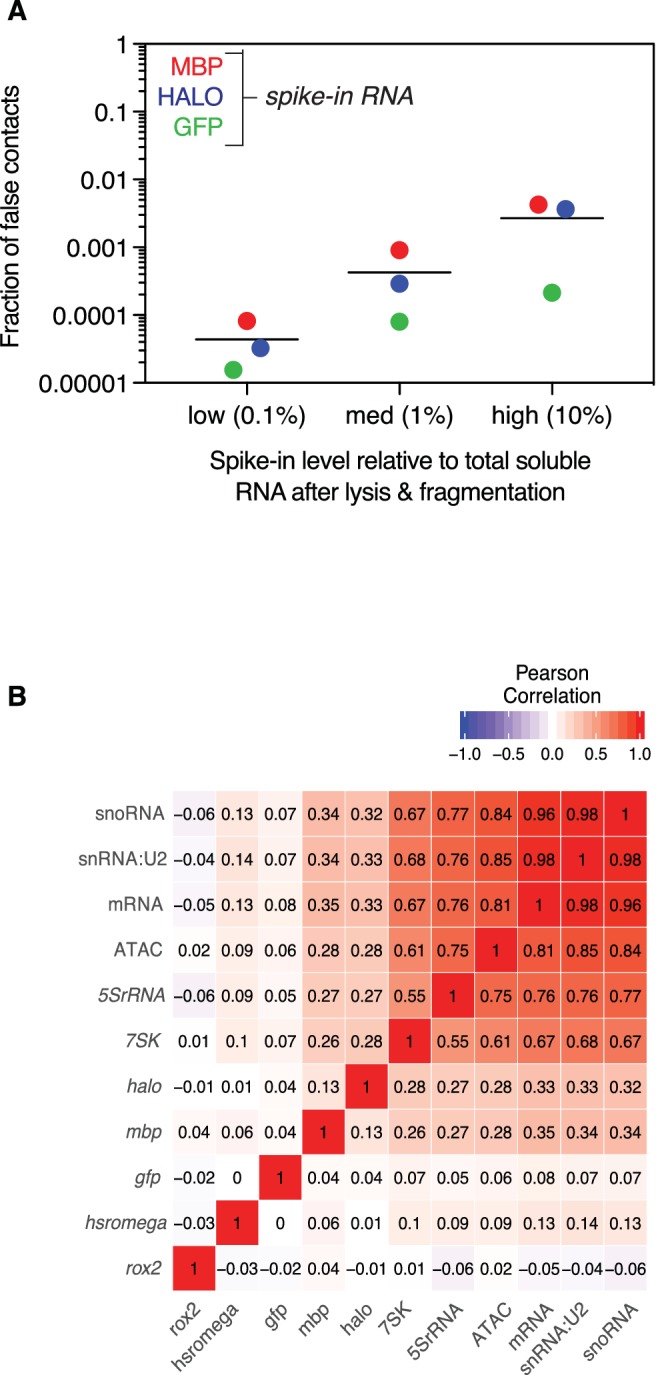
Figure 1—figure supplement 7. Chromatin-associated RNA alignment by class.
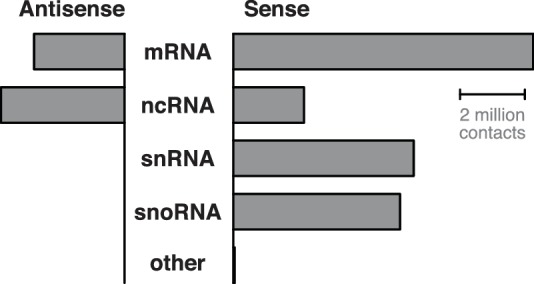
Figure 1—figure supplement 8. Abundance of cis contacts.
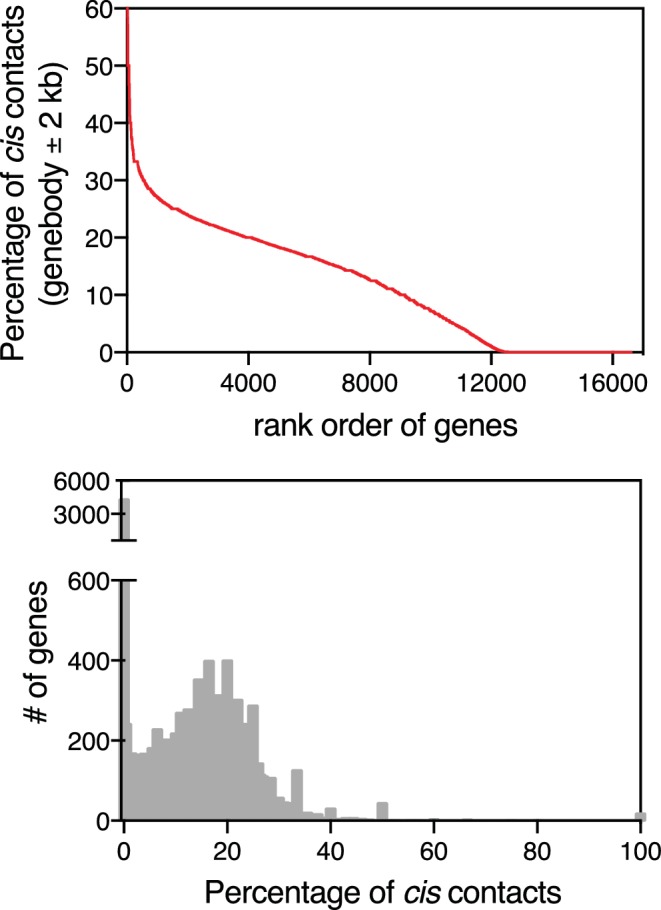
Figure 1—figure supplement 9. ChAR-seq RNA-DNA contacts are dissimilar to DNA-DNA contacts.
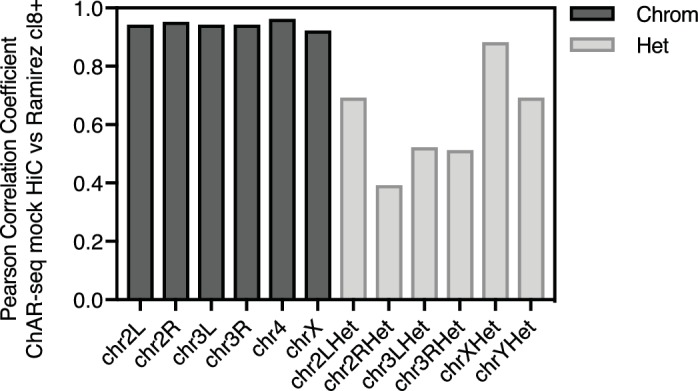
Figure 1—figure supplement 10. ChAR-seq protocol preserves genome organization.
