

Abstract
OBJECTIVE
There is limited information regarding changes in bone architecture following ACL injury. The objective of this study was to evaluate differences in tibial fractal signature in the medial and lateral compartments following ACL injury and describe how these values change following ACL-reconstruction and return to activity.
DESIGN
This was a prospective cohort study with a nested case-control analysis. ACL-injured subjects and matched controls were evaluated at pre-surgical baseline and post ACL reconstruction follow-up at a mean of 46 months. Serial Fractal Dimensions (FD) of tibial subchondral bone architecture were calculated in medial and lateral regions of interest in the horizontal and vertical dimensions.
RESULTS
In the medial and lateral compartments, there were significant differences in the vertical FD signature for ACL-injured subjects at final follow-up, when compared to the contralateral healthy tibia (medial p<0.0001; lateral p<0.0001) and the control group (medial p=0.01; lateral p<0.0001). Similarly, in the lateral compartment, there were significant differences in the horizontal FD profile for ACL-injured subjects at final follow-up, when compared to the contralateral healthy tibia (p=0.003) and the controls (p<0.0001). There were no significant side-to-side differences in FDs among healthy control subjects in the medial or lateral compartments at baseline or final follow-up.
CONCLUSION
At 46-month follow-up, Fractal Dimension profiles are significantly different, and show an overall lower FD signature, for ACL-injured knees when compared to the contralateral healthy knee and uninjured controls. Additionally, this study provided the first side-to-side symmetry data of medial and lateral FD values in healthy controls.
Introduction
Identifying the earliest stages of onset of PTOA provides the greatest opportunity for prevention and treatment of this disease, prior to substantial articular cartilage and bone changes. By definition, patients suffering from PTOA have experienced acute trauma and can be observed early in the course of their disease. It is for this reason that the Osteoarthritis Research Society International (OARSI) FDA Osteoarthritis Biomarkers Working Group has recommended targeting post-traumatic osteoarthritis patients in future studies.(1)
It has been well established that significant knee trauma such as rupture of the anterior cruciate ligament (ACL) is associated with the development of post-traumatic osteoarthritis (PTOA),(2) with radiographic changes presenting in 60–90% of patients within 10–15 years of injury.(3–5) Despite attempts at restoring normal joint biomechanics through surgical reconstruction of the ligament, PTOA still develops in most ACL-reconstructed individuals.(6) The mechanism of early-onset PTOA in the ACL-injured knee remains unknown, and its pathogenesis is not well understood.(7)
Changes in subchondral bone are an integral part of OA pathogenesis.(8–11) Subchondral bone progresses from a resorptive pattern early in the disease process to a sclerotic pattern in later phases, as demonstrated by imaging(12) and with validated biochemical markers of bone resorption.(13) Furthermore, longitudinal studies of knee OA have shown an interdependent relationship between subchondral bone changes and articular cartilage loss.(14, 15) The cause and effect relationship between subchondral bone changes and articular cartilage loss has yet to be determined in humans, but multiple animal models have demonstrated that subchondral bone changes precede articular cartilage changes.(16, 17)
Fractal signature analysis (FSA) is an alternative methodology that utilizes plain radiographs to measure the trabecular structure of bone. First described by Lynch and colleagues in the early 1990s,(18, 19) FSA quantifies the microscopic boney anatomy into Fractal Dimensions (FD) using 2-D radiographs at a variety of scales within the range of the trabecular anatomy. This technique has more recently been utilized in the context of knee OA evaluation and potentially for predicative modeling (20–24). The FD represents the number and spacing of trabeculae in the horizontal and vertical planes of the radiograph, which have been shown to represent the pore size of the bone marrow.(25)
According to Messent et al(26), a decrease in the horizontal and vertical fractal signature represents a decrease in image complexity, which can be caused by two distinct processes: either thickening of individual trabeculae or a total loss of trabeculae. In the proximal tibia in the setting of OA, the former represents subchondral sclerosis and the latter represents subarticular osteopenia as a result of stress shielding. This group has hypothesized that subchondral sclerosis of the tibia plateau may be associated with redistribution of the contact stresses that are transmitted across the tibiofemoral joint, reducing load transmission to the deeper trabecular bone, which may result in local osteopenia.(27) It is not clear whether the initial insult provided at the time of injury, surgery, or rehabilitation is responsible for this potential change, or if the resultant changes in joint biomechanics and reduced loading are implicated from a mechanistic perspective. This study was not designed to evaluate these potential causative factors, which should be the subject of future investigation.
Currently, there is limited data regarding changes in the subchondral trabeculae of the proximal tibia following severe joint trauma such as anterior cruciate ligament disruption. Furthermore, it is not known if “baseline” FD measurements of the ACL-injured knee that is observed soon after ACL trauma are in fact within normal limits and are appropriate to use for the assessment of FD change over time. Additionally, it is also not known if FD measurements obtained in healthy knees are the same bilaterally (right vs. left), or if they change over time.
The purpose of this investigation was to evaluate differences in medial and lateral subarticular tibial FD values following ACL injury, surgical reconstruction, and rehabilitation and describe how these values change over time (two time points, pre-surgical baseline compared to 4-year post-surgical follow-up) compared to the contralateral knee and to healthy, non-injured controls. Three hypothesis were tested and these included: 1) There are no significant within subject side-to-side (injured vs non-injured) differences in FD for ACL-injured subjects soon after injury at pre-surgical baseline; 2) Differences in the fractal signature do not change significantly over time in ACL-R subjects compared to the contralateral knee and to healthy, non-injured controls; and 3) There are no statistically significant side-to-side differences in fractal signature within control subjects with normal knees.
Methods
Study Design and subject population
This study was secondary analysis of data that was obtained as part of a prospective cohort study designed to study the onset of PTOA and involved 32 first-time, acute ACL-injured subjects (18 women), and 32 healthy controls (18 women) matched by sex, age, BMI, and pre-injury activity level (Table 1).(28) These patients were selected from the larger cohort and details of the surgical procedure have been described.(29, 30) Entry criteria for injured subjects included: age between 14–55yrs; BMI between 18.5–30, Tegner activity score greater than or equal to 5; no previous joint surgeries (to any joint) or knee injections; no relevant knee pathologies other than the index injury; no abnormal clinical laxity of any ligament other than the ACL; no evidence of arthritis on baseline weight bearing posterior-anterior metatarsal phalangeal view radiographs, no obvious varus or valgus malalignment (2000 IKDC Knee Examination Criteria); less than 2/3 medial or lateral meniscectomy; and grade 3A or less articular cartilage lesions of tibiofemoral or patellofemoral joints as proposed by the International Cartilage Repair Society (ICRS), documented arthroscopically by a fellowship-trained surgeon.
Table 1.
Patient Demographics
| Cases (n =32; mean (SD)) |
Controls (n=32; mean (SD)) |
|
|---|---|---|
| Age (yrs) | 29.4 (+/−12.6) | 26.7 (+/−6.6) |
| Sex | 18 F (56%) | 18 F (56%) |
| BMI | 24.8 (+/− 3.8) | 23.4 (+/− 3.3) |
| Tegner | 3 (+/− 1.5) | 6.2 (+/− 1.3) |
Yrs, Years; F, female; BMI, Body Mass Index; SD Standard Deviation
Entry criteria for control subjects were similar to injured participants with the following exceptions: no subjective report of knee pain or dysfunction as determined by the Knee Injury and Osteoarthritis Outcome Score (KOOS)(31) and International Knee Documentation Committee (IKDC) subjective knee evaluation(32); no history of significant joint trauma (defined as that requiring physician referral and/or more than three days modified activities of daily living); no abnormal findings with clinical knee examination (IKDC); and no abnormal findings on baseline or follow-up of either knee. Our Institutional Review Board approved the study. All subjects provided informed consent to participate prior to enrollment.
Surgical procedure and rehabilitation
The ACL reconstructions were performed by two fellowship trained orthopaedic surgeons. ACL-injured subjects underwent arthroscopic reconstruction within six months of their injury (mean time between index injury and surgery date was 66.6 days (SD = 29.6), range: 18–155 days) and all subjects participated in the same standardized post-surgical rehabilitation program.(29) Graft choice was at the discretion of the surgeon. The tension applied to the graft at the time of fixation was standardized with a KT-1000S arthrometer (MedMetric Corp, California) using a technique that has been described.(29) Injured subjects were assessed at baseline (within 3 weeks prior to surgery), and at a mean (SD) follow-up time of 46.1 (+/−8.6) months. Matched control subjects also underwent baseline and follow-up evaluations at a mean of 33 months (SD = +/−6.6; Range = 13.3 – 44.73)) months. Control subjects underwent baseline and follow-up 3T MRI to confirm that no pathology was present and ensure no injuries were incurred during the study period. ACL-group subjects also underwent bilateral 3T MRI at follow-up.
Radiographic procedures
Bilateral posterior-anterior (PA) view knee radiographs were obtained on all subjects during each visit using a fluoroscopy-assisted semi-flexed, metatarsal phalangeal (MTP) view technique following the approach that has been previously described.(28, 33, 34)
Image Analysis
Radiographs were digitized with a Umax UTA-2100XL transparency scanner (Umax Technologies, Inc, Dallas, Texas) at resolution of 400×400 pixels/in and a corresponding pixel size of 0.06mm as has been utilized in previous work (35). Medial and lateral compartment FSA was performed using commercially available software (KneeAnalyzer, Optasia Medical, Manchester, UK). The medial tibial joint profile was defined using a 6-point manual initialization (medial and lateral femur, medial and lateral tibial, and tibial spines). Based on the medial tibial joint profile, a region of interest (ROI) in the medial subchondral bone was defined for FSA. The ROI had a height of 6mm and included three fourths of the width of the medial tibial compartment, with its medial most border aligned with the medial tibial spine and was standardized by the software, based on prior methodology(20) and replicated by others.(21) The radiograph was flipped horizontally and these measurements were re-calculated, defining a subchondral area of interest in the lateral compartment of the tibia. Intra-class correlation coefficients (ICC) were calculated for intra-observer reliability of vertical and horizontal FD measurements. This included the complete re-evaluation of ROI and re-calculation of FSA with a minimum of 1 week between analyses for the same observer. Calculated intra-observer ICCs showed strong correlations, with values greater than 0.8.
Statistical analysis
For fractal signature analyses, raw horizontal and vertical FD data were used, in order to model the trends of FD data in relation to the radius, and to test for side-to-side differences in the polynomial fit of these trends (i.e. differences in fractal dimension between sides), based on prior work by Kraus et al.(21, 36) A subject’s FD was modeled as a function of radius using a second order (quadratic) polynomial, due to the fact that initial regression analyses indicated that this was a good fit to the data. Hierarchical linear mixed models with repeated measures were used to fit the FD data, and compare polynomial fit between sides. In the mixed models, side, radius, and radius-squared (as these values varied between subjects) were fixed effects, while variation in the regression coefficients between individuals and deviations between the estimated and observed data points within the individuals were modeled as random effects. Interaction terms were included in the model as fixed effects to permit the regression coefficients to vary in a systematic manner between sides. Sex, age, BMI, time from injury to surgery (for baseline analyses), and time from baseline to follow-up (for final follow-up analyses) were used as covariates in the analysis models, in order to control for these factors. Comparisons were made at baseline, and at final follow-up, so that results can be compared at these two time points. In addition, time to surgery (for Baseline analyses) and time from baseline to final follow-up were used as covariates in the models in order to control for these effects. Interactions with time effects were not used in the poly fit mixed models, as the differences in fractal dimension profiles vs radius and radius-squared between groups were determined by comparing models with and without group interactions with these effects. Addition of time factor interactions would result in overly complex models that would be difficult to interpret.
Model parameters were estimated by maximum likelihood and the difference in the fit of models with and without the interaction terms was assessed by the likelihood ratio test to determine the significance of differences between sides in the polynomials used to characterize FD. For these analyses, left and right legs of control subjects were randomized to “injured” and “uninjured” sides, frequency matched to the same distribution of Injured/Uninjured vs. Left/Right as that of the ACL-R subject group. Similar mixed models were used, with fixed effect of group (ACL-R vs. Control), in order to test for significant differences in polynomial FD fit between groups, using “injured” leg data only. P-values will be presented to compare the polynomial fit mixed models, to determine if there are statistically significant differences between groups in the polynomial fit of the relationships between fractal dimension and radius/radius-squared. The p-value is derived by comparing the results of the likelihood ratio test between models with and without the group interactions present. Significance level alpha = 0.05 was used to determine statistical significance. Analyses were done using SAS 9.2 statistical software (SAS Institute, Inc. Cary, NC, USA).
Results
Of the 39 ACL-injured patients in the matched cohort, 7 patients were excluded from statistical analysis. Four did not have adequate follow up and 3 had poor image quality on follow up radiographs. Of the included radiographs, ACL-R hardware and surgical tunnels were not located within the medial or lateral FSA ROI. Descriptive statistics for medial and lateral FDs at each time point are presented in Table 2. P-values comparing significant differences in polynomial fit for each group (Figures 2 and 3) are presented in Table 3.
Table 2.
Results
| Cases vs Controls: ACL-Injured vs Non-injured Subjects | ||||||||
|---|---|---|---|---|---|---|---|---|
| Time point | Compartment | Cohort | FD Variable | Mean | Std. Dev. | Min. | Max. | |
| Baseline | Medial | Cases | Vertical | 2.489 | 0.215 | 2.080 | 3.072 | |
| Controls | Vertical | 2.529 | 0.207 | 2.104 | 3.125 | |||
| Cases | Horizontal | 2.607 | 0.332 | 2.063 | 4.244 | |||
| Controls | Horizontal | 2.576 | 0.254 | 2.112 | 4.194 | |||
| Lateral | Cases | Vertical | 2.630 | 0.201 | 2.184 | 3.165 | ||
| Controls | Vertical | 2.593 | 0.196 | 2.163 | 3.094 | |||
| Cases | Horizontal | 2.765 | 0.320 | 2.122 | 4.206 | |||
| Controls | Horizontal | 2.709 | 0.253 | 2.178 | 4.172 | |||
| Final | Medial | Cases | Vertical | 2.429 | 0.205 | 2.057 | 3.025 | |
| Controls | Vertical | 2.499 | 0.192 | 2.116 | 3.071 | |||
| Cases | Horizontal | 2.592 | 0.311 | 2.101 | 4.296 | |||
| Controls | Horizontal | 2.569 | 0.275 | 2.112 | 4.058 | |||
| Lateral | Cases | Vertical | 2.582 | 0.185 | 2.165 | 3.034 | ||
| Controls | Vertical | 2.583 | 0.206 | 2.148 | 3.068 | |||
| Cases | Horizontal | 2.685 | 0.279 | 2.128 | 4.135 | |||
| Controls | Horizontal | 2.692 | 0.270 | 2.135 | 4.310 | |||
| Cases: ACL-injured Within Subject Side to Side Comparisons | ||||||||
| Time point | Compartment | Side | FD Variable | Mean | Std. Dev. | Min. | Max. | |
| Baseline | Medial | Injured | Vertical | 2.489 | 0.215 | 2.080 | 3.072 | |
| Uninjured | Vertical | 2.493 | 0.220 | 2.081 | 3.100 | |||
| Injured | Horizontal | 2.607 | 0.332 | 2.063 | 4.244 | |||
| Uninjured | Horizontal | 2.599 | 0.337 | 2.066 | 4.285 | |||
| Lateral | Injured | Vertical | 2.630 | 0.201 | 2.184 | 3.165 | ||
| Uninjured | Vertical | 2.611 | 0.201 | 2.129 | 3.117 | |||
| Injured | Horizontal | 2.765 | 0.320 | 2.122 | 4.206 | |||
| Uninjured | Horizontal | 2.767 | 0.305 | 2.159 | 4.204 | |||
| Final | Medial | Injured | Vertical | 2.429 | 0.205 | 2.057 | 3.025 | |
| Uninjured | Vertical | 2.462 | 0.198 | 2.117 | 3.026 | |||
| Injured | Horizontal | 2.592 | 0.311 | 2.101 | 4.296 | |||
| Uninjured | Horizontal | 2.574 | 0.312 | 2.073 | 4.130 | |||
| Lateral | Injured | Vertical | 2.582 | 0.185 | 2.165 | 3.034 | ||
| Uninjured | Vertical | 2.602 | 0.195 | 2.190 | 3.082 | |||
| Injured | Horizontal | 2.685 | 0.279 | 2.128 | 4.135 | |||
| Uninjured | Horizontal | 2.709 | 0.301 | 2.154 | 4.228 | |||
| Controls: Non-injured Subjects Side to Side Comparisons | ||||||||
| Time point | Compartment | Side | FD Variable | Mean | Std. Dev. | Min. | Max. | |
| Baseline | Medial | Injured | Vertical | 2.529 | 0.207 | 2.104 | 3.125 | |
| Uninjured | Vertical | 2.525 | 0.209 | 2.146 | 3.103 | |||
| Injured | Horizontal | 2.576 | 0.254 | 2.112 | 4.194 | |||
| Uninjured | Horizontal | 2.573 | 0.257 | 2.162 | 3.988 | |||
| Lateral | Injured | Vertical | 2.593 | 0.196 | 2.163 | 3.094 | ||
| Uninjured | Vertical | 2.592 | 0.200 | 2.146 | 3.070 | |||
| Injured | Horizontal | 2.709 | 0.253 | 2.178 | 4.172 | |||
| Uninjured | Horizontal | 2.705 | 0.258 | 2.256 | 4.201 | |||
| Final | Medial | Injured | Vertical | 2.499 | 0.192 | 2.116 | 3.071 | |
| Uninjured | Vertical | 2.502 | 0.191 | 2.148 | 3.021 | |||
| Injured | Horizontal | 2.569 | 0.275 | 2.112 | 4.058 | |||
| Uninjured | Horizontal | 2.562 | 0.271 | 2.075 | 3.890 | |||
| Lateral | Injured | Vertical | 2.583 | 0.206 | 2.148 | 3.068 | ||
| Uninjured | Vertical | 2.581 | 0.189 | 2.182 | 3.040 | |||
| Injured | Horizontal | 2.692 | 0.270 | 2.135 | 4.310 | |||
| Uninjured | Horizontal | 2.687 | 0.292 | 2.198 | 3.981 | |||
NOTE: these are unadjusted means/descriptive statistics. Statistical analysis results shown are for models with sex, age, BMI, and time covariates, and are testing for differences in polynomial fit.
Figure 2.

Lateral Compartment Fractal Dimensions at Baseline and Follow-up. ACL-injured knee (red), ACL-injured contralateral knee (yellow), ipsilateral control knee (green), contralateral control knee (black). Asterisk denotes statistically significant (P<0.05). FD = Fractal Dimension.
Curves correspond to the poly fit of the whole group. *P-vakues are used to determine statiscally significant differences in polynomial fit of the models, and are presented in Table 3.
Figure 3.
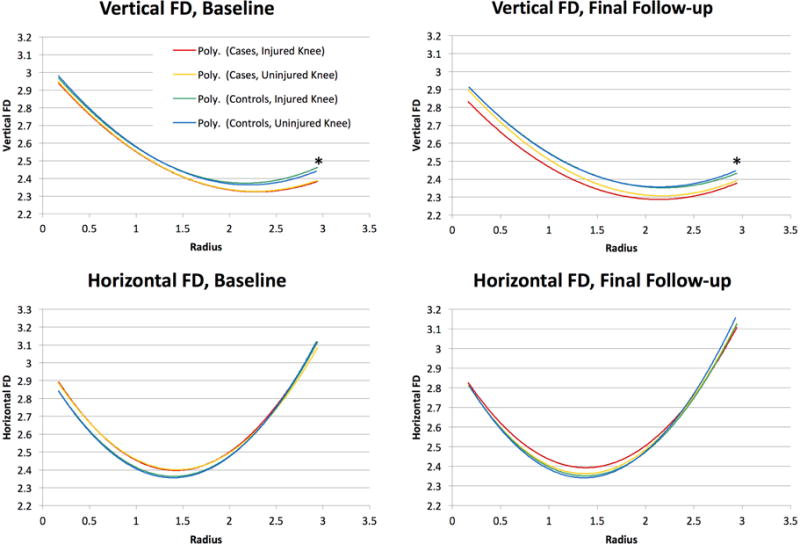
Medial Compartment Fractal Dimensions at Baseline and Follow-up. ACL-injured knee (red), ACL-injured contralateral knee (yellow), ipsilateral control knee (green), contralateral control knee (black). Asterisk denotes statistically significant (P<0.05). FD = Fractal Dimension.
Curves correspond to the poly fit of the whole group. *P-vakues are used to determine statiscally significant differences in polynomial fit of the models, and are presented in Table 3.
Table 3.
Whole Group Polynomial Fit Results
| Time point | Compartment | FD Variable | P-value |
|---|---|---|---|
| Cases vs Controls: ACL-Injured vs Non-injured Subjects | |||
|
| |||
| Baseline | Medial | Vertical | < 0.0001 |
| Horizontal | 0.2 | ||
| Lateral | Vertical | 0.0009 | |
| Horizontal | 0.12 | ||
| Final | Medial | Vertical | 0.01 |
| Horizontal | 0.22 | ||
| Lateral | Vertical | < 0.0001 | |
| Horizontal | < 0.0001 | ||
|
| |||
| Cases: ACL-injured Within Subject Side to Side Comparisons | |||
|
| |||
| Baseline | Medial | Vertical | 0.87 |
| Horizontal | 0.39 | ||
| Lateral | Vertical | < 0.0001 | |
| Horizontal | 0.83 | ||
| Final | Medial | Vertical | < 0.0001 |
| Horizontal | 0.07 | ||
| Lateral | Vertical | < 0.0001 | |
| Horizontal | 0.003 | ||
|
| |||
| Controls: Non-injured Subjects Side to Side Comparisons | |||
|
| |||
| Baseline | Medial | Vertical | 0.06 |
| Horizontal | 0.73 | ||
| Lateral | Vertical | 0.08 | |
| Horizontal | 0.35 | ||
| Final | Medial | Vertical | 0.06 |
| Horizontal | 0.19 | ||
| Lateral | Vertical | 0.3 | |
| Horizontal | 0.09 | ||
Data adjusted for sex, BMI age, time from injury to surgery (Baseline data) or time from baseline to final follow-up (Final data).
ACL injured subjects: (Comparison of ACL Injured Knee versus the Contralateral Uninjured Knee within ACL injured subjects)
In the lateral compartment of the tibia (Figure 2), there were significant side-to-side differences in vertical FD for ACL-injured subjects, at both baseline and final follow-up time points (p < 0.0001, for both). The fractal signature on the ACL injured side demonstrated an overall higher FD relative to the contralateral side at baseline and lower overall FD at final follow up. For the horizontal fractal signature in the lateral compartment of the tibia, there was a significant difference in FD profile on the ACL injured side relative to the contralateral side at final follow-up (p = 0.003); however, the same comparison was not significantly different at the baseline visit (p = 0.83).
In the medial compartment of the tibia (Figure 3), there was a significant difference in the vertical FD of the ACL injured limb in comparison to the contralateral side at final follow-up for ACL-injured subjects (p < 0.0001). In contrast, this same comparison was not significantly different at baseline (p = 0.87). For the horizontal fractal signature in the medial compartment, there were no significant differences at both baseline and final follow-up time points (p = 0.39 and p = 0.07, respectively).
ACL-injured versus Control Subject comparison: (Comparison of ACL injured knee with the corresponding healthy knee from the control subject)
In the lateral compartment (Figure 2), there was a significant difference in vertical fractal signature for the ACL-injured subjects’ injured knees in comparison to the corresponding, matched knees of the control subjects at baseline (p = 0.0009), showing an overall higher fractal signature. At final follow-up, the vertical fractal signatures (polynomial fit curves) for the ACL injured subjects injured knee and the corresponding side of the matched control subjects intersected and remained significantly different (p < .0001). Similarly, there was intersection and significant difference of the horizontal fractal signatures between ACL-injured subjects’ injured knees and the corresponding, matched knees of the control subjects, at final follow-up (p = < 0.0001).
In the medial compartment (Figure 3), there were significant differences in the vertical fractal signature for the ACL-injured subjects’ injured knees and the corresponding, matched knees of control subjects, at both baseline and final follow-up (p < 0.0001 and p = 0.01, respectively), showing an overall lower fractal signature. For the horizontal fractal signature, there were no significant differences at baseline or final follow-up (p = 0.2 and p = 0.22, respectively).
Control subjects: (Side-to-side comparison of knees for subjects in the control group)
There were no statistically significant side-to-side differences in vertical or horizontal fractal signature found for control subjects in medial and lateral compartments, at baseline and final follow-up visits (Figures 2 and 3). All of these analyses included adjustment for age, sex, BMI, and time from injury to surgery or time from baseline to follow up.
Discussion
We found significant differences in the fractal signature polynomial curves between ACL-Injured knees and controls with normal knees, as well as side-to-side differences in fractal dimensions within ACL-Injured subjects. To our knowledge, this is the first cohort study with a nested case-control analysis demonstrating subacute changes in tibial subchondral bone trabeculae in subjects at increased risk of developing post-traumatic osteoarthritis using Fractal Signature Analysis in a relatively homogenous group regarding pathology and surgical procedure. Of the 32 participants in the ACL reconstruction group, 28 of 32 (87.5%) ACL reconstructions were performed with autologous bone–patellar tendon–bone (BPTB) autografts, 3 (9.4%) were BPTB allografts, and 1 (3.1%) was reconstructed with a semitendinosus gracilis 4-strand autograft. No patients had more than 1/3 meniscectomy in both medial and lateral compartments combined. Thirteen patients had no tibiofemoral articular cartilage lesions (40.6% of total ACL group), 6 patients had grade 1A or 1B (18.8%), 9 patients had grade 2 lesions (28.1%), and 4 patients had grade 3A lesions (12.5%) as their most significant lesion present.
Our results are similar to those presented by Messent et al(26) in a primary OA cohort, who demonstrated decreases in horizontal and vertical fractal signatures over time. This likely represents early trabecular thickening from sclerosis in the more superficial subchondral bone, however, it may be a mixed picture of both subchondral sclerosis and subarticular osteopenia of the deeper trabecular bone, two separate processes occurring in early PTOA and both resulting in decreased complexity of the image, and therefore lower fractal signatures. Just below the chondral surface, reactive sclerosis may occur in early PTOA leading to redistribution of articular contact stress, reducing load transmission to the underlying subarticular bone resulting in local osteopenia, as discussed by Messent et al.(27). However, the interpretation of fractal signatures is complex. For instance, it is difficult to interpret the relevance of the intersection of the fractal signatures over the radius of coverage between the ACL injured subjects and the uninjured control subjects in the lateral compartment (Figure 2). This may be a limitation of FSA as a tool for evaluating the multiple constructs involved with trabecular bone features as a whole (thickening/thinning of trabeculae, changes in shape, fenestration, etc), as these changes occur at different scale ranges within the “texture” of the bone (i.e., 10–100μm vs. 200–2000μm). Additionally, the use of a relatively large ROI as defined by a commercially-available software package may result in the masking of tibial subchondral trabecular bone changes, which may occur locally within finite regions of each compartment. Future studies evaluating RSA values following ACL injury and surgical reconstruction with other bone-imaging modailities (Dual-energy X-ray Absorptiometry, Computed Tomography, MRI, etc), may prove exceptionally beneficial in the interpretation and validation of results in a group at high risk for sustaining PTOA.(37, 38)
To our knowledge, the previous work of Buckland-Wright et al. is the only other work on fractal signatures in an ACL-injured cohort.(35) Compared to the uninjured knee, the authors found lower horizontal fractal dimensions in the medial compartment. Our results did not reproduce their findings in the medial compartment; however, this may be secondary to differences in the ROI selection(22), as we used a commercially available third-party software package for analyses, and Buckland-Wright, et al., used custom in-house proprietary software. We found no significant difference in the horizontal FD at final follow-up. However, the findings of Buckland-Wright et al. were detected in conservatively treated ACL-deficient knees, four years post-injury when radiographic evidence of osteoarthritis was already present in 50% of injured knees. Unlike the Buckland-Wright et al. study, which found no changes in the lateral compartment, we demonstrate a significantly lower vertical fractal signatures in the lateral compartment when comparting baseline to follow-up.
Roemer et al(39) recently reported a cross-sectional study on fractal signatures of the subchondral tibial plateau of patients (n=685; 135 athletes, 550 non-athletes) seeking medical assessment for subacute or chronic knee symptoms. The study demonstrated a lower horizontal FD among ACL-injured athletes in both the medial and lateral compartments compared to the rest of the cohort. Our results support their findings as we also demonstrated a lower FD in the lateral compartment at final follow-up. Further, earlier results(40) from the same cohort found prior ACL surgery in these young athletes to increase the odds of having radiographic evidence of OA compared to non-athletes at follow up, suggesting there may be a relationship between the fractal signatures and the development of OA.
Other longitudinal studies have examined tibial subchondral bone in the context of primary OA using FSA.(21, 26, 41, 42) Most recently, Kraus et al(21) reported lower fractal signatures of horizontal trabeculae in patients with progressive OA compared to nonprogressive OA, suggesting that changes in periarticular bone are sensitive indicators for OA disease progression. We utilized a similar quadratic polynomial fit to assess fractal signature changes over time and also found lower horizontal fractal signatures in the lateral compartment of ACL-injured knees. Unlike out results, Kraus et al found higher vertical fractal signatures. It is possible that the subchondral thickening associated with primary idiopathic OA shares a similar pathology early in the time course of PTOA. It should also be noted that other groups have found similar results in larger primary OA cohorts(22–24), however, different analysis methodologies and evaluated trabecular scales (μm ranges) may explain subtle differences in results.
Lastly, we have also reported the first side-to-side comparison of fractal signatures in healthy subjects with normal knees. With no significant side-to-side differences, these findings provide a supporting rationale for using the healthy contralateral knee as a control for the injured knee in future studies.
Potential limitations of this investigation include a small sample size and only midterm follow up, making it impossible to correlate our findings with the incidence of radiographic OA. However, these limitations are offset by important strengths that include the prospective study design, the focus on a homogenous group of subjects that suffered their first ACL trauma with minimal associated injury to other articular structures such as the articular cartilage and menisci, evaluation of healthy control subjects with normal knees, and the use of standardized fluoroscopy-assisted radiographs as recommended by Jarrraya 2015(43) represent important strengths. It should also be noted that the p-values shown herein are measures of statistical significance. The p-value is actually the probability of obtaining an estimate, or test statistic, at least as extreme as the one obtained, if the null hypothesis for the statistical test were true. Thus it is a measure of inferential uncertainty, as opposed to clinical importance. The statistically significant results shown may not indicate clinical or practical importance in all cases. In addition, the use of 3T MRI at baseline and follow-up of both ACL injured and control subjects (to document they had normal knees at baseline and follow up), represent important strengths.
In conclusion, we found significantly lower fractal signatures for ACL-injured knees over time, when compared to the contralateral healthy knee as well as uninjured controls. These results may suggest thickening of the subchondral bone following ACL injury and reconstruction at medium-term follow up. The changes in the trabecular structure following ACL-injury reported here provides an opportunity for further investigation and possible intervention during the earliest, asymptomatic stages of PTOA. FSA is a resilient, cost-effective method to evaluate boney microarchitecture during the onset and progression of PTOA. However, analyzing and interpreting the initial changes in fractal dimensions soon after joint trauma and how they are related to PTOA will require assessments at longer term follow-up intervals, and additional work is required to standardize fractal signature data in order to translate our findings to other study populations.
Figure 1.

FSA Region of Interest. Serial fractal signatures of tibial subchondral bone architecture were calculated in medial (blue) and lateral (red) regions of interest. The tibial joint profile was defined using a 6-point manual initialization (medial and lateral femur, medial and lateral tibial, and tibial spines).
Footnotes
Publisher's Disclaimer: This is a PDF file of an unedited manuscript that has been accepted for publication. As a service to our customers we are providing this early version of the manuscript. The manuscript will undergo copyediting, typesetting, and review of the resulting proof before it is published in its final citable form. Please note that during the production process errors may be discovered which could affect the content, and all legal disclaimers that apply to the journal pertain.
- All authors were involved in the conception and design of the study, or acquisition of data, or analysis and interpretation of data.
- All authors contributed to drafting the article or revising it critically for important intellectual content.
- All authors gave their final approval of the manuscript to be submitted.
Analysis and interpretation of the data: CEB, TWT, MD, BDB
Drafting of the article: CEB, TWT, MD, BDB
Provision of study materials or patients: TWT, BDB
Statistical expertise: MD, BDB
Collection and assembly of data: CEB, KM, TWT
Responsibility for the integrity of the work as a whole from inception to finished article is taken by Timothy W. Tourville, PhD, ATC (timothy.tourville@med.uvm.edu).
Competing Interest Statement
No authors declare any competing interests.
References
- 1.Kraus VB, Burnett B, Coindreau J, Cottrell S, Eyre D, Gendreau M, et al. Application of biomarkers in the development of drugs intended for the treatment of osteoarthritis. Osteoarthritis Cartilage. 2011;19:515–542. doi: 10.1016/j.joca.2010.08.019. [DOI] [PMC free article] [PubMed] [Google Scholar]
- 2.Oiestad BE, Engebretsen L, Storheim K, Risberg MA. Knee osteoarthritis after anterior cruciate ligament injury: a systematic review. Am J Sports Med. 2009;37:1434–1443. doi: 10.1177/0363546509338827. [DOI] [PubMed] [Google Scholar]
- 3.Noyes FR, Mooar PA, Matthews DS, Butler DL. The symptomatic anterior cruciate-deficient knee. Part I: the long-term functional disability in athletically active individuals. J Bone Joint Surg Am. 1983;65:154–162. doi: 10.2106/00004623-198365020-00003. [DOI] [PubMed] [Google Scholar]
- 4.Sommerlath K, Lysholm J, Gillquist J. The long-term course after treatment of acute anterior cruciate ligament ruptures. A 9 to 16 year followup. Am J Sports Med. 1991;19:156–162. doi: 10.1177/036354659101900211. [DOI] [PubMed] [Google Scholar]
- 5.Kannus P, Jarvinen M. Conservatively treated tears of the anterior cruciate ligament. Long-term results. J Bone Joint Surg Am. 1987;69:1007–1012. [PubMed] [Google Scholar]
- 6.Lohmander LS, Englund PM, Dahl LL, Roos EM. The long-term consequence of anterior cruciate ligament and meniscus injuries: osteoarthritis. Am J Sports Med. 2007;35:1756–1769. doi: 10.1177/0363546507307396. [DOI] [PubMed] [Google Scholar]
- 7.Anderson DD, Chubinskaya S, Guilak F, Martin JA, Oegema TR, Olson SA, et al. Post-traumatic osteoarthritis: improved understanding and opportunities for early intervention. J Orthop Res. 2011;29:802–809. doi: 10.1002/jor.21359. [DOI] [PMC free article] [PubMed] [Google Scholar]
- 8.Karsdal MA, Leeming DJ, Dam EB, Henriksen K, Alexandersen P, Pastoureau P, et al. Should subchondral bone turnover be targeted when treating osteoarthritis? Osteoarthritis Cartilage. 2008;16:638–646. doi: 10.1016/j.joca.2008.01.014. [DOI] [PubMed] [Google Scholar]
- 9.Baker-LePain JC, Lane NE. Role of bone architecture and anatomy in osteoarthritis. Bone. 2012;51:197–203. doi: 10.1016/j.bone.2012.01.008. [DOI] [PMC free article] [PubMed] [Google Scholar]
- 10.Goldring SR. The role of bone in osteoarthritis pathogenesis. Rheum Dis Clin North Am. 2008;34:561–571. doi: 10.1016/j.rdc.2008.07.001. [DOI] [PubMed] [Google Scholar]
- 11.Chiba K, Uetani M, Kido Y, Ito M, Okazaki N, Taguchi K, et al. Osteoporotic changes of subchondral trabecular bone in osteoarthritis of the knee: a 3-T MRI study. Osteoporos Int. 2012;23:589–597. doi: 10.1007/s00198-011-1585-2. [DOI] [PubMed] [Google Scholar]
- 12.Boileau C, Martel-Pelletier J, Abram F, Raynauld JP, Troncy E, D’Anjou MA, et al. Magnetic resonance imaging can accurately assess the long-term progression of knee structural changes in experimental dog osteoarthritis. Ann Rheum Dis. 2008;67:926–932. doi: 10.1136/ard.2007.077297. [DOI] [PubMed] [Google Scholar]
- 13.Bettica P, Cline G, Hart DJ, Meyer J, Spector TD. Evidence for increased bone resorption in patients with progressive knee osteoarthritis: longitudinal results from the Chingford study. Arthritis Rheum. 2002;46:3178–3184. doi: 10.1002/art.10630. [DOI] [PubMed] [Google Scholar]
- 14.Raynauld JP, Martel-Pelletier J, Berthiaume MJ, Abram F, Choquette D, Haraoui B, et al. Correlation between bone lesion changes and cartilage volume loss in patients with osteoarthritis of the knee as assessed by quantitative magnetic resonance imaging over a 24-month period. Ann Rheum Dis. 2008;67:683–688. doi: 10.1136/ard.2007.073023. [DOI] [PubMed] [Google Scholar]
- 15.Blumenkrantz G, Lindsey CT, Dunn TC, Jin H, Ries MD, Link TM, et al. A pilot, two-year longitudinal study of the interrelationship between trabecular bone and articular cartilage in the osteoarthritic knee. Osteoarthritis Cartilage. 2004;12:997–1005. doi: 10.1016/j.joca.2004.09.001. [DOI] [PubMed] [Google Scholar]
- 16.Brandt KD, Myers SL, Burr D, Albrecht M. Osteoarthritic changes in canine articular cartilage, subchondral bone, and synovium fifty-four months after transection of the anterior cruciate ligament. Arthritis Rheum. 1991;34:1560–1570. doi: 10.1002/art.1780341214. [DOI] [PubMed] [Google Scholar]
- 17.Hayami T, Pickarski M, Wesolowski GA, McLane J, Bone A, Destefano J, et al. The role of subchondral bone remodeling in osteoarthritis: reduction of cartilage degeneration and prevention of osteophyte formation by alendronate in the rat anterior cruciate ligament transection model. Arthritis Rheum. 2004;50:1193–1206. doi: 10.1002/art.20124. [DOI] [PubMed] [Google Scholar]
- 18.Lynch JA, Hawkes DJ, Buckland-Wright JC. Analysis of texture in macroradiographs of osteoarthritic knees using the fractal signature. Phys Med Biol. 1991;36:709–722. doi: 10.1088/0031-9155/36/6/001. [DOI] [PubMed] [Google Scholar]
- 19.Lynch JA, Hawkes DJ, Buckland-Wright JC. A robust and accurate method for calculating the fractal signature of texture in macroradiographs of osteoarthritic knees. Med Inform (Lond) 1991;16:241–251. doi: 10.3109/14639239109012130. [DOI] [PubMed] [Google Scholar]
- 20.Messent EA, Buckland-Wright JC, Blake GM. Fractal analysis of trabecular bone in knee osteoarthritis (OA) is a more sensitive marker of disease status than bone mineral density (BMD) Calcif Tissue Int. 2005;76:419–425. doi: 10.1007/s00223-004-0160-7. [DOI] [PubMed] [Google Scholar]
- 21.Kraus VB, Feng S, Wang S, White S, Ainslie M, Brett A, et al. Trabecular morphometry by fractal signature analysis is a novel marker of osteoarthritis progression. Arthritis Rheum. 2009;60:3711–3722. doi: 10.1002/art.25012. [DOI] [PMC free article] [PubMed] [Google Scholar]
- 22.Janvier T, Jennane R, Valery A, Harrar K, Delplanque M, Lelong C, et al. Subchondral tibial bone texture analysis predicts knee osteoarthritis progression: data from the Osteoarthritis Initiative: Tibial bone texture & knee OA progression. Osteoarthritis Cartilage. 2017;25:259–266. doi: 10.1016/j.joca.2016.10.005. [DOI] [PubMed] [Google Scholar]
- 23.Podsiadlo P, Nevitt MC, Wolski M, Stachowiak GW, Lynch JA, Tolstykh I, et al. Baseline trabecular bone and its relation to incident radiographic knee osteoarthritis and increase in joint space narrowing score: directional fractal signature analysis in the MOST study. Osteoarthritis Cartilage. 2016;24:1736–1744. doi: 10.1016/j.joca.2016.05.003. [DOI] [PMC free article] [PubMed] [Google Scholar]
- 24.Woloszynski T, Podsiadlo P, Stachowiak GW, Kurzynski M, Lohmander LS, Englund M. Prediction of progression of radiographic knee osteoarthritis using tibial trabecular bone texture. Arthritis Rheum. 2012;64:688–695. doi: 10.1002/art.33410. [DOI] [PubMed] [Google Scholar]
- 25.Chung HW, Chu CC, Underweiser M, Wehrli FW. On the fractal nature of trabecular structure. Med Phys. 1994;21:1535–1540. doi: 10.1118/1.597263. [DOI] [PubMed] [Google Scholar]
- 26.Messent EA, Ward RJ, Tonkin CJ, Buckland-Wright C. Tibial cancellous bone changes in patients with knee osteoarthritis. A short-term longitudinal study using Fractal Signature Analysis. Osteoarthritis Cartilage. 2005;13:463–470. doi: 10.1016/j.joca.2005.01.007. [DOI] [PubMed] [Google Scholar]
- 27.Messent EA, Ward RJ, Tonkin CJ, Buckland-Wright C. Cancellous bone differences between knees with early, definite and advanced joint space loss; a comparative quantitative macroradiographic study. Osteoarthritis Cartilage. 2005;13:39–47. doi: 10.1016/j.joca.2004.10.009. [DOI] [PubMed] [Google Scholar]
- 28.Tourville TW, Johnson RJ, Slauterbeck JR, Naud S, Beynnon BD. Assessment of early tibiofemoral joint space width changes after anterior cruciate ligament injury and reconstruction: a matched case-control study. Am J Sports Med. 2013;41:769–778. doi: 10.1177/0363546513477838. [DOI] [PMC free article] [PubMed] [Google Scholar]
- 29.Beynnon BD, Johnson RJ, Naud S, Fleming BC, Abate JA, Brattbakk B, et al. Accelerated Versus Nonaccelerated Rehabilitation After Anterior Cruciate Ligament Reconstruction: A Prospective, Randomized, Double-Blind Investigation Evaluating Knee Joint Laxity Using Roentgen Stereophotogrammetric Analysis. Am J Sports Med. 2011;39:2536–2548. doi: 10.1177/0363546511422349. [DOI] [PubMed] [Google Scholar]
- 30.Tourville TW, Johnson RJ, Slauterbeck JR, Naud S, Beynnon BD. Relationship Between Markers of Type II Collagen Metabolism and Tibiofemoral Joint Space Width Changes After ACL Injury and Reconstruction. Am J Sports Med. 2013;41:779–787. doi: 10.1177/0363546513476481. [DOI] [PMC free article] [PubMed] [Google Scholar]
- 31.Roos EM, Roos HP, Lohmander LS, Ekdahl C, Beynnon BD. Knee Injury and Osteoarthritis Outcome Score (KOOS)–development of a self-administered outcome measure. J Orthop Sports Phys Ther. 1998;28:88–96. doi: 10.2519/jospt.1998.28.2.88. [DOI] [PubMed] [Google Scholar]
- 32.Irrgang JJ, Anderson AF, Boland AL, Harner CD, Kurosaka M, Neyret P, et al. Development and validation of the international knee documentation committee subjective knee form. Am J Sports Med. 2001;29:600–613. doi: 10.1177/03635465010290051301. [DOI] [PubMed] [Google Scholar]
- 33.Dupuis DE, Beynnon BD, Richard MJ, Novotny JE, Skelly JM, Cooper SM. Precision and accuracy of joint space width measurements of the medial compartment of the knee using standardized MTP semi-flexed radiographs. Osteoarthritis Cartilage. 2003;11:716–724. doi: 10.1016/s1063-4584(03)00158-4. [DOI] [PubMed] [Google Scholar]
- 34.Tourville TW, Jarrell KM, Naud S, Slauterbeck JR, Johnson RJ, Beynnon BD. Relationship between isokinetic strength and tibiofemoral joint space width changes after anterior cruciate ligament reconstruction. Am J Sports Med. 2014;42:302–311. doi: 10.1177/0363546513510672. [DOI] [PMC free article] [PubMed] [Google Scholar]
- 35.Buckland-Wright JC, Lynch JA, Dave B. Early radiographic features in patients with anterior cruciate ligament rupture. Ann Rheum Dis. 2000;59:641–646. doi: 10.1136/ard.59.8.641. [DOI] [PMC free article] [PubMed] [Google Scholar]
- 36.Kraus VB, Feng S, Wang S, White S, Ainslie M, Graverand MP, et al. Subchondral bone trabecular integrity predicts and changes concurrently with radiographic and magnetic resonance imaging-determined knee osteoarthritis progression. Arthritis Rheum. 2013;65:1812–1821. doi: 10.1002/art.37970. [DOI] [PMC free article] [PubMed] [Google Scholar]
- 37.van Meer BL, Waarsing JH, van Eijsden WA, Meuffels DE, van Arkel ER, Verhaar JA, et al. Bone mineral density changes in the knee following anterior cruciate ligament rupture. Osteoarthritis Cartilage. 2014;22:154–161. doi: 10.1016/j.joca.2013.11.005. [DOI] [PubMed] [Google Scholar]
- 38.Mundermann A, Payer N, Felmet G, Riehle H. Comparison of volumetric bone mineral density in the operated and contralateral knee after anterior cruciate ligament and reconstruction: A 1-year follow-up study using peripheral quantitative computed tomography. J Orthop Res. 2015;33:1804–1810. doi: 10.1002/jor.22962. [DOI] [PubMed] [Google Scholar]
- 39.Roemer FW, Jarraya M, Niu J, Duryea J, Lynch JA, Guermazi A. Knee joint subchondral bone structure alterations in active athletes: a cross-sectional case-control study. Osteoarthritis Cartilage. 2015 doi: 10.1016/j.joca.2015.07.002. [DOI] [PubMed] [Google Scholar]
- 40.Roemer FW, Jarraya M, Niu J, Silva JR, Frobell R, Guermazi A. Increased risk for radiographic osteoarthritis features in young active athletes: a cross-sectional matched case-control study. Osteoarthritis Cartilage. 2015;23:239–243. doi: 10.1016/j.joca.2014.11.011. [DOI] [PubMed] [Google Scholar]
- 41.Buckland-Wright CME, Papaloucas CD, Cline GA, Beary J, Meyer J. Tibial cancellous bone changes in OA knee patients grouped into those with slow or detectable joint space narrowing (JSN) (Abstract) Arthritis Rheum. 2004;50 [Google Scholar]
- 42.Buckland-Wright JC, Messent EA, Bingham CO, 3rd, Ward RJ, Tonkin C. A 2 yr longitudinal radiographic study examining the effect of a bisphosphonate (risedronate) upon subchondral bone loss in osteoarthritic knee patients. Rheumatology (Oxford) 2007;46:257–264. doi: 10.1093/rheumatology/kel213. [DOI] [PubMed] [Google Scholar]
- 43.Jarraya M, Guermazi A, Niu J, Duryea J, Lynch JA, Roemer FW. Multi-dimensional reliability assessment of fractal signature analysis in an outpatient sports medicine population. Ann Anat. 2015;202:57–60. doi: 10.1016/j.aanat.2015.07.006. [DOI] [PubMed] [Google Scholar]