Abstract
Objectives
To test the hypothesis that brain structural integrity (i.e., hippocampal [HIP] volume), white matter lesions (WMLs), and β-amyloid deposition are associated with long-term increased risk of incident dementia and mortality in 183 cognitively normal individuals and patients with mild cognitive impairment (MCI) aged 80 years and older.
Methods
All participants had a brain structural MRI scan and PET scan with 11C-labeled Pittsburgh compound B in 2009 and were reexamined yearly through 2015 (mean follow-up time 5.2 ± 1.3 years).
Results
In the last evaluation through 2010–2015, 56 (31%) participants were cognitively normal, 67 (37%) had MCI, and 60 (33%) had dementia. Fifty-seven (31%) died during follow-up, and 20 (35%) developed dementia before their death. All 3 biomarkers were independent predictors of incident dementia in all participants. After adjusting for the risk of dying, amyloid deposition and WMLs remained strong predictors. Of the 60 participants with incident dementia, 54 (90%) had at least one imaging abnormality. Participants with no biomarker positivity had a very low risk of dementia (16%), while 75% of the participants with the 3 biomarkers progressed to dementia. HIP volume and β-amyloid deposition were associated with death only in participants with MCI.
Conclusions
This study showed the presence of more than one biomarker was a stronger long-term predictor of incident dementia than any biomarker alone. After adjusting for the risk of dying, amyloid deposition and WMLs were stronger predictors of dementia than HIP volume. The risk of dying during follow-up was associated with both neurodegeneration and amyloid deposition, especially in individuals with MCI.
The brain pathology of Alzheimer disease (AD) is present long before the clinical symptoms of dementia manifest. Neuroimaging biomarkers that signal imminent progression from mild cognitive impairment (MCI) to dementia of the Alzheimer type include amyloid deposition and neurodegeneration.1–3 Similarly, white matter lesions (WMLs), which are markers of cerebral small vessel disease, are also risk factors for developing dementia in the elderly.4,5
The study of clinical outcomes of the combination of biomarkers is particularly important because it has been shown that the risk of incident dementia is increased in dementia-free individuals when 2 or more of the biomarkers are present.6 A recent report showed that by ages 70 to 89, 35% of the normal population had both β-amyloid (Aβ) deposition and neurodegeneration, and only 25% had neither biomarker.7 In addition, dementia-free individuals with the combination of Aβ deposition and a marker of neurodegeneration (i.e., hippocampal [HIP] volume) had a steeper rate of decline in cognitive testing during a 12-year follow-up.8
We have previously reported that Aβ deposition, HIP volume, and WMLs were independent predictors of progression to dementia after 2 years in individuals without dementia.6 Ninety-five percent of the individuals who developed dementia in that study had at least one imaging abnormality, 43% expressed the phenotype of combined Aβ deposition with small HIP volume, but only 19% expressed all 3 biomarkers (i.e., amyloid, HIP volume, WMLs). Other studies have found heterogeneity among the biomarkers predicting dementia—some individuals have predominantly HIP atrophy, others have a predominant Aβ pattern,9 and others a vascular pattern.10 In this report, we describe the relationship between these 3 biomarkers and outcome after more than 5 years of follow-up in this same study sample.6
This group has an average age of 85 years and thus has a high risk of death during follow-up. Consequently, to understand the biomarkers/risk of dementia, we must also understand their relationship to death. For example, HIP volume11 and WMLs12,13 are predictors of mortality in individuals younger than 80 years, and those with CSF markers of Aβ deposition and neuronal injury had increased risk of death.14 Thus, we examined the relationships between the biomarkers and clinical disease accounting for the competing risk of death.
Methods
Study sample
The present analyses were conducted in 183 participants without dementia who participated in the Ginkgo biloba memory study (GEM [Ginkgo Evaluation of Memory] Study) from 2000 to 2008.15,16 In 2009, 194 dementia-free participants from the Pittsburgh site underwent MRI and Pittsburgh compound B (PiB)-PET imaging. Eleven participants were excluded because of technical limitations.17 In 2010–2011, the participants were invited to continue with biannual neuroimaging studies and clinical and cardiovascular evaluations; the clinical examinations were done annually until 2014 and every 6 months thereafter.6 The mean follow-up time was 5.7 ± 1.7 years (range 0.14–6.9 years). Deaths were reported by the proxies when contacted for the annual visits and corroborated by death certificates.
Standard protocol approvals, registrations, and patient consents
The study protocol was approved by the institutional review board, and all participants completed the informed consent process before any study procedures.
PET imaging of brain Aβ deposition
PiB-PET data acquisition has been described previously.17 It involved 20-minute acquisition (4 × 5 minute frames) beginning 50 minutes after injection of 15 ± 1.5 mCi of PiB on a Siemens/CTI ECAT HR+ scanner (Knoxville, TN) in 3-dimensional imaging mode equipped with a Neuro-Insert. The data were reconstructed using filtered back-projection (Fourier rebinning and 2-dimensional back-projection with Hanning filter kernel full width at half maximum = 3 mm). Emission data were corrected for dead-timer photon attenuation, scatter, and radioactive decay. The final reconstructed PET image resolution was approximately 6 mm (transverse and axial). An iterative mild outlier cutoff method defined participants as Aβ-positive if the atrophy-corrected composite of 5 regions’ standardized uptake value ratio (SUVR) was >1.57,18 or PiB(+). Because Aβ deposition follows a regional pattern such that very early deposits may be missed by the dichotomous classification systems, we also treated Aβ deposition as a continuous variable composed of the mean PiB SUVR in these 5 regions bilaterally.17
Magnetic resonance imaging
MRI scanning was performed on a GE Signa 1.5T scanner with a standard head coil,19 including fluid-attenuated inversion recovery (echo time = 172, repetition time = 9,004, inversion time = 2,200, flip angle = 90, number of slices = 27, field of view = 200 × 150, in-plane resolution = 0.78 × 0.78) and spoiled echo gradient (sagittal, repetition time = 25, echo time = 5, flip angle = 40, field of view = 240 × 180 mm, slice thickness = 1.5 mm, number of slices = 124, in-plane resolution = 0.94 × 0.94 mm) images. Brain tissue volumes (gray matter, white matter, and CSF) were calculated by segmenting the skull-stripped T1-weighted image in native anatomical space using the FMRIB's Automated Segmentation Tool (FAST, FSL 4.1.4). Total intracranial volume (ICV) was computed as the volume contained within the “inner skull” using the Brain Extraction Tool with an advanced option (−A). HIP volumes were calculated using the automated labeling pathway, an atlas-based segmentation technique using a fully deformable registration approach to measure predefined regions of interest (ROIs),20 and anatomical ROIs were from the automated anatomical labeling atlas.21 HIP ROIs were defined on the reference brain (Montreal Neurological Institute colin27) and transformed to fit each individual's anatomical image; trilinear interpolation was used. Volumes were calculated as the number of cubic millimeter voxels. Here, we use the HIP volumes as the proportion of the ICV. A participant was considered to have small hippocampi (HIP[+]) when either the right or left hippocampus was <25th percentile of that in individuals who remained cognitively normal (CN) throughout follow-up. A fuzzy-connectedness algorithm was used to segment the WMLs from each individual's T2-weighted, fluid-attenuated inversion recovery images.22 The volume of WMLs is presented as the proportion of the ICV, and volumes >75th percentile of those in normal participants were considered abnormal, or WML(+). These classifications were done before the data analysis.
Clinical assessments
All participants underwent a neuropsychological evaluation in 2009 that included the Mini-Mental State Examination (MMSE)23 and a detailed neuropsychological battery.24 Symptoms of depression were measured with the Center for Epidemiologic Studies Depression Scale,25 and we obtained an inventory of the participant's prescription and over-the-counter medications.
Cognitive status
The cognitive diagnosis was determined by consensus among a neurologist, a psychiatrist, and a neuropsychologist, who were blinded to the 2009 neuroimaging results but who had available all clinical information from 2000 to 2015. The diagnosis of dementia was based on a deficit in test performance in 2 or more cognitive domains of sufficient severity to affect activities of daily living, with normal intellectual function before the onset of cognitive abnormalities.26 Participants with MCI were classified according to 4 MCI cognitive subtypes,27 although for the present study, they were considered as a single group.
Statistical analysis
Contingency tables were analyzed with χ2 test; t tests and nonparametric analysis of variance methods were used for continuous variables. We used exact methods to compute the significance levels of all tests when the sample size in a group fell below 20, and for the contingency tables based on the likelihood ratio test. Cox proportional hazard models controlling for age, MMSE, and sex were used to examine the association between the baseline pathologic markers and time to clinical dementia. These analyses were conducted with and without death as competing risk. All models were assessed for potential outliers/influential observations. When modeling the composite mean of the HIP and PiB values, we reported the hazard ratios (HRs) as per SD increment, and this has no effect on the significance level.
Data availability
Procedure for requesting shared resources
Any qualified investigator may contact the corresponding author with a specific request that includes details of the resources requested, how they will be used in the proposed research, and the qualifications of the investigator requesting the resources. Investigators may be asked to provide further details if necessary.
Review process
Requests for resources are reviewed at the next available monthly Pittsburgh Resource Sharing Committee meeting. Criteria discussed include (1) availability of the requested resource, (2) potential for duplication of ongoing studies, (3) scientific merit of the proposed research use, and (4) qualifications of the investigator/institution to conduct the research. Although the initial review process is typically completed within 60 days, the process often then becomes an iterative one between the committee and the requesting investigator to modify the amount of resource requested or, in the case of duplication, to modify the specific focus of the study or to facilitate collaborations between investigators interested in similar areas of research. In many cases, the investigator is urged to partner with a specific Pittsburgh investigator to better understand the availability and organization of data or resources and sometimes encouraged to formally include that person as an academic consultant or collaborator if that expertise does not already exist in the requesting investigator's research group. If the request is approved, data requests are sent to our database manager. The requesting investigator is asked to sign a “Data Use Agreement” that ensures the investigator will not share the resource(s) with a third party, will cite P01-AG025204 in any presentation or publication, and will comply with the general policies described above.
Results
Of the 183 participants, 30% were CN, 37% had MCI, and 33% were diagnosed with dementia at their last clinic visit. There were more conversions to dementia in the 2009-MCI group (65.7%) compared to those classified as CN (25%) in 2009 (χ2: 21.4, p < 0.0001). There were no age-adjusted correlations between PiB and HIP (rp: −0.11, p = 0.14) and WML (rp: −0.02, p = 0.75) volumes. Similarly, no significant partial correlations were noted between HIP and WML volumes (rp: 0.08, p = 0.29). The incidence of dementia increased from 56.07/1,000 person-years (Pys) among individuals younger than 84 years to 96.5/1,000 Pys among those older than 86 years (table e-1, links.lww.com/WNL/A460).
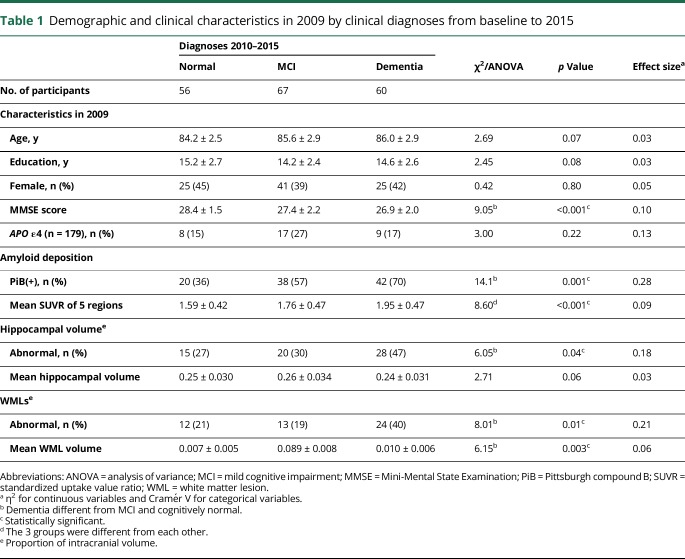
Of the 60 participants who developed dementia during follow-up, 22% went directly from CN to dementia, 40% went through MCI to dementia, and 38% went directly from MCI to dementia. Participants with incident dementia had lower baseline MMSE scores than participants who remained CN. Participants with dementia or MCI at follow-up were more likely to be PiB(+) and had a higher mean PiB SUVR at baseline (table 1). Participants with incident dementia were more likely to be HIP(+) than those who remained CN (odds ratio 2.39, 95% confidence interval [CI] 1.10–5.21, p = 0.035), and no differences were noted between CN and MCI groups. The mean HIP volume was not different among the 3 diagnostic groups with a small effect size (η2 = 0.03). Participants with incident dementia were more likely to be WML(+) compared to those who remained CN (odds ratio 2.44, 95% CI 1.07–5.56, p = 0.04), and the WML volume was greater for participants with MCI and dementia than for CN participants.
Table 1.
Demographic and clinical characteristics in 2009 by clinical diagnoses from baseline to 2015
We examined the co-occurrence of dichotomized biomarkers in 2009 as a function of clinical outcome (table e-2, links.lww.com/WNL/A460); 77% of all 183 participants, 90% of those who converted to dementia, had at least one abnormal biomarker at baseline, and 11 (6%) had all 3 biomarkers. Conversion to dementia occurred in participants with none (n = 6), 1 (n = 22), or 2 or 3 (n = 32) biomarkers. The incidence of dementia varied from 37/1,000 Pys among the individuals with no abnormalities to 215/1,000 Pys for those with 3 biomarker abnormalities (table e-2A). Among the participants with no biomarker positivity (n = 43), 7 (16%) developed dementia, while 9/11 (75%) of those with the 3 biomarkers did. The participants who were CN in 2009 and had no biomarker positivity were relatively unlikely to develop dementia (6/39 [15%]) (table e-2B), whereas 71% (n = 5/7) of those with the 3 biomarkers developed dementia during follow-up. There were few participants with MCI in 2009 (n = 35), and only 4 (10.5%) were biomarker negative and had no conversion to dementia. By contrast, 3/4 (75%) with the 3 biomarkers progressed to dementia (table e-2C). We examined the mean PiB SUVR in relationship to co-occurrence of dichotomized biomarkers in 2009 and clinical outcome (table e-3). Twenty-three percent of all participants were biomarker negative, and 6% had all 3 biomarkers.
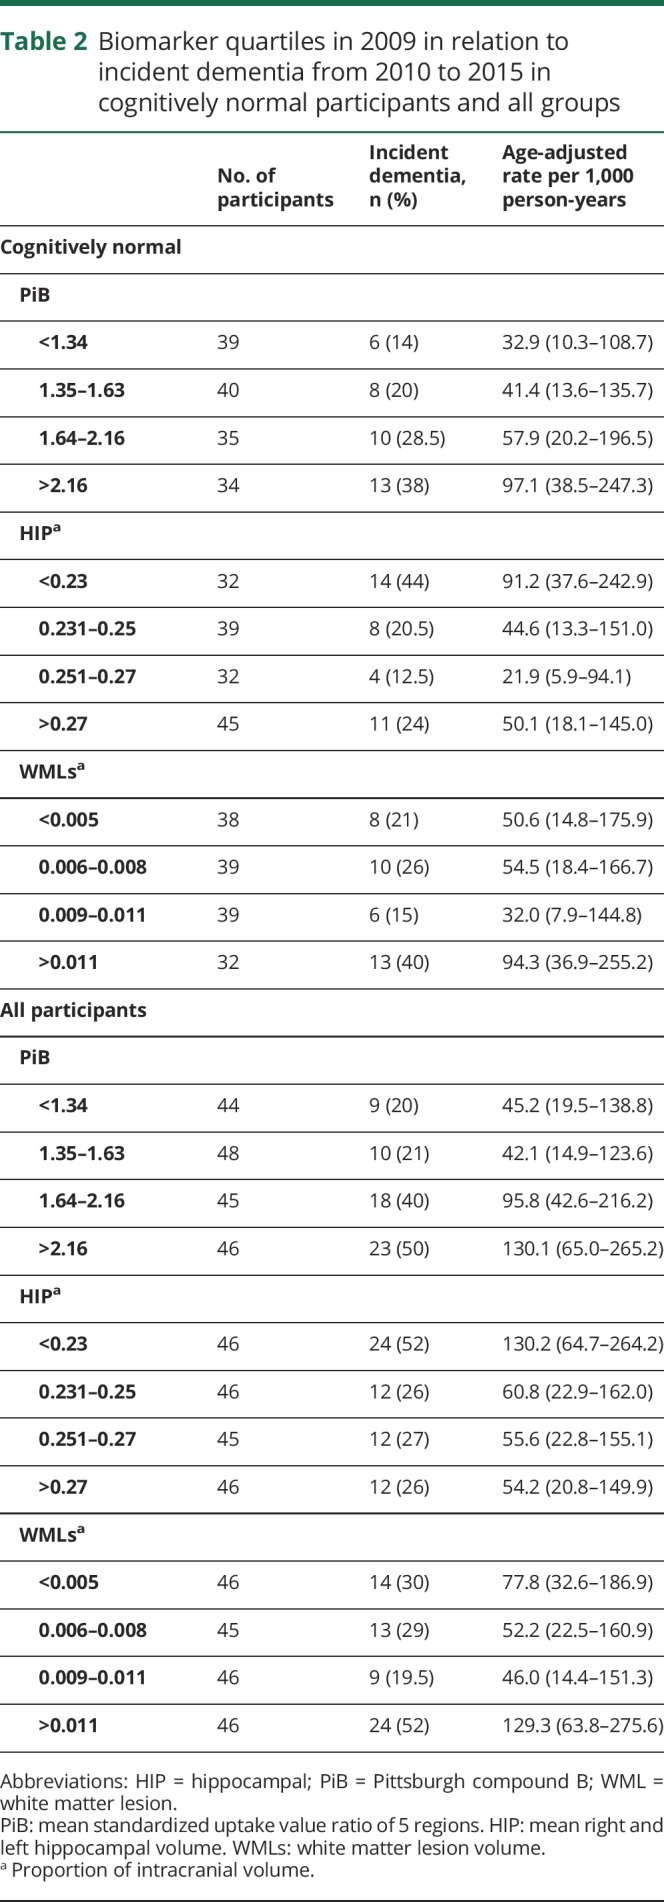
There was a linear relationship between incident dementia and PiB from 32.1/1,000 Pys in the lowest quartile to 97.1/1,000 Pys in the highest quartile (p = 0.02 for linear trend) in CN participants in 2009 (table 2). The association between dementia and HIP volume was mainly in the lowest quartile (91.2/1,000 Pys, p = 0.08 for linear trend) and with WML volume in the highest quartile (94.4/1,000 Pys, p = 0.18 for linear trend). Results were similar when both CN and MCI participants were included in the analysis.
Table 2.
Biomarker quartiles in 2009 in relation to incident dementia from 2010 to 2015 in cognitively normal participants and all groups
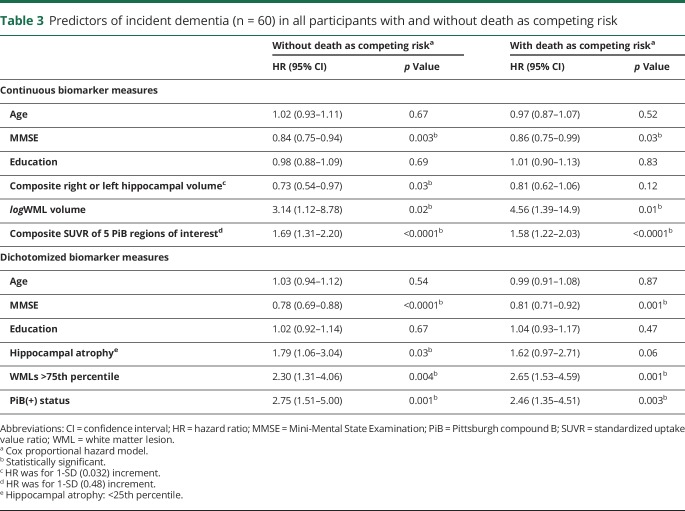
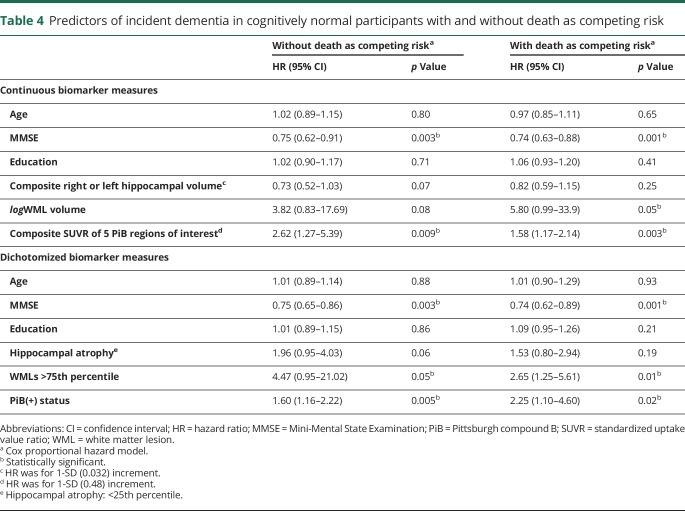
We used Cox proportional hazard models with and without death as competing risk to examine the relationship between presence of the 3 biomarker abnormalities and incident dementia among all study participants (table 3). Among all participants, the risk of developing dementia was associated with low MMSE scores. Continuous and dichotomized variables of the 3 biomarkers were associated with incident dementia in all participants in the analysis without death as competing risk. When death was a competing risk, amyloid deposition and WMLs remained as significant predictors of incident dementia. HIP volume remained related to risk of dementia but not significant. Continuous variables of the 3 biomarkers were associated with incident MCI in CN participants (tables e-3 and e-4, links.lww.com/WNL/A460). Similarly, amyloid deposition and WMLs were predictors of dementia in CN participants (table 4). The Kaplan-Meier survival curves showing incidence of dementia in the CN and all other participants are shown in figures e-1 and e-2 (links.lww.com/WNL/A459).
Table 3.
Predictors of incident dementia (n = 60) in all participants with and without death as competing risk
Table 4.
Predictors of incident dementia in cognitively normal participants with and without death as competing risk
Thirty-one percent of the original 183 study participants died during follow-up. Those who died were significantly older at baseline than those who remained alive to the end of observation. There were no significant differences between those who survived through follow-up in education, sex, MMSE score, or APOE genotypes (table e-5, links.lww.com/WNL/A460). Twenty of these 57 individuals (i.e., 35%) developed dementia before their death.
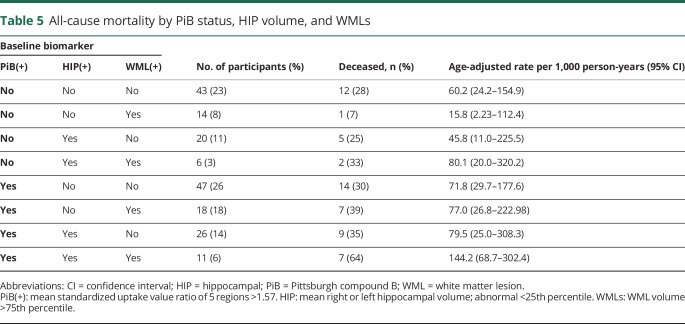
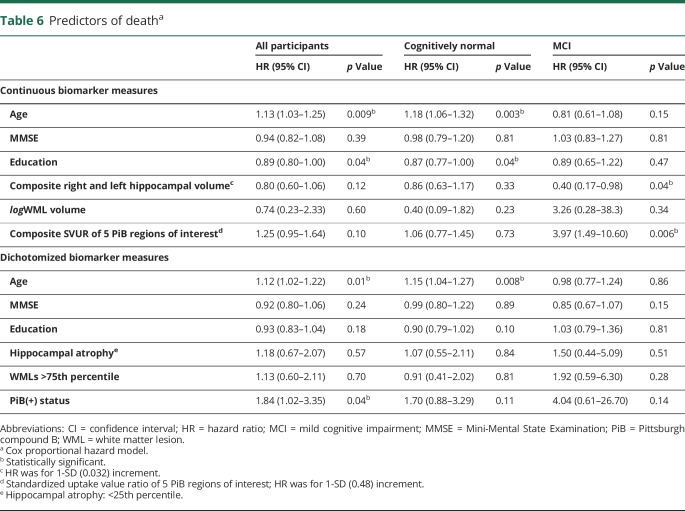
All-cause mortality increased from 33.0/1,000 Pys in individuals younger than 84 years to 99.8/1,000 Pys in those older than 87 years (table 5). Among individuals in whom all 3 biomarkers were present, 63.6% died during follow-up, with age-adjusted rate of 144.2/1,000 Pys, as compared to 12 (28%) deaths and an age-adjusted death rate of 60.2/1,000 Pys for participants with no biomarker positivity (table 5). However, because of the small number of deaths in each category, confidence limits around the point estimates were large. A Cox regression model including HIP, WMLs, PiB, age, MMSE score, and education level showed that age was a significant predictor of death in all study participants, as was PiB positivity (HR 1.84, 95% CI 1.02–3.35) (table 6). Among individuals who were CN at baseline, only age and education level predicted time until death, while continuous measures of HIP volume (HR 0.40, 95% CI 0.17–0.98) and amyloid deposition predicted death (HR 3.97, 95% CI 1.49–10.6) in the MCI group.
Table 5.
All-cause mortality by PiB status, HIP volume, and WMLs
Table 6.
Predictors of deatha
Discussion
This study showed that the presence of more than one biomarker was a stronger long-term predictor of incident dementia than any biomarker alone, and the absence of all 3 biomarkers was associated with a very low risk of dementia. The risk of dementia among the CN in 2009 was linearly related to the extent of amyloid deposition, with almost a 3-fold increased difference in risk between the lowest and highest quartiles. The risk of dementia was inversely related to HIP volume, with much of the association limited to the lowest quartile, and to higher amounts of WMLs. After adjusting for demographic characteristics, incident dementia was associated with the baseline presence of the 3 biomarkers. However, after adjusting for the risk of dying during follow-up, amyloid deposition and WMLs were stronger predictors than HIP volume. The risk of dementia, as expected, was strongly related to MCI status at baseline. Finally, the risk of dying during follow-up was associated with older age, HIP volume, and the presence of amyloid deposition in the brain, especially in individuals with MCI.
Our findings are consistent with previous observations that more advanced AD cerebral pathology and clinical disease are associated with mortality.14 Our failure to observe an association between WMLs and death may be attributable to selective survival in the sample. We originally recruited in 2000, and the participants had to be free of dementia and willing and able to have MRI and PET imaging in 2009. WMLs are a marker of cerebral small vessel disease, and those individuals with significant cardio/cerebrovascular disease may have died before study enrollment or may have been unable to enroll in the project. This would mean we would be following healthier participants.
The finding that 81% of the CN participants who converted to dementia had at least one biomarker present confirms the notion that some pathology leading to AD is likely present years before the clinical symptoms develop. However, which biomarker was abnormal did not seem to matter. Among the CN individuals, those who had evidence of amyloid deposition, either alone or in combination with the other 2 biomarkers, had a 32% conversion rate to dementia. Similar rates were found for HIP(+) (33%) and WML(+) (37%) alone or in combination.
These findings reinforce the point that multiple pathologies—amyloidosis, neurodegeneration, and vascular disease—each contribute to the expression of clinical dementia in the elderly.28,29 We show here that there is an additive effect—75% of the participants with all 3 abnormal biomarkers progressed to dementia compared with 43% with 2 abnormal biomarkers and 27% with only one abnormal biomarker present.
WMLs, as a marker of small vessel disease in the brain, are common in old age and are a risk factor for both MCI30 and dementia.4 Incident dementia in all participants with WMLs alone was relatively low (21%) but was more than 50% when WMLs occurred in combination with other biomarkers. These findings suggest that vascular pathology augments the effect of AD pathology and accelerates the transition to dementia.31,32
MCI is a risk factor for conversion to dementia. We divided the incident dementia cases into those that had occurred within the first 2.5 years and those from 2.5 to 5 years. Of the 60 incident dementia cases, 18 occurred in the first 2.5 years and 42 after 2.5 years. Among the 38 participants with MCI in 2009, 11 (29%) developed incident dementia within the first 2.5 years and 12 (31.5%) after 2.5 years. By contrast, among the CN, 7 (5%) participants developed dementia within the first 2.5 years and 30 (21%) after 2.5 years. Of the 18 individuals who developed dementia within the first 2.5 years, 11 (61%) were MCI at baseline. By contrast, 12 (28.5%) of the 42 individuals who developed dementia after 2.5 years were MCI at baseline. The risk of dementia was very high for participants with MCI as compared to CN individuals, whether the dementia occurred rapidly or more slowly.
The determination of biomarker abnormality was made as long as 5+ years from the development of a dementia syndrome. While this addresses the question of long-term prediction of clinical change, it does not tell us whether there are additional changes to biomarker status in the time immediately prior to expression of dementia or the sequence of events that lead to dementia. The attenuated effect of HIP atrophy as a risk factor for incident dementia should be interpreted with caution, since the point estimates of dementia risk were similar in the models with and without death as competing risk, and the confidence limits substantially overlapped.
This is one of the first long-term studies to evaluate neuroimaging risks of dementia. The strengths of the study include careful annual clinical evaluations of dementia, almost complete ascertainment, relatively long follow-up (5+ years), and further evaluation of death as a competing risk of dementia. Of note, a small number of individuals aged 85 and older remained free of amyloid deposition, HIP atrophy, and WMLs, and had very low risk of dementia even into age 90 and older. One limitation of this study was that the hypothesis tested primarily relates to MRI and PET imaging, and no other risk factors were included in the analyses (e.g., hypertension).13 In addition, while we focused on well-established summary MRI measures, other areas of the brain associated with incident dementia were not examined33,34; whole-brain, voxel-wise analysis would also be informative to more fully understand the regional variation in these changes.33,34
Glossary
- Aβ
β-amyloid
- AD
Alzheimer disease
- CI
confidence interval
- CN
cognitively normal
- HIP
hippocampal
- HR
hazard ratio
- ICV
intracranial volume
- MCI
mild cognitive impairment
- MMSE
Mini-Mental State Examination
- PiB
Pittsburgh compound B
- Pys
person-years
- ROI
region of interest
- SUVR
standardized uptake value ratio
- WML
white matter lesion
Author contributions
Design or conceptualization of the study: Oscar L. Lopez, James T. Becker, YueFang Chang, William E. Klunk, Chester Mathis, Julia Price, Howard J. Aizenstein, Beth Snitz, Ann D. Cohen, Steven T. DeKosky, Milos Ikonomovic, M. Ilyas Kamboh, and Lewis H. Kuller. Analysis or interpretation of the data: Oscar L. Lopez, James T. Becker, YueFang Chang, William E. Klunk, and Lewis H. Kuller. Drafting or revising the manuscript for intellectual content: Oscar L. Lopez, James T. Becker, YueFang Chang, William E. Klunk, Chester Mathis, Julia Price, Howard J. Aizenstein, Beth Snitz, Steven T. DeKosky, Ann D. Cohen, Milos Ikonomovic, M. Ilyas Kamboh, and Lewis H. Kuller.
Study funding
This work was supported, in part, by grants P50AG05133, R37 AG025516, and P01 AG025204 from the National Institute on Aging, and U01 AT000162 from the National Center for Complementary and Alternative Medicine.
Disclosure
O. Lopez served as a consultant for Lundbeck, Grifols, and Raman Technologies. J. Becker and Y. Chang report no disclosures relevant to the manuscript. W. Klunk served as a consultant for GE Healthcare. GE Healthcare holds a license agreement with the University of Pittsburgh based on the technology described in this manuscript. Dr. Klunk is a coinventor of PiB and, as such, has a financial interest in this license agreement. C. Mathis served as a consultant for GE Healthcare. GE Healthcare holds a license agreement with the University of Pittsburgh based on the technology described in this manuscript. Dr. Mathis is a coinventor of PiB and, as such, has a financial interest in this license agreement. J. Price, H. Aizenstein, B. Snitz, and A.D. Cohen report no disclosures relevant to the manuscript. S. DeKosky serves on the advisory boards of Acumen Pharmaceuticals, Amgen, Inc., and Cognition Therapeutics, and chairs a drug monitoring committee for Biogen Idec. M. Ikonomovic, M. Kamboh, and L. Kuller report no disclosures relevant to the manuscript. Go to Neurology.org/N for full disclosures.
References
- 1.Knopman DS, Jack CR Jr, Wiste HJ, et al. Short-term clinical outcomes for stages of NIA-AA preclinical Alzheimer disease. Neurology 2012;78:1576–1582. [DOI] [PMC free article] [PubMed] [Google Scholar]
- 2.Villemagne VL, Pike KE, Chételat G, et al. Longitudinal assessment of Aβ and cognition in aging and Alzheimer disease. Ann Neurol 2011;69:181–192. [DOI] [PMC free article] [PubMed] [Google Scholar]
- 3.Wolk DA, Price JC, Saxton J, et al. Amyloid imaging in mild cognitive impairment subtypes. Ann Neurol 2009;65:557–568. [DOI] [PMC free article] [PubMed] [Google Scholar]
- 4.Kuller LH, Lopez OL, Newman A, et al. Risk factors for dementia in the cardiovascular health cognition study. Neuroepidemiology 2003;22:13–22. [DOI] [PubMed] [Google Scholar]
- 5.Brickman AM, Provenzano FA, Muraskin J, et al. Regional white matter hyperintensity volume, not hippocampal atrophy, predicts incident Alzheimer disease in the community. Arch Neurol 2012;69:1621–1627. [DOI] [PMC free article] [PubMed] [Google Scholar]
- 6.Lopez OL, Klunk WE, Mathis C, et al. Amyloid, neurodegeneration, and small vessel disease as predictors of dementia in the oldest-old. Neurology 2014;83:1804–1811. [DOI] [PMC free article] [PubMed] [Google Scholar]
- 7.Roberts RO, Knopman DS, Syrjanen JA, et al. Weighting and standardization of frequencies to determine prevalence of AD imaging biomarkers. Neurology 2017;89:2039–2048. [DOI] [PMC free article] [PubMed] [Google Scholar]
- 8.Zhao Y, Tudorascu DL, Lopez OL, et al. Amyloid β deposition and suspected non-Alzheimer pathophysiology and cognitive decline patterns for 12 years in oldest old participants without dementia. JAMA Neurol 2018;75:88–96. [DOI] [PMC free article] [PubMed] [Google Scholar]
- 9.Jack CR Jr, Wiste HJ, Knopman DS, et al. Rates of β-amyloid accumulation are independent of hippocampal neurodegeneration. Neurology 2014;82:1605–1612. [DOI] [PMC free article] [PubMed] [Google Scholar]
- 10.Villeneuve S, Reed BR, Madison CM, et al. Vascular risk and Aβ interact to reduce cortical thickness in AD vulnerable brain regions. Neurology 2014;83:40–47. [DOI] [PMC free article] [PubMed] [Google Scholar]
- 11.Ikram MA, Vrooman HA, Vernooij MW, et al. Brain tissue volumes in the general elderly population. The Rotterdam Scan Study. Neurobiol Aging 2008;29:882–890. [DOI] [PubMed] [Google Scholar]
- 12.van der Holst HM, van Uden IW, Tuladhar AM, et al. Factors associated with 8-year mortality in older patients with cerebral small vessel disease: the Radboud University Nijmegen Diffusion Tensor and Magnetic Resonance Cohort (RUN DMC) study. JAMA Neurol 2016;73:402–409. [DOI] [PubMed] [Google Scholar]
- 13.Kuller LH, Lopez OL, Becker JT, Chang Y, Newman AB. Risk of dementia and death in the long-term follow-up of the Pittsburgh cardiovascular health study–cognition study. Alzheimers Dement 2016;12:170–183. [DOI] [PMC free article] [PubMed] [Google Scholar]
- 14.Vos SJ, Xiong C, Visser PJ, et al. Preclinical Alzheimer's disease and its outcome: a longitudinal cohort study. Lancet Neurol 2013;12:957–965. [DOI] [PMC free article] [PubMed] [Google Scholar]
- 15.Fitzpatrick AL, Fried LP, Williamson J, et al. Recruitment of the elderly into a pharmacologic prevention trial: the Ginkgo Evaluation of Memory Study experience. Contemp Clin Trials 2006;27:541–553. [DOI] [PubMed] [Google Scholar]
- 16.DeKosky ST, Williamson JD, Fitzpatrick AL, et al. Ginkgo biloba for prevention of dementia: a randomized controlled trial. JAMA 2008;300:2253–2262. [DOI] [PMC free article] [PubMed] [Google Scholar]
- 17.Mathis CA, Kuller LH, Klunk WE, et al. In vivo assessment of amyloid-β deposition in nondemented very elderly subjects. Ann Neurol 2013;73:751–761. [DOI] [PMC free article] [PubMed] [Google Scholar]
- 18.Aizenstein HJ, Nebes RD, Saxton JA, et al. Frequent amyloid deposition without significant cognitive impairment among the elderly. Arch Neurol 2008;65:1509–1517. [DOI] [PMC free article] [PubMed] [Google Scholar]
- 19.Price JC, Klunk WE, Lopresti BJ, et al. Kinetic modeling of amyloid binding in humans using PET imaging and Pittsburgh compound-B. J Cereb Blood Flow Metab 2005;25:1528–1547. [DOI] [PubMed] [Google Scholar]
- 20.Wu Y, Storey P, Cohen BA, Epstein LG, Edelman RR, Ragin AB. Diffusion alterations in corpus callosum of patients with HIV. Am J Neuroradiol 2006;27:656–660. [PMC free article] [PubMed] [Google Scholar]
- 21.Carmichael O, Aizenstein HJ, Davis SW, et al. Atlas-based hippocampus segmentation in Alzheimer's disease and mild cognitive impairment. Neuroimage 2005;27:979–990. [DOI] [PMC free article] [PubMed] [Google Scholar]
- 22.Wu M, Rosano C, Butters M, et al. A fully automated method for quantifying and localizing white matter hyperintensities on MR images. Psychiatry Res 2006;148:133–142. [DOI] [PMC free article] [PubMed] [Google Scholar]
- 23.Folstein MF, Folstein SE, McHugh PR. “Mini-Mental State”: a practical method for grading the cognitive state of patients for the clinician. J Psychiatr Res 1975;12:189–198. [DOI] [PubMed] [Google Scholar]
- 24.Snitz BE, O'Meara ES, Carlson MC, et al. Ginkgo biloba for preventing cognitive decline in older adults: a randomized trial. JAMA 2009;302:2663–2670. [DOI] [PMC free article] [PubMed] [Google Scholar]
- 25.Radloff LS, Teri L. Use of the Center for Epidemiological Studies–Depression Scale with older adults. Clin Gerontol 1986;5:119–137. [Google Scholar]
- 26.Lopez OL, Becker JT, Klunk W, et al. Research evaluation and diagnosis of probable Alzheimer's disease over the last two decades: I. Neurology 2000;55:1854–1862. [DOI] [PubMed] [Google Scholar]
- 27.Petersen RC. Mild cognitive impairment as a diagnostic entity. J Intern Med 2004;256:183–194. [DOI] [PubMed] [Google Scholar]
- 28.Kawas CH, Kim RC, Sonnen JA, Bullain SS, Trieu T, Corrada MM. Multiple pathologies are common and related to dementia in the oldest-old: the 90+ Study. Neurology 2015;85:535–542. [DOI] [PMC free article] [PubMed] [Google Scholar]
- 29.Neuropathology Group, Medical Research Council Cognitive Function and Aging Study. Pathological correlates of late-onset dementia in a multicentre, community-based population in England and Wales. Neuropathology Group of the Medical Research Council Cognitive Function and Ageing Study (MRC CFAS). Lancet 2001;357:169–175. [DOI] [PubMed] [Google Scholar]
- 30.Lopez OL, Jagust WJ, Dulberg C, et al. Risk factors for mild cognitive impairment in the Cardiovascular Health Study Cognition Study: part 2. Arch Neurol 2003;60:1394–1399. [DOI] [PubMed] [Google Scholar]
- 31.Marchant NL, Reed BR, Sanossian N, et al. The aging brain and cognition: contribution of vascular injury and Aβ to mild cognitive dysfunction. JAMA Neurol 2013;70:488–495. [DOI] [PMC free article] [PubMed] [Google Scholar]
- 32.Vemuri P, Lesnick TG, Przybelski SA, et al. Vascular and amyloid pathologies are independent predictors of cognitive decline in normal elderly. Brain 2015;138:761–771. [DOI] [PMC free article] [PubMed] [Google Scholar]
- 33.Zeifman LE, Eddy WF, Lopez OL, et al. Voxel level survival analysis of grey matter volume and incident mild cognitive impairment or Alzheimer's disease. J Alzheimers Dis 2015;46:167–178. [DOI] [PMC free article] [PubMed] [Google Scholar]
- 34.Hall AM, Moore RY, Lopez OL, Kuller LH, Becker JT. Basal forebrain atrophy is a presymptomatic marker for Alzheimer's disease. Alzheimers Dement 2008;4:271–279. [DOI] [PMC free article] [PubMed] [Google Scholar]
Associated Data
This section collects any data citations, data availability statements, or supplementary materials included in this article.
Data Availability Statement
Procedure for requesting shared resources
Any qualified investigator may contact the corresponding author with a specific request that includes details of the resources requested, how they will be used in the proposed research, and the qualifications of the investigator requesting the resources. Investigators may be asked to provide further details if necessary.
Review process
Requests for resources are reviewed at the next available monthly Pittsburgh Resource Sharing Committee meeting. Criteria discussed include (1) availability of the requested resource, (2) potential for duplication of ongoing studies, (3) scientific merit of the proposed research use, and (4) qualifications of the investigator/institution to conduct the research. Although the initial review process is typically completed within 60 days, the process often then becomes an iterative one between the committee and the requesting investigator to modify the amount of resource requested or, in the case of duplication, to modify the specific focus of the study or to facilitate collaborations between investigators interested in similar areas of research. In many cases, the investigator is urged to partner with a specific Pittsburgh investigator to better understand the availability and organization of data or resources and sometimes encouraged to formally include that person as an academic consultant or collaborator if that expertise does not already exist in the requesting investigator's research group. If the request is approved, data requests are sent to our database manager. The requesting investigator is asked to sign a “Data Use Agreement” that ensures the investigator will not share the resource(s) with a third party, will cite P01-AG025204 in any presentation or publication, and will comply with the general policies described above.


