Abstract
Purpose.
To investigate the optical intensities of all retinal layers on three-dimensional (3D) spectral-domain optical coherence tomography (SD-OCT) in normal subjects using an automatic measurement.
Methods.
Forty normal subjects underwent Topcon 3D OCT-1000 macula-centered scan. The raw data were automatically segmented into 10 layers using the 3D graph search approach. Then the mean and standard deviation of intensities of each layer were calculated. The image quality index was given by the OCT software. Correlation analysis was performed between the optical intensities in each layer and image quality and subject's age.
Results.
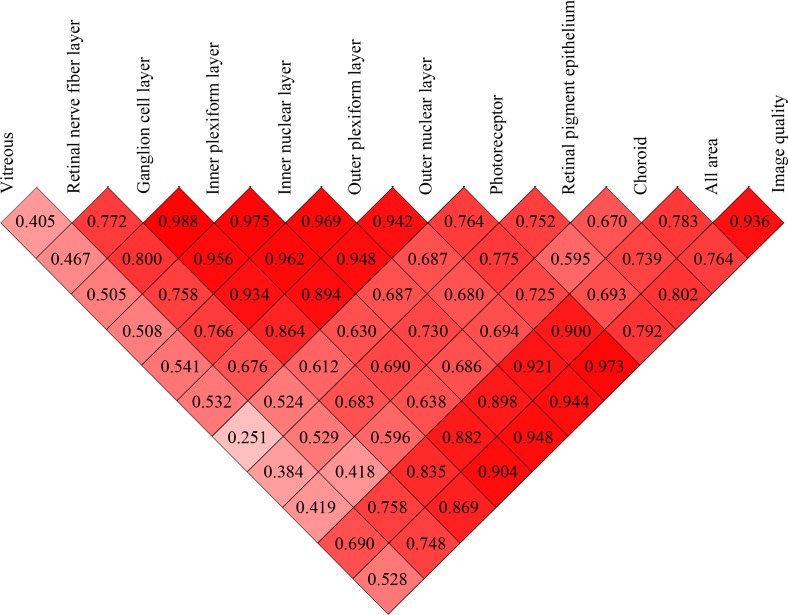
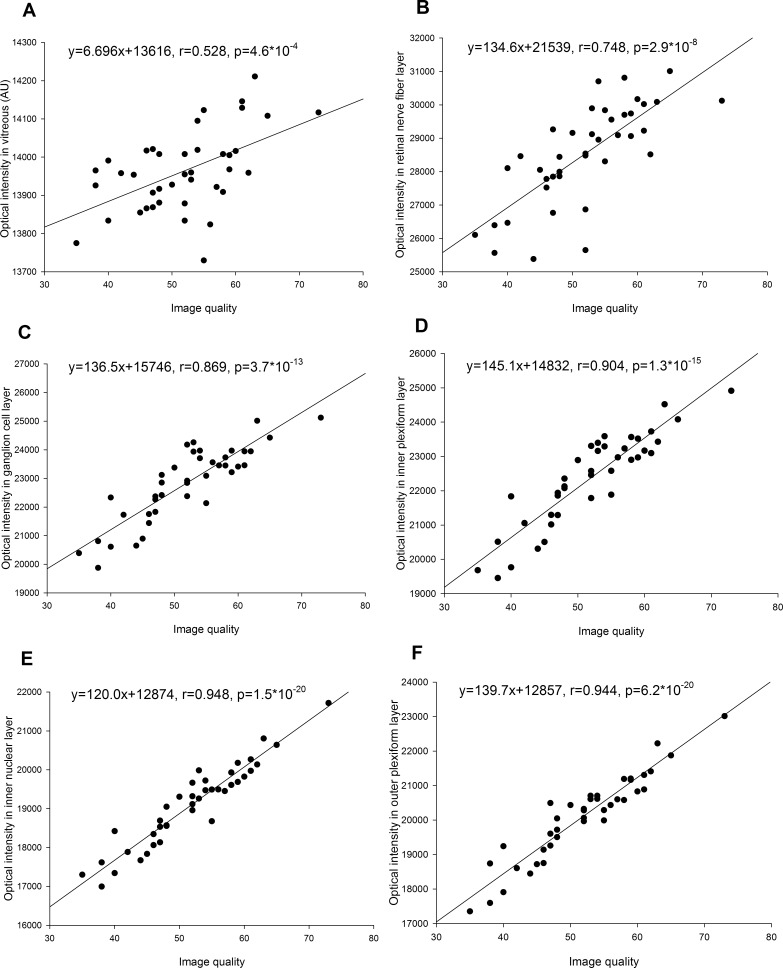
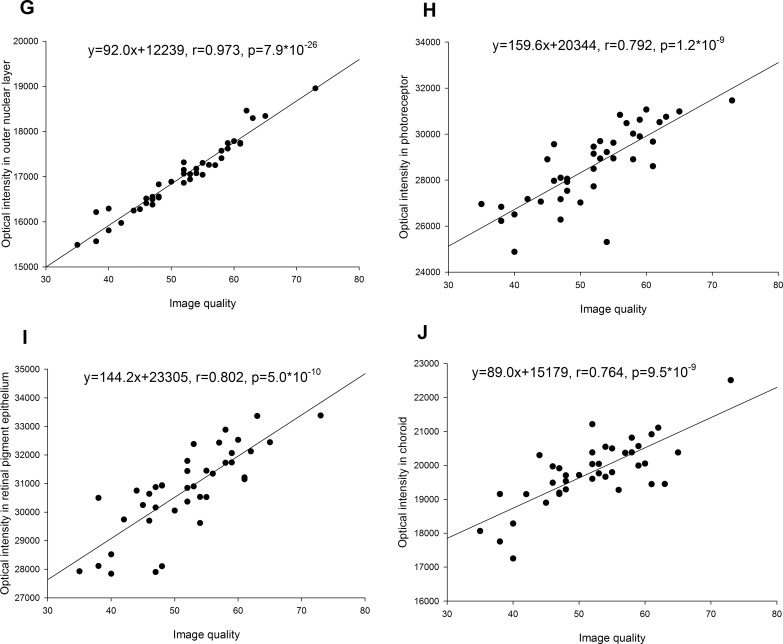
The correlation of optical intensities was strong from ganglion cell layer (GCL) to outer nuclear layer (ONL) with r > 0.934; moderate among retinal nerve fiber layer (RNFL), photoreceptor, retinal pigment epithelium (RPE), and choroid (0.410 < r < 0.800); and low in the vitreous (0.251 < r < 0.541). The optical intensities were also correlated with the image quality, r > 0.869 from GCL to ONL, 0.748 < r < 0.802 for RNFL, photoreceptor layer, RPE, and the choroid, r = 0.528 for the vitreous. The optical intensity in RNFL was negatively correlated with age (r = −0.365).
Conclusions.
Automatic assessment of the layers' intensities was achieved. In normal subjects, the retinal layers' optical intensities were affected by image quality. Normalization with optical intensity of ONL, all areas, or image quality index is recommended. The optical intensity of RNFL decreased with age.
Keywords: optical coherence tomography, image analysis, optical intensity, macula
Our study established automatic assessment of optical intensities of intraretinal layers on 3D-OCT. The optical intensities of intraretinal layers were correlated with each other and with image quality; normalization for optical intensity with image quality or internal reference is necessary.
Introduction
Optical coherence tomography (OCT) provides in vivo, three-dimensional (3D), high-speed and high-resolution cross-sectional imaging of anterior and posterior eye structure.1 It has significantly improved our understanding of eye physiology and the pathogenesis of various ocular diseases and helped in disease diagnosis and management.2 Optical coherence tomography not only provides high-definition imaging of the morphology of normal or diseased eye tissue, but also makes quantitative measurement available. Currently, there are two automatic measurements provided by most commercial OCT machines: peripapillary retinal nerve fiber layer (RNFL) thickness and total retinal thickness. Advanced image analysis further provides measurement of optic nerve head,3 macular ganglion cell complex,4 choroidal thickness,5 and so on. The caliper function is also provided by commercially available OCT software to manually measure the size of macular hole and make other distance-based measurements.
Currently, most of the available OCT quantitative measurements provide spatially dimensional parameters. Optical coherence tomography images, however, deliver two basic types of information: dimension and signal/reflection intensity. Measurement of optical intensity on OCT may provide additional information augmenting morphology-based quantitative characteristics. It has been qualitatively observed that OCT optical intensity changes in several ocular diseases. For example, optical intensity of inner retina increases in retinal artery occlusion.6 In age-related macular degeneration, the optical intensity increases with development and regression of choroidal neovascularization.7 However, quantitative assessment of OCT intensity remains much less reported compared to morphologic analysis. In 2000, Pons et al.8 reported that the internal reflectivity of RNFL was lower in patients with glaucoma compared to controls. This observation was recently confirmed using spectral-domain OCT.9,10 The optical intensity was also quantitatively investigated in subretinal space,11,12 photoreceptor,13 and intraretinal space14 and in choroidal neovascularization.15 Outside the retina, it has also been investigated in filtering blebs16 and posterior capsule.17 However, to the best of our knowledge, no study has been devoted to optical intensities of retinal layers in normal subjects. Our work is an attempt to overcome the lack of such information about the normal ranges and physiological variations of optical intensities in individual retinal layers.
In this study, we developed an automatic, 3D measurement of the optical intensities in all retinal layers segmented on spectral-domain OCT using an extended research version of the Iowa Reference Algorithm (Retinal Image Analysis Lab, Iowa Institute for Biomedical Imaging, Iowa City, IA).18–22 Using this technique, we investigated the variations of and relationships among retinal layer optical intensities in normal subjects.
Methods
Study Subjects
This study was approved by the Institutional Review Board of Joint Shantou International Eye Center (JSIEC), Shantou University and the Chinese University of Hong Kong, and adhered to the tenets of the Declaration of Helsinki. Because of its retrospective nature, informed consent was not required from subjects. The medical records and OCT database of JSIEC from January 2012 to October 2012 were searched and reviewed. The inclusion criteria were as follows: The eye received a comprehensive ophthalmic examination including Topcon 3D-OCT; the eye was normal (cataract, corneal opacity, or refractive error between −6 diopters [D] and 6 D was allowed); the retinal structure was normal on fundus examination and OCT; the best corrected visual acuity (BCVA) was at least 20/40 to make sure the subject had good fixation and to exclude severe cataract. The exclusion criteria were high myopia or high hyperopia with refractive error more than 6 D, which may have aboral retinal structure; and glaucoma or retinal disease.
Optical Coherence Tomography
Spectral-domain OCT examination was performed using Topcon 3D OCT-1000 (Topcon Corporation, Tokyo, Japan). Macula was scanned using standard 6- × 6-mm protocol, in which 3D acquisition consisted of 64 B-scan slices. Axial and transverse resolution was 6 and 20 μm, respectively. A fundus photograph was obtained at the same time. The OCT image size was 512 × 64 × 480 voxels, or 11.72 × 93.75 × 3.50 μm. Image quality index was provided by the onboard OCT software. This is a quantitative parameter representing the signal strength of the scanned multiframe image; the algorithm is proprietary to the manufacturer and not publicly available. Raw, unprocessed data were exported from the OCT machine in .fds format for analysis.
Image Analysis
Eleven surfaces were automatically segmented using a validated 3D graph search approach.18–22 The following layers were obtained between the surfaces: vitreous, RNFL, ganglion cell layer (GCL), inner plexiform layer (IPL), inner nuclear layer (INL), outer plexiform layer (OPL), outer nuclear layer (ONL), photoreceptor, and retinal pigment epithelium (RPE). Choroid was defined as a region 25 pixels wide immediately under the RPE; see Figure 1. Layer-specific mean intensities were calculated for each layer in each individual. Interpreting the raw scan data as 16-bit grayscale images resulted in 65,536 levels of gray, ranging from 0 to 65,535. Because raw data were used, intensity was expressed in arbitrary units (AU) instead of decibels.
Figure 1. .
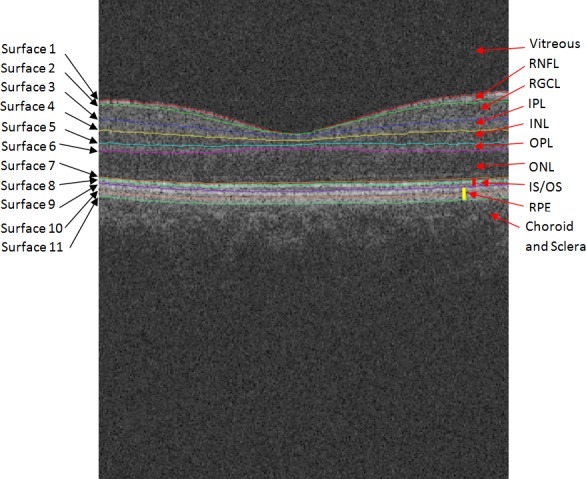
Segmented surfaces and regions on macular spectral-domain optical coherence tomography.
Statistical Analysis
The mean and standard deviation of optical intensities in all subjects were calculated for each layer. The optical intensities of all layers were compared between male and female subgroups by Student's independent t-test. Pairwise correlations between the mean intensities of all layers, as well as layer-based image intensity correlations with age and/or image quality index, were analyzed using Pearson's correlation. Correlation coefficient r was calculated. Multivariate regression analysis was used to adjust the effect of image quality on optical intensity. The adjusted variance considered image quality as normalizing parameter and was calculated as variance × (1 − r2with_image_quality). Adjusted standard deviation was calculated as square root of the adjusted variance. Adjusted coefficient of variation was calculated as adjusted standard deviation over the mean. Statistical Product and Service Solutions (SPSS) statistical software (version 16.0; IBM, Armonk, NY) was used to conduct the statistical analyses. Statistical software R (version 2.15.2; provided in the public domain at http://www.r-project.org/) and Sigmaplot (version 12.0; Systat, Inc., Chicago, IL) were used to draw plots.
Results
Forty subjects were included in this study, 23 males and 17 females. The mean age was 37.9 ± 14.9 years (range, 7–65 years). The mean image quality was 51.8 ± 8.3. The mean, standard deviation, and variance of different layers' optical intensities are listed in the Table.
Table. .
Mean and Standard Deviation of Optical Intensities in Different Layers
|
Mean |
SD |
Variance |
R2 |
Adjusted Variance |
Adjusted SD |
Adjusted Coefficient of Variation |
|
| Vitreous | 13,963.5 | 105.0 | 11,032 | 27.9% | 7,955 | 89.2 | 0.0064 |
| Retinal nerve fiber layer | 28,516.5 | 1491.2 | 2,223,605 | 55.9% | 980,035 | 990.0 | 0.0347 |
| Retinal ganglion cells | 22,821.3 | 1301.4 | 1,693,558 | 75.5% | 415,076 | 644.3 | 0.0282 |
| Inner plexiform layer | 22,351.7 | 1329.1 | 1,766,570 | 81.8% | 322,371 | 567.8 | 0.0254 |
| Inner nuclear layer | 19,092.1 | 1047.9 | 1,098,045 | 89.9% | 110,480 | 332.4 | 0.0174 |
| Outer plexiform layer | 20,095.2 | 1225.2 | 1,501,154 | 89.2% | 162,590 | 403.2 | 0.0201 |
| Outer nuclear layer | 17,005.0 | 782.7 | 612,695 | 94.7% | 32,542 | 180.4 | 0.0106 |
| Photoreceptor | 28,615.4 | 1669.9 | 2,788,601 | 62.7% | 1,041,087 | 1020.3 | 0.0357 |
| Retinal pigment epithelium | 30,780.2 | 1489.6 | 2,218,907 | 64.3% | 791,861 | 889.9 | 0.0289 |
| Choroid | 19,791.6 | 964.5 | 930,165 | 58.4% | 386,699 | 621.9 | 0.0314 |
| All areas | 15,863.3 | 292.3 | 85,435 | 87.6% | 10,630 | 103.1 | 0.0065 |
SD, standard deviation; r2, coefficient of determination with image quality.
Pairwise correlations of the optical intensities of various intraretinal layers (from RNFL to RPE) were moderate to good, with the correlation coefficient r ranging from 0.524 to 0.988, all P < 0.001 (Figs. 2, 3). Among these, the correlation of optical intensities between the block of GCL, IPL, INL, and OPL were very strong, with r > 0.934, P < 0.001 (Fig. 3). In contrast, the correlations of intensities of the vitreous with intraretinal layers were only mild to moderate, with r ranging from 0.363 to 0.541 (P < 0.03), except for photoreceptor, r = 0.250, P = 0.119 (Fig. 3). Choroid intensity was moderately correlated with retinal layers, r ranging from 0.418 to 0.725 (all P < 0.01, Fig. 3).
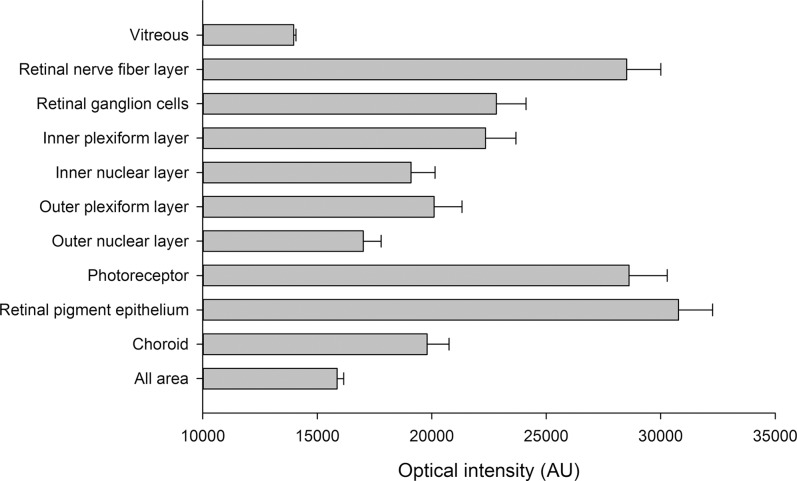
Figure 2. .
The mean and standard deviation of optical intensities in each layer.
Figure 3. .
Correlation coefficient matrix of optical intensities among all layers and image quality. The numbers in each cell are the correlation coefficients.
The image quality index was strongly correlated with optical intensities of retinal layers (0.748 < r < 0.973, all P < 0.001) and moderately correlated with vitreous intensity (r = 0.528, P = 0.0005) (Figs. 3, 4). The variance after normalization with image quality was lowest in ONL, followed by INL, OPL, IPL, and GCL, and was highest in RNFL, RPE, and photoreceptor (Table).
Figure 4. .
(A–F) Correlation of optical intensities in all retinal layers with image quality.
Figure 4. .
(G–J) Correlation of optical intensities in all retinal layers with image quality.
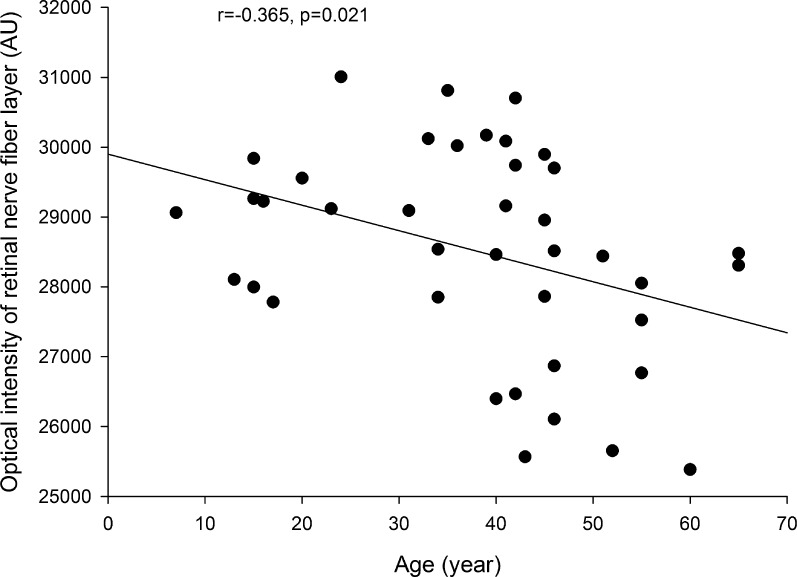
There was no statistical difference in optical intensities in any layer between males and females (all P > 0.05). Age was not correlated with optical intensities for any layer except for the RNFL, which showed a weak but statistically significant correlation, with r = −0.365, P = 0.020 (Fig. 5). The correlation remained significant after adjustment of image quality index (b = −24.2, P = 0.025).
Figure 5. .
Correlation of optical intensity in retinal nerve fiber layer with age.
Discussion
In this study, we established an automatic quantitative measurement of optical intensities in retinal layers depicted by 3D-OCT. Using this technique, we found that the optical intensities of various intraretinal layers were correlated with each other and the image quality. The variance of optical intensities was lowest in ONL and highest in RNFL, RPE, and photoreceptor. Our results also demonstrated that the optical intensity of RNFL decreased with aging.
In the literature on OCT optical intensity quantitative analysis, a few studies used raw data,14,23,24 while others used exported pictures in formats such as .jpeg,11,25 .tiff,26 or .bmp.12 Image processing or compressing may change the intensity value, and raw data analysis was used in our study. Most reports have analyzed 1D A-scan14,23,24 or 2D images11,12,15 and focused on only one or two layers, while our analysis is based on 3D data and included all currently segmented retinal layers. As a result, our study provides more complete information about the scanned area. Furthermore, the analyses reported in the literature were mostly manual, while our study is based on a validated automatic segmentation method20,22,27 and therefore calculation of the intensities in each layer eliminated interobserver variability. Although our study used the data from Topcon 3D OCT-1000 (Topcon Corporation), the algorithm can be applied to SD-OCT images from other manufacturers.
The OCT optical intensities may be affected not only by the reflectivity of the tissue itself, but also by the strength of the underlying laser light signal, which may be affected by opacity changes along the visual axis caused by corneal opacity, cataract, and/or vitreous hemorrhage, as well as by the power of the OCT laser light, scan technique, and the position of the eyeball during examination. It has been reported in 2D-OCT that neutral-density filters induced a linear decrease of reflectivity in OCT images depending on initial signal intensity.24 Our results showed that the optical intensities in different layers linearly correlated with each other. This is not surprising, since the variations of optical intensities in normal subjects are small. Optical intensities were also inevitably strongly correlated with image quality index, which represented signal strength in Topcon 3D OCT-1000 (Topcon Corporation). Therefore, our study confirmed that optical intensity was affected by the signal strength.
The absolute OCT intensity was used first to represent reflectivity.14,23,28,29 However, as mentioned above, the optical intensity in OCT was related not only to tissue reflectivity, but also to signal strength. It is necessary to normalize the intensity with respect to the signal strength. In the literature, vitreous, RNFL, and RPE have been chosen by others as a reference to normalize the optical intensity.11–13,15,26 A possible reason is that vitreous has the lowest intensity while RNFL or RPE has the highest intensity. However, our results showed that in normal subjects, RNFL and RPE have the largest standard deviation of all layers. Furthermore, the correlation between the optical intensity in RNFL and/or RPE with that of other retinal layers or with image quality index was only moderate. Although the optical intensity of vitreous has a small standard deviation, its correlation with that of other retinal layers or with image quality index was low. In contrast, the optical intensities in GCL, IPL, INL, OPL, and ONL were highly correlated with each other and with image quality. The variance after adjustment of correlation with image quality index was lowest in ONL, followed by INL, OPL, IPL, GCL, RNFL, and RPE, and highest in photoreceptor. Based on these results, ONL is a better choice as a reference normalizing optical intensity than vitreous, RNFL, or RPE.
The image quality index itself, which represents signal strength in Topcon 3D OCT-1000 (Topcon Corporation), can also be used to normalize optical intensity. However, it should be noted that the underlying algorithm, the range, and even the naming convention are different across different devices.30 For example, the range of image quality index is 0 to 100 with Topcon 3D OCT-1000 (Topcon Corporation) but 0 to 10 with Zeiss Cirrus OCT (Carl Zeiss Meditec, Dublin, CA). It may be imprecise to use a 10-scale metric for optical intensity normalization. The optical intensity of all areas, which had good correlation with optical intensities of intraretinal layers and image quality index, can also be the reference for normalization.
It has been reported that cataract will reduce the penetration into choroid.31 The disturbances in the light path would reduce the image quality and therefore penetration of deeper tissue. In this study, we also found a high correlation of image quality with optical intensity in choroid (r = 0.764, P < 0.001). It would be interesting to investigate the direct effect of cataract on the optical intensity of choroid. However, in this study, we excluded patients with severe cataract whose BCVA was lower than 20/40. Another shortcoming is that we did not quantitatively measure the severity of cataract. Therefore, the direct effect of cataract on the optical intensity of deep structures requires further investigation.
Additionally, we found a weak negative correlation between RNFL, but not other layers, with age (r = −0.365, P = 0.020), even after adjustment for image quality. It is well recognized that the RNFL thickness is reduced in glaucoma patients32 and higher-age subjects.33 The optical intensity of RNFL was also reported to be lower in patients with glaucoma compared to normal controls or subjects with ocular hypertension.8,9 Our study was the first to show an age-dependent loss of RNFL intensity. Further investigations are needed to clarify the role of RNFL optical intensity in the diagnosis of glaucoma. We also believe that quantitative analysis of optical intensity can be applied to other ocular physical or pathological changes and provide novel insights into these conditions.
In summary, we have reported an automatic quantitative measurement of optical intensity in multiple macular layers imaged using 3D-OCT. The results suggested that the optical intensities in retinal layers were correlated with each other and with image quality. The image quality index and optical intensity of ONL or all areas, but not vitreous, RNFL, or RPE, can be used to normalize the effect of signal strength on optical intensity. Our technique and results provide a reference for further studies of optical intensity in retinal diseases.
Acknowledgments
The authors thank the help of the Research Version of the Iowa Reference Algorithm Iowa, which is provided by the Institute for Biomedical Imaging, University of Iowa.
Supported in part by the National Basic Research Program of China (973 Program) (Grant 2014CB748600), the National Nature Science Foundation of China (Grants 30901646, 81170853, and 81371629), a research grant from the Joint Shantou International Eye Center (2012-18), and a Soochow University Distinguished Professor start-up grant.
Disclosure: X. Chen, None; P. Hou, None; C. Jin, None; W. Zhu, None; X. Luo, None; F. Shi, None; M. Sonka, None; H. Chen, None
References
- 1.Srinivasan VJ, Adler DC, Chen Y, et al. Ultrahigh-speed optical coherence tomography for three-dimensional and en face imaging of the retina and optic nerve head. 2008;49:5103–5110. doi: 10.1167/iovs.08-2127. [DOI] [PMC free article] [PubMed] [Google Scholar]
- 2.Geitzenauer W, Hitzenberger CK, Schmidt-Erfurth UM. Retinal optical coherence tomography: past, present and future perspectives. 2011;95:171–177. doi: 10.1136/bjo.2010.182170. [DOI] [PubMed] [Google Scholar]
- 3.Yang B, Ye C, Yu M, Liu S, Lam DS, Leung CK. Optic disc imaging with spectral-domain optical coherence tomography: variability and agreement study with Heidelberg retinal tomograph. 2012;119:1852–1857. doi: 10.1016/j.ophtha.2012.02.033. [DOI] [PubMed] [Google Scholar]
- 4.Sung MS, Kang BW, Kim HG, Heo H, Park SW. Clinical validity of macular ganglion cell complex by spectral domain-optical coherence tomography in advanced glaucoma [published online ahead of print December 3, 2012] [DOI] [PubMed]
- 5.Zhang L, Lee K, Niemeijer M, Mullins RF, Sonka M, Abramoff MD. Automated segmentation of the choroid from clinical SD-OCT. 2012;53:7510–7519. doi: 10.1167/iovs.12-10311. [DOI] [PMC free article] [PubMed] [Google Scholar]
- 6.Ozdemir H, Karacorlu S, Karacorlu M. Optical coherence tomography findings in central retinal artery occlusion. 2006;26:110–112. doi: 10.1097/00006982-200601000-00021. [DOI] [PubMed] [Google Scholar]
- 7.Fukuchi T, Takahashi K, Ida H, Sho K, Matsumura M. Staging of idiopathic choroidal neovascularization by optical coherence tomography. 2001;239:424–429. doi: 10.1007/s004170100296. [DOI] [PubMed] [Google Scholar]
- 8.Pons ME, Ishikawa H, Gurses-Ozden R, Liebmann JM, Dou HL, Ritch R. Assessment of retinal nerve fiber layer internal reflectivity in eyes with and without glaucoma using optical coherence tomography. 2000;118:1044–1047. doi: 10.1001/archopht.118.8.1044. [DOI] [PubMed] [Google Scholar]
- 9.van der Schoot J, Vermeer KA, de Boer JF, Lemij HG. The effect of glaucoma on the optical attenuation coefficient of the retinal nerve fiber layer in spectral domain optical coherence tomography images. 2012;53:2424–2430. doi: 10.1167/iovs.11-8436. [DOI] [PubMed] [Google Scholar]
- 10.Vermeer KA, van der Schoot J, Lemij HG, de Boer JF. RPE-normalized RNFL attenuation coefficient maps derived from volumetric OCT imaging for glaucoma assessment. 2012;53:6102–6108. doi: 10.1167/iovs.12-9933. [DOI] [PubMed] [Google Scholar]
- 11.Neudorfer M, Weinberg A, Loewenstein A, Barak A. Differential optical density of subretinal spaces. 2012;53:3104–3110. doi: 10.1167/iovs.11-8700. [DOI] [PubMed] [Google Scholar]
- 12.Ahlers C, Golbaz I, Einwallner E, et al. Identification of optical density ratios in subretinal fluid as a clinically relevant biomarker in exudative macular disease. 2009;50:3417–3424. doi: 10.1167/iovs.08-2759. [DOI] [PubMed] [Google Scholar]
- 13.Murakami T, Nishijima K, Akagi T, et al. Optical coherence tomographic reflectivity of photoreceptors beneath cystoid spaces in diabetic macular edema. 2012;53:1506–1511. doi: 10.1167/iovs.11-9231. [DOI] [PubMed] [Google Scholar]
- 14.Barthelmes D, Sutter FK, Gillies MC. Differential optical densities of intraretinal spaces. 2008;49:3529–3534. doi: 10.1167/iovs.07-1320. [DOI] [PubMed] [Google Scholar]
- 15.Giani A, Esmaili DD, Luiselli C, et al. Displayed reflectivity of choroidal neovascular membranes by optical coherence tomography correlates with presence of leakage by fluorescein angiography. 2011;31:942–948. doi: 10.1097/IAE.0b013e31820a68cc. [DOI] [PubMed] [Google Scholar]
- 16.Pfenninger L, Schneider F, Funk J. Internal reflectivity of filtering blebs versus intraocular pressure in patients with recent trabeculectomy. 2011;52:2450–2455. doi: 10.1167/iovs.10-5520. [DOI] [PubMed] [Google Scholar]
- 17.Moreno-Montanes J, Alvarez A, Bes-Rastrollo M, Garcia-Layana A. Optical coherence tomography evaluation of posterior capsule opacification related to intraocular lens design. 2008;34:643–650. doi: 10.1016/j.jcrs.2007.11.035. [DOI] [PubMed] [Google Scholar]
- 18.Abramoff MD, Garvin MK, Sonka M. Retinal imaging and image analysis. 2010;3:169–208. doi: 10.1109/RBME.2010.2084567. [DOI] [PMC free article] [PubMed] [Google Scholar]
- 19.Garvin MK, Abramoff MD, Wu X, Russell SR, Burns TL, Sonka M. Automated 3-D intraretinal layer segmentation of macular spectral-domain optical coherence tomography images. 2009;28:1436–1447. doi: 10.1109/TMI.2009.2016958. [DOI] [PMC free article] [PubMed] [Google Scholar]
- 20.Quellec G, Lee K, Dolejsi M, Garvin MK, Abramoff MD, Sonka M. Three-dimensional analysis of retinal layer texture: identification of fluid-filled regions in SD-OCT of the macula. 2010;29:1321–1330. doi: 10.1109/TMI.2010.2047023. [DOI] [PMC free article] [PubMed] [Google Scholar]
- 21.Antony B, Abramoff MD, Tang L, et al. Automated 3-D method for the correction of axial artifacts in spectral-domain optical coherence tomography images. 2011;2:2403–2416. doi: 10.1364/BOE.2.002403. [DOI] [PMC free article] [PubMed] [Google Scholar]
- 22.Chen X, Niemeijer M, Zhang L, Lee K, Abramoff MD, Sonka M. Three-dimensional segmentation of fluid-associated abnormalities in retinal OCT: probability constrained graph-search-graph-cut. 2012;31:1521–1531. doi: 10.1109/TMI.2012.2191302. [DOI] [PMC free article] [PubMed] [Google Scholar]
- 23.Barthelmes D, Gillies MC, Sutter FK. Quantitative OCT analysis of idiopathic perifoveal telangiectasia. 2008;49:2156–2162. doi: 10.1167/iovs.07-0478. [DOI] [PubMed] [Google Scholar]
- 24.Tappeiner C, Barthelmes D, Abegg MH, Wolf S, Fleischhauer JC. Impact of optic media opacities and image compression on quantitative analysis of optical coherence tomography. 2008;49:1609–1614. doi: 10.1167/iovs.07-1264. [DOI] [PubMed] [Google Scholar]
- 25.Wojtkowski M, Sikorski BL, Gorczynska I, et al. Comparison of reflectivity maps and outer retinal topography in retinal disease by 3-D Fourier domain optical coherence tomography. 2009;17:4189–4207. doi: 10.1364/oe.17.004189. [DOI] [PMC free article] [PubMed] [Google Scholar]
- 26.Horii T, Murakami T, Nishijima K, et al. Relationship between fluorescein pooling and optical coherence tomographic reflectivity of cystoid spaces in diabetic macular edema. 2012;119:1047–1055. doi: 10.1016/j.ophtha.2011.10.030. [DOI] [PubMed] [Google Scholar]
- 27.Chen X, Zhang L, Sohn EH, et al. Quantification of external limiting membrane disruption caused by diabetic macular edema from SD-OCT. 2012;53:8042–8048. doi: 10.1167/iovs.12-10083. [DOI] [PMC free article] [PubMed] [Google Scholar]
- 28.Kozak I, Bartsch DU, Cheng L, Freeman WR. Hyperreflective sign in resolved cotton wool spots using high-resolution optical coherence tomography and optical coherence tomography ophthalmoscopy. 2007;114:537–543. doi: 10.1016/j.ophtha.2006.06.054. [DOI] [PubMed] [Google Scholar]
- 29.Alasil T, Keane PA, Updike JF, et al. Relationship between optical coherence tomography retinal parameters and visual acuity in diabetic macular edema. 2010;117:2379–2386. doi: 10.1016/j.ophtha.2010.03.051. [DOI] [PMC free article] [PubMed] [Google Scholar]
- 30.Huang Y, Gangaputra S, Lee KE, et al. Signal quality assessment of retinal optical coherence tomography images. 2012;53:2133–2141. doi: 10.1167/iovs.11-8755. [DOI] [PMC free article] [PubMed] [Google Scholar]
- 31. Povazay B, Hermann B, Unterhuber A, et al. Three-dimensional optical coherence tomography at 1050 nm versus 800 nm in retinal pathologies: enhanced performance and choroidal penetration in cataract patients 2007. 12 041211. [DOI] [PubMed] [Google Scholar]
- 32.Leung CK, Cheung CY, Weinreb RN, et al. Retinal nerve fiber layer imaging with spectral-domain optical coherence tomography: a variability and diagnostic performance study. 2009;116:1257–1263.e2. doi: 10.1016/j.ophtha.2009.04.013. [DOI] [PubMed] [Google Scholar]
- 33.Leung CK, Yu M, Weinreb RN, et al. Retinal nerve fiber layer imaging with spectral-domain optical coherence tomography: a prospective analysis of age-related loss. 2012;119:731–737. doi: 10.1016/j.ophtha.2011.10.010. [DOI] [PubMed] [Google Scholar]


