

Abstract
Hematopoietic regeneration following chemotherapy may be distinct from regeneration following radiation. While we have shown that epidermal growth factor (EGF) accelerates regeneration following radiation, its role following chemotherapy is currently unknown. We sought to identify EGF as a hematopoietic growth factor for chemotherapy-induced myelosuppression. Following 5-fluorouracil (5-FU), EGF accelerated hematopoietic stem cell regeneration and prolonged survival compared to saline-treated mice. To mitigate chemotherapy-induced injury to endothelial cells in vivo, we deleted Bax in VEcadherin+ cells (VEcadherinCre;BaxFL/FL mice). Following 5-FU, VEcadherinCre;BaxFL/FL mice displayed preserved hematopoietic stem/progenitor content compared to littermate controls. 5-FU and EGF treatment resulted in increased cellular proliferation, decreased apoptosis, and increased DNA double-strand break repair by non-homologous end-joining recombination compared to saline-treated control mice. When granulocyte colony stimulating factor (G-CSF) is given with EGF, this combination was synergistic for regeneration compared to either G-CSF or EGF alone. EGF increased granulocyte colony stimulating factor receptor (G-CSFR) expression following 5-FU. Conversely, G-CSF treatment increased both EGFR and phosphorylation of EGFR in hematopoietic stem/progenitor cells. In humans, the expression of EGFR is increased in patients with colorectal cancer treated with 5-FU compared to cancer patients not on 5-FU. Likewise, EGFR signaling is responsive to G-CSF in humans in vivo with both increased EGFR and phospho-EGFR in healthy human donors following G-CSF treatment compared to donors who did not receive G-CSF. These data identify EGF as a hematopoietic growth factor following myelosuppressive chemotherapy and that dual therapy with EGF and G-CSF may be an effective method to accelerate hematopoietic regeneration.
Keywords: Hematopoietic regeneration, Epidermal Growth Factor, Granulocyte Colony Stimulating Factor, Chemotherapy, Hematopoietic stem cells (HSCs)
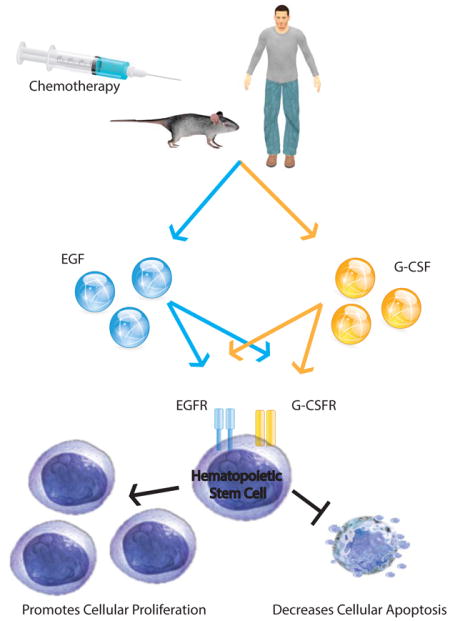
Graphical Abstract
Epidermal growth factor (EGF) is a novel endothelial cell-derived growth factor that accelerates hematopoietic regeneration following myelosuppressive chemotherapy. Chemotherapy upregulates expression of receptors for both EGF (EGFR) and granulocyte colony stimulating factor (G-CSFR) on hematopoietic stem and progenitor cells. Treatment with EGF and G-CSF is synergistic for hematopoietic regeneration compared to either growth factor alone. Dual therapy with EGF and G-CSF could promote hematopoietic regeneration and decrease cellular apoptosis in select cancer patients to reduce chemotherapy-induced myelosuppression.
INTRODUCTION
Hematopoietic growth factors, like granulocyte colony stimulating factor (G-CSF), have clinical indications for the treatment of cytopenias due to chemotherapy or radio-therapy. To accelerate hematopoietic regeneration, G-CSF has resulted in shortened duration of neutropenia [1–3] by signaling through its receptor, G-CSFR, which is expressed on non-hematopoietic and hematopoietic cells, including hematopoietic stem cell (HSCs) [4].
HSCs reside adjacent to BM endothelial cells (ECs) [5]. These ECs provide instruction to HSCs in both homeostasis and following myelosuppressive stress [6–10]. Transplantation of ECs can restore hematopoiesis, even following lethal-dose total body irradiation [11–13]. Even without transplantation of ECs, EC-derived soluble factors are sufficient to expand hematopoietic cells [14–17]. Recently, we described that pharmacologic administration of epidermal growth factor (EGF) resulted in both a 10-fold expansion of HSC-repopulating capacity and survival advantage compared to controls following radiation injury [18]. While EGF may be a radiation mitigator, its role in HSC regeneration following chemotherapy and how EGF compares to G-CSF for treatment of chemo-induced myelosuppression are yet to be determined. These questions are translationally relevant since the mechanisms for hematopoietic injury following radiation can differ from those following chemotherapy injury. For example, differences in patterns of damage to hematopoietic cells exist following 5-FU compared to radiation [19]. Moreover, the morphology of damaged sinusoidal ECs may be discontinuous and hemorrhagic following ionizing radiation, which differs from ECs observed following 5-FU where ECs were non-discontinuous and non-hemorrhagic [20]. These differences in the response of both HSCs and ECs to chemotherapy or radiation suggest that there could be differences in the marrow’s response to growth factors as well.
The goal of this study is to characterize the hematopoietic response to both myelosuppressive and lethal-dose chemotherapy following EGF. Here, we demonstrate that EGF expanded HSCs and prolonged survival following 5-FU compared to saline-treated mice. Using mice with deletion of Bax in VEcadherin-expressing cells, we confirmed the fundamental role of ECs in facilitating hematopoietic regeneration. EGF increased G-CSFR expression, and mutually, G-CSF increased both EGFR and phosphorylation of EGFR. Translationally in humans, 5-FU increases EGFR expression, and G-CSF in healthy human donors increases both EGFR and phosphorylation of EGFR. Taken together, these data demonstrate that EGF and G-CSF are synergistic to promote hematopoietic regeneration and could be given as dual therapy to patients with EGFR-negative malignancies undergoing chemotherapy treatment.
MATERIALS AND METHODS
Animals and Chemical/Biologic Reagents
Eight to 12-week old C57Bl6 (CD 45.2+) and B6.SJL (CD 45.1+) mice were purchased from Jackson Laboratory (Bar Harbor, ME). Biologic variables such as age, sex, and weight were matched. By breeding VECadherinCre;BaxFL/+ mice with BaxFL/FL mice, we generated both VECadherinCre;BaxFL/FL mice and VECadherinCre;BaxFL/+. Duke University Animal Care and Use Committee has approved all animal studies.
5-Fluorouracil (Fresenius Kabi, Lake Zurich, IL) and 5-Fluoro-2′-deoxyuridine 5′-monophosphate (FdUMP), an active metabolite of 5-FU (Sigma-Alrich, St. Louis, MO), were diluted with 1x PBS (Sigma-Alrich) to the specified concentrations.
Peripheral blood samples from both healthy donors and patients with colorectal cancer were obtained using protocols approved by the Institutional Review Board at Duke University. Written and informed consents were obtained from all subjects. Peripheral blood from healthy donors, donors mobilized with G-CSF, and patients with colorectal cancer was collected in heparinized tubes. For mobilization, donors were treated with daily injections of 10 μg per kg G-CSF per day for 5 days. Samples were collected and processed 2 hours after the last dose.
Early passage patient-derived cancer cell lines were cultured and developed as previously described [21]. Colorectal cancer (CRC) patients’ specimens used to generate the cell lines were collected under a Duke IRB approved protocol (Pro00002435). These cell lines were then authenticated using the Duke University DNA Analysis Facility Human cell line authentication (CLA) service. Specifically, genomic DNA isolated from the cancer cell lines were analyzed for polymorphic short tandem repeat (STR) markers using the GenePrint 10 kit from Promega (Madison, WI, USA) to ensure purity. HT-29, HCT-116, NCI-H460 were obtained from American Type Culture Collection (Manassas, VA). Cultures of primary BM ECs were generated using methods previously described [18].
Analysis for EGF, EGFR, and G-CSFR Expression
For mRNA expression of EGFR, cell subsets from C57Bl6 mice were collected at 24 h following 150 mg/kg 5-FU, 0.5 mg/kg IV EGF (R&D Systems, Minneapolis, MN), or 0.5 mg/kg subcutaneously G-CSF. mRNA EGFR expression analyses and analysis for other targets (CDK1, CDK2, CDK4, CDK6, p21, PUMA, and BCl-2) were performed according to manufacturer’s specifications (ThermoFisher Scientific, Waltham, MA). Relative expression of genes was calculated using delta-delta CT analysis with normalization to GAPDH.
For protein expression of EGFR, cell subsets were isolated according to manufacturer’s specifications (Miltenyi Biotec, Auburn, CA). BM lineage-negative (lin−) cells were stained with CD34 APC (BD), anti-EGFR FITC (Abcam, Cambridge, MA), 7-AAD (BD), and anti-lineage antibody APC, anti-cKit PE, and anti-Sca-1 APC-Cy7 (BD, San Jose, CA). Phosphorylation of EGFR was performed using published methods [18].
G-CSFR expression was determined using ckit+Sca+Lin- (KSL) antibodies (BD) and anti-G-CSFR antibody Alexafluor 488 (R&D Systems).
For phospho-EGFR of human cells, cells were labeled with CD34+, and then cells were fixed and permeabilized as described [18]. Cells were labeled with anti-phospho-EGFR (Y1078) antibody (Cell Signaling, Danvers, MA). Isotype controls were included for all analyses.
Hematopoietic Progenitor Cell Assays and Survival Study
BM collection, mouse endothelial cell antigen-32 (MECA) staining, and colony forming cell (CFCs) methylcellulose assays were performed using published methods [18]. Hematoxylin and eosin staining were performed by the Duke Research Immunohistology Lab. For colony-forming unit-spleen 12 (CFU-S12) analysis, 2×10⁵ whole bone marrow (WBM) cells were injected into 900-cGy irradiated C57Bl6 mice. At day 12 post-injection, colonies were counted by two independent investigators. Complete blood counts were quantified on a HemaVet 950 (Drew Scientific, Dallas, TX). Long-term culture initiating cell (LTC-IC) assays were performed using published methods [22].
Competitive transplantation assays were performed with 2×10⁵ donor cells from B6.SJL mice at day 7 after 5-FU and days 1–4 of 0.5 mg/kg EGF or Saline and injected into 900-cGy irradiated C57Bl6 mice with 2 × 10⁵ host WBM cells. Secondary competitive transplantation assays were performed using 40% of BM cells from primary-transplanted mice and 2 × 10⁵ host WBM cells. Each donor was transplanted into 2 recipient mice. Measurement of donor chimerism within the BM KSL population was performed at 16-weeks post-transplantation as previously described [18].
For the survival study, C57Bl6 mice were treated with 600 mg/kg IV 5-FU and then given 0.5 mg/kg EGF or Saline beginning at 24 h later and then daily through day 4. Mice were sacrificed when endpoints were met according to approved protocols from IACUC at Duke University.
HSC Cycling and Cell Death Assays
For cell cycle analysis, KSL-labeled cells were treated with Fix Buffer I, Perm Buffer III, Ki67-FITC, and 7-AAD according to manufacturer specifications (BD). For cell death analysis, KSL cells were sorted and cultured for 24 h in 0.5 μM FdUMP with and without 20 ng/ml EGF in thrombopoietin, 125 ng/ml stem cell factor, and 50 ng/ml Flt-3 ligand (TSF) [18] compared to TSF alone. KSL cells and progeny were stained with annexin V FITC and 7-AAD according to manufacturer’s specifications (BD).
Viability of cells were determined by tetrazolium blue (MTT, Sigma-Alrich) assay according to manufacturer’s specifications.
Statistical Analyses and Image Capture
Data are shown as means ± SEM. Student’s t test (two-tailed with unequal variance) or Mann-Whitney analysis were used as specified in the figure legends. Survival analysis was performed using a Log-rank test. Analyses were performed using GraphPad Prism (v7.0, La Jolla, CA).
Images for immunohistochemistical analysis were obtained with Zeiss AxioImager Z2 and Axiocam 506. Immunofluorescent images were obtained with an Olympus BX61WI two photon system (Center Valley, PA). Adobe Photoshop software (20142.2, Adobe Systems, San Jose, CA) was used to quantify positive signals using methods described previously [23].
RESULTS
EGFR expression is induced following 5-FU
Following radiation, EGFR expression is enriched in KSL cells compared to more differentiated progenitor cells [18]. Untreated animals displayed increased EGFR expression in KSL cells compared to lin− cells (Fig S1A). At 24 h following 5-FU, KSL cells have a 10.5-fold increase in EGFR mRNA expression compared to untreated animals (Fig. 1A). Comparison of EGFR expression in KSL cells compared to lin− cells following 5-FU treatment demonstrate increased EGFR expression, indicating that 5-FU enriches EGFR-expressing cell within the KSL subset (Fig S1A). EGFR immunofluorescence in BM lin− cells displayed a 3.2-fold increase of EGFR compared to untreated mice (Fig. 1B). Flow cytometric analysis for EGFR in both the whole BM (WBM) and lin− cell populations displayed less than 2% of EGFR+ cells in either untreated or 5-FU-treated animals. The percentage of EGFR+ cells within the KSL subset was increased 24.4-fold compared to WBM from untreated mice (Fig. 1C). Comparison of the total KSL cells that are EGFR+ in untreated and 5-FU treated mice show a modest increase in EGFR expression (Fig. S1B). Taken together, following 5-FU, both mRNA and protein expression of EGFR is increased in hematopoietic cells, and particularly in KSL cells.
Fig. 1. EGFR on HSPCs increases following 5-FU.

(A) EGFR mRNA expression at baseline and 24h following 150 mg per kg 5-FU. n= 3–12/group. *p< 0.0001. (B) EGFR (green) in BM lin− cells compared to control. DNA is stained with DAPI (blue). Scale bar, 25 μm. Percentage BM lin− EGFR+ pixels normalized by surface area. n= 8–9/group. *p= 0.03. (C) Representative flow cytometric analysis of percentage EGFR in KSL cells from mice at 24 h following 5-FU compared to untreated mice. Quantification of EGFR expression. n= 4–6/group. *p= 0.0008.
EGF promotes HSC reconstitution following 5-FU
To determine whether EGF accelerates HSC reconstitution after 5-FU, C57Bl6 mice were treated with 5-FU and then EGF or saline starting 24 h later, since growth factors like G-CSF are administered at 24 h following chemotherapy (Fig. 2A). BM was analyzed on both day 4 and day 7, since with 5-FU, day 4 represents the hematopoietic nadir and regeneration has commenced by day 7 [19]. At these time points, EGF-treated mice displayed preserved BM cellularity with a 2.3-fold increase in total cells at day 7 in EGF-treated animals compared to saline-treated mice (Fig. 2B). The marrow vasculature also demonstrated increased staining for endothelial cells by mouse endothelial cell antigen-32 (MECA) (Fig. 2C). EGF-treated mice increased CFCs and CFU-S12 compared to saline-treated mice (Fig. 2B–D). Long-term culture initiating cell (LTC-IC) assays, which are in vitro assays that linearly correlate with HSC function in vivo [24, 25], demonstrated a 7-fold increase in long-term HSCs in EGF-treated mice compared to saline-treated mice (Fig. 2E).
Fig. 2. Pharmacologic treatment of EGF accelerates HSC reconstitution following 5-FU.

(A) C57Bl6 or B6.SJL mice were treated with 150 mg/kg IV 5-FU, then 0.5 mg per kg EGF or Saline on days 1 to 4. Hematopoietic assays were performed on days 4 and 7. (B) Left, femurs stained with hematoxylin and eosin. Scale bar, 500 μm (left) and 100 μm (right). Right, total cells per femur from Saline- (black) or EGF-treated mice (blue). n= 18–22/group for day 4. n= 7–9/group for day 7. *p= 0.002 and 0.04 by Mann-Whitney analysis for days 4 and 7, respectively. (C) Left, femurs at day 4 and 7 following 5-FU chemotherapy and treatment with EGF or Saline. Representative sections of MECA (brown) and hematoxylin (blue) stained femurs. Scale bar, 100 μm. Right, quantification of percentage of MECA+ pixels per surface area at day 4 and 7. n= 10–11/group for day 4, *p= 0.005. n=7/group, *p=0.008 for day 7. (D) Left, CFCs, n= 9–15/group. *p< 0.0001 for day 4 and 7. Right, CFU-S12, n= 5–7/group. *p= 0.0005 and *p= 0.0007 for day 4 and 7, respectively. (E) 6-week LTC-ICs. n= 4/group. *p=0.03. (F) Peripheral blood (PB) CD45.1+ engraftment from EGF-treated mice (blue) compared to saline-treated control mice (black) at day 7 following 5-FU. Recipients received 2 × 10⁵ WBM donor cells and 2 × 10⁵ competing host WBM. n= 8–10/group, *p= 0.009 and 0.03 for 8 and 16 weeks, respectively. Percentage Myeloid (Mac1/Gr-1), T-cell (CD3) and B-cell (B220) engraftment at 16 weeks in the PB of recipient mice. *p= 0.0009 for %CD3 and *p= 0.0005 for % B220 by Mann-Whitney analysis. (G) Representative flow cytometric analysis at 16-weeks post-secondary transplantation of total donor cell engraftment in marrow of recipient mice. (H) Peripheral blood donor cell engraftment following secondary transplantation at 16-week after primary transplantation of 40% of WBM cells from 5-FU and EGF- or Saline-treated donor mice and 2 × 10⁵ WBM host cells. n= 11–17/group. *p= 0.0001, 0.01, 0.01, and 0.007 for 4, 8, 12, and 16 weeks, respectively by Mann-Whitney analysis. Percentage Myeloid, T- and B-cell engraftment at 16 weeks in the BM of recipient mice. *p= 0.009, 0.006, 0.0008, respectively by Mann-Whitney analysis. (I) Flow cytometric analysis from a live, lin− gate of total donor engraftment in BM KSL cells at 16 weeks. (J) KSL cells per femur and percentage donor CD 45.1 cells within the KSL population are shown. *p= 0.0003 and 0.001, respectively. (K) Survival following 600 mg per kg IV 5-FU and EGF or saline. n= 10–15/group. *p= 0.04 by Log-rank analysis.
Complementary to LTC-IC assays, we performed competitive transplantation assays. Primary donor engraftment in both the peripheral blood and marrow of recipients of whole bone marrow from EGF-treated animals had increased multi-lineage donor engraftment compared to recipients of saline-treated animals (Fig. 2F). Secondary competitive transplants were performed in which BM from primary recipient mice was transplanted into lethally-irradiated recipients with competing host WBM. As early as 4 weeks and throughout the period of monitoring until 16 weeks, recipients of EGF-treated donor cell had increased peripheral blood engraftment compared to recipients of saline-treated donor cells (Fig. 2G,H). Moreover, recipients of EGF-treated donors had both increased CD 45.1 chimerism and total KSL cells (Fig. 2I,J). These results indicate that pharmacologic treatment of EGF accelerated hematopoietic regeneration following myelosuppressive-dose 5-FU, particularly within the stem cell pool.
EGF prolongs survival following lethal-dose 5-FU
To determine whether EGF prolongs survival following lethal-dose 5-FU injury, C57Bl6 mice were treated with 600 mg/kg 5-FU and then EGF or Saline from day 1–4 (Fig. 2K). Seventy percent of EGF-treated animals (7 of 10) survived through day 30. In contrast, only 20% of saline-treated animals (3 of 15) survived until day 30. These results demonstrate that EGF provides a survival advantage following lethal-dose chemotherapy.
Deletion of Bax in VEcadherin+ ECs is chemo-protective of HSPCs
At 24 h following 5-FU, the expression of Bax, a pro-apoptotic gene, is increased 2.8-fold in BM lin− cells from mice treated with 5-FU compared to untreated mice (Fig. 3A). To abrogate apoptotic cell death in ECs, we employed CreLoxP technology to delete Bax in VECadherin+ ECs in VECadherinCre;BaxFL/FL (BaxFL/FL) mice and littermate control VECadherinCre;BaxFL/+ (BaxFL/+) mice, which retained one Bax allele (Fig. S2A). Without injury to these mice, we detected no differences in complete blood counts, BM cellularity, BM EC structure or density, SLAM+KSL cells, or CFCs (Fig. S2B–F).
Fig. 3. Deletion of Bax in VEcadherin+ ECs abrogates HSPC injury.

(A) Bax mRNA expression in BM lin− cells at 24 h after 5-FU. n= 8/group. *p< 0.0001. (B) EGF mRNA expression in BaxFL/+ and BaxFL/FL ECs at steady state and following 24 h in culture with 0.5 μM FdUMP. n= 6/group. *p= 0.007 for BaxFL/+ and BaxFL/FL ECs at steady state, *p= 0.01 for BaxFL/+ and BaxFL/FL ECs with FdUMP. *p= 0.005 for BaxFL/+ ECs following FdUMP treatment. *p= 0.003 for BaxFL/FL ECs following FdUMP treatment. (C) CFCs and (D) % annexin+ cells at 48h from non-contact cultures of C57Bl6 KSL cells with BaxFL/+ ECs and EGF or TSF alone (white bars) or BaxFL/FL ECs and erlotinib or vehicle (blue bars). n= 6/group. *p=0.001. n= 3/group for % annexin+. *p= 0.03 and 0.0003 for BaxFL/+ and BaxFL/FL conditions, respectively. (E) Left, MECA-stained femurs from BaxFL/+ and BaxFL/FL mice on day 4 following 5-FU. Scale bar, 250 μm. Right, quantification of percentage MECA+ pixels. n= 7–8/group. *p=0.007 (F) Percentage SLAM+KSL cells and CFCs of BaxFL/+ and BaxFL/FL mice on day 4 after 5-FU. n= 4–12/group. *p= 0.03 and 0.04, respectively. (G) 6-week LTC-ICs on day 4 following 5-FU. n= 5–6/group. *p=0.007. Poisson statistical analysis of a limiting dilution assay of 6-week LTC-ICs from BaxFL/+ and BaxFL/FL BM cells following 5-FU on day 4. The LTC-IC frequency of BaxFL/FL mice was 1 in 636 compared to 1 in 2030 cells for BaxFL/+ mice. n= 5–6 per cell dose/group.
We sought to determine whether prevention of chemotherapy-induced apoptotic cell death within VEcadherin+ ECs would result in accelerated HSPC reconstitution. Following 24h cultures of BM lin− cells from each genotype with TSF + FdUMP or TSF alone, no differences were noted in total cell expansion, %KSL, and CFCs, suggesting that the hematopoietic phenotypes are equal (Fig. S2G). The phenotype of ECs, however, differ in that ECs from BaxFL/FL mice displayed increased levels of EGF compared to ECs from BaxFL/+ mice both at baseline and at 24h following culture with FdUMP (Fig. 3B). FdUMP increased EGF expression in cultured ECs from both genotypes. This increase in EGF expression was greater in BaxFL/FL ECs compared to BaxFL/+ ECs (Fig. 3B). Non-contact cultures of C57Bl6 KSL cells and FdUMP with BaxFL/+ ECs and TSF + EGF displayed increased CFCs and decreased annexin+ cells compared to cultures with BaxFL/+ ECs and TSF alone (Fig. 3C,D). Conversely, non-contact cultures of C57Bl6 KSL cells and FdUMP with BaxFL/FL ECs and erlotinib, an inhibitor for EGFR [26], resulted in decreased CFCs and a 4.3-fold increase in annexin+ cells. Following 5-FU, BaxFL/FL mice display increased marrow and vascular content, increased SLAM+KSL cells, and CFCs compared to BaxFL/+ mice (Fig. 3E,F). More specifically, BaxFL/FL mice had a 3.1-fold increase in MECA+ cells in their marrow compared to BaxFL/+ mice (Fig. 3E). Likewise, total HSC content of BaxFL/FL mice was 3-fold greater compared to BaxFL/+ mice as estimated by LTC-IC assays (Fig. 3G). These data demonstrate that Bax deficiency in VEcadherin-expressing cells could abrogate the myelosuppressive impact of 5-FU on HSCs in vivo. These data demonstrate that increased levels of EGF in vivo results in accelerated hematopoietic stem cell regeneration following 5-FU myelosuppression.
Mechanisms of EGF Activity in HSPCs
We sought to determine whether EGF signaling could promote hematopoietic cell proliferation following chemotherapy. On day 4 following 5-FU, EGF-treated mice displayed increased Ki67+ cells compared to saline-treated mice (Fig. 4A). This increased level of Ki67 cells corresponded to increased KSL cells that were cycling in interphase (Fig. 4B). Since cyclin-dependent kinases (CDKs) tightly regulate cell cycle [27], we showed that EGF could upregulate CDK expression (CDK1, CDK2, and CDK6) and downregulate the CDK inhibitor p21 following chemotherapy (Fig. 4C).
Fig. 4. EGF promotes cell cycling and decreases apoptotic cell death.

(A) On day 4 following 5-FU and either EGF or Saline, shown are representative flow cytometric analysis and quantification of Ki67+ C57Bl6 KSL cells. n= 5/group. *p=0.04 by 1-tailed Mann-Whitney analysis. (B) % KSL cells in G1 (white) or S+G2M (gray). *p=0.03 by Mann-Whitney analysis. (C) RTPCR analysis of CDK1, CDK2, CDK4, CDK6 in C57Bl6 BM lin− cells at 4 h following culture with 0.5 μM FdUMP + 20 ng/ml EGF (EGF) or FdUMP alone (TSF). RTPCR analysis of p21 at 24 h. n= 4/group. *p< 0.0002. (D)% Annexin+7AAD− cells (black) and % annexin+7AAD+ cells (white) in KSL cells. n= 6–8/group. *p=0.005 and *p=0.002 for TSF vs TSF + FdUMP and TSF + FdUMP vs TSF + FdUMP + EGF, respectively. (E) Representative flow cytometric analysis of % annexin+7-AAD− cells (black bar) and % annexin+7AAD+ cells (white bar) at day 4 after 5-FU. n= 9–10 mice/group. *p= 0.002 and <0.0001 for % annexin+7AAD− cells and % annexin+7-AAD+ cells, respectively. (F) Representative flow cytometric analysis of % γ-H2ax of KSL cells at 24 h with FdUMP (dark gray) or FdUMP + EGF (blue). Isotype is shown in light gray. n= 4–5/group. *p< 0.0001. (G) BM lin− cells stained with phospho-DNA-PKcs (T2637, green) at 24 h with 0.5 μM FdUMP and 15 min with 20 ng/ml EGF or TSF. Scale bar, 20 μm. Quantification of percentage positive pixels for phospho-DNA-PKcs by surface area. n= 3–5/group. *p= 0.02. (H) Representative flow cytometric analysis and % phospho-DNA-PKcs (T2647) from BM lin− cells treated for 24 h with 0.5 μM FdUMP and 15 min with 20 ng/ml EGF or TSF. n= 6–8/group. *p=0.04. (I) RTPCR analysis of PUMA and BCL-2 in C57Bl6 BM lin− cells at 24 h following culture with 0.5 μM FdUMP + 20 ng/ml EGF (EGF) or FdUMP alone (TSF). n= 4/group. *p= 0.004 and 0.0001 for PUMA and BCL-2, respectively.
Since EGF mediated cell proliferation, we sought to determine whether EGF signaling could also mitigate chemo-induced cellular apoptosis. With the addition of EGF to KSL cell cultures treated with FdUMP, annexin+ cells were diminished compared to cultures with TSF alone (Fig. 4D). In vivo, C57Bl6 mice treated with 5-FU and EGF displayed a 54% decrease in annexin+ cells compared to saline-treated control mice (Fig. 4E).
Since 5-FU exerts its cytotoxic effects in part by generating lethal double-strand DNA (dsDNA) breaks [28], we hypothesized that the decrease in annexin+ cells following EGF was by enhanced DNA repair [29]. Following 24h culture with FdUMP, EGF-treated KSL cells and progeny displayed a 40% reduction in percentage γ-H2ax, a marker for DNA breakage, compared to cultures with TSF alone (Fig. 4F). EGF may also facilitate dsDNA break repair through non-homologous end joining recombination via phosphorylation of DNA-Protein kinase catalytic subunit (DNA-PKcs) [30]. Following 24 h treatment with FdUMP and a 15-minute stimulation with EGF, C57Bl6 KSL cells display a 4.8-fold increase in phosphorylation of DNA-PKcs (T2637) compared with FdUMP treated cultures only (Fig. 4G,H). The increase in phosphorylation of DNA-PKcs corresponded to both a repression of PUMA and an increase in BCL-2 with EGF treatment (Fig. 4I). These data demonstrate that EGF could mediate both cell proliferation and survival by increasing phospho-DNA-PKcs and via partial inhibition of PUMA signaling.
EGF induces G-CSF receptor expression following 5-FU
G-CSF is the clinical standard for treatment of myelosuppression following chemotherapy [1, 3]. We sought to determine whether dual therapy of G-CSF and EGF would be synergistic for hematopoietic regeneration compared to monotherapy with either EGF or G-CSF alone. On day 4 following 5-FU and G-CSF + EGF, C57Bl6 mice display increased marrow cellularity compared to G-CSF-treated mice (Fig. 5A). Dual therapy resulted in both increased percentage and total SLAM+KSL compared to either G-CSF or EGF monotherapy (Fig. 5B). The levels of SLAM+KSL cells in mice treated with G-CSF + EGF were 4.2-fold greater than in mice treated with either G-CSF or EGF monotherapy. This increase in SLAM+KSL corresponded to an increase in CFC content in mice treated with dual G-CSF + EGF compared to mice treated with monotherapy (Fig. 5C). Based on LTC-IC analysis, G-CSF + EGF increased HSC content by 3.3-fold compared to either G-CSF or EGF alone (Fig. 5D). These data suggest that dual therapy with G-CSF + EGF is synergistic to accelerate HSC regeneration. With either G-CSF or EGF, comparable levels of hematopoietic content were measured, which indicates that EGF could equally accelerate hematopoietic regeneration at the same levels as the current clinical standard G-CSF.
Fig. 5. EGF and G-CSF are synergistic for hematopoietic regeneration.

(A) Left, MECA and hematoxylin-stained femurs from C57Bl6 mice treated with 5-FU on day 0 and G-CSF + EGF (days 1–4) or G-CSF alone (days 1–4). Scale bar, 250 μm. Right, quantification of percentage MECA+ pixels. n= 5/group. *p= 0.04 (B) Percentage SLAM+KSL cells and total SLAM+KSL cells per femur at day 4 after 5-FU and treatment with EGF, G-CSF, or G-CSF + EGF on days 1–4. n= 5/group. *p= 0.003 and 0.004 for G-CSF + EGF vs. EGF and vs. G-CSF, respectively for % SLAM+KSL. *p= 0.0008 and 0.0002 for G-CSF + EGF vs. EGF and vs. G-CSF, respectively for SLAM+KSL per femur. (C) CFC content at day 4. n= 6–12/group for CFCs. *p= 0.000 and <0.0001 for G-CSF + EGF vs. EGF and vs. G-CSF, respectively. (D) LTC-ICs on day 4 following 5-FU and G-CSF or G-CSF + EGF. n= 4/group. *p=0.04. Poisson statistical analysis of a limiting dilution assay of 6-week LTC-ICs from BM cells of C57Bl6 mice treated with G-CSF or G-CSF + EGF following 5-FU on day 4. The LTC-IC frequency of G-CSF + EGF-treated mice was 1 in 149 compared to 1 in 1502 cells for G-CSF-treated mice (n= 4/group per cell dose). (E) Left, Csf3r mRNA expression in KSL cells treated at 24 h with FdUMP and 20 ng/ml EGF or FdUMP alone. n= 3/group. *p< 0.0001. Right, Csf3r mRNA expression in WBM from C57Bl6 mice at 48 h after 5-FU and 24 h after EGF or saline compared to mice treated with EGF. Data were analyzed relative to Csf3r expression in untreated mice. n= 4–5/group. *p<0.0001 for 5-FU + EGF vs. saline, EGF (no 5-FU), or untreated mice. (F) Representative flow cytometric analysis and quantification of percentage G-CSF-R in KSL cells at 48 h following 5-FU and 24 h following EGF or Saline treatment in C57Bl6 mice. n= 4/group. *p=0.003, 0.0002, and 0.0001 for 5-FU + EGF vs. saline, EGF (no 5-FU), or untreated mice, respectively. (G) Percentage EGFR in KSL cells following 24 h culture of BM lin− cells with 0.5 μM FdUMP and 20 ng/ml G-CSF compared to FdUMP, G-CSF (no FdUMP), or untreated cells. n= 4/group. *p= 0.02, 0.006, and 0.01 for FdUMP + G-CSF vs FdUMP, G-CSF, and TSF only, respectively. (H) Left, EGFR mRNA expression after 1 h 5-FU and G-CSF or saline for 10 minutes. n= 4/group. *p= 0.005 and 0.02 for 5-FU + G-CSF compared to 5-FU + Saline and untreated control, respectively. Right, percentage EGFR in KSL cells at 48 h following 5-FU and 24 h following G-CSF or Saline. n= 3–5/group. *p= 0.04 and 0.007 for 5-FU + G-CSF vs 5-FU + Saline or untreated, respectively. (I) Representative flow cytometric analysis of percentage phosphorylation of EGFR (Y1173) in KSL cells at 10 minutes following 0.25 mg/kg body weight of G-CSF (blue) or Saline (gray). Positive gating is noted by horizontal bar. n= 4/group. *p<0.0001.
Since G-CSF and EGF can promote hematopoietic regeneration, we sought to determine whether G-CSF could modulate expression of EGFR, and conversely, whether EGF could modulate expression of G-CSF receptor (G-CSFR). This hypothesis is supported by reports that EGFR+ carcinomas could induce extreme leukocytosis, suggesting that EGF and hematopoietic growth factors other than exogenous G-CSF could promote leukocytosis via G-CSFR signaling [31, 32]. The gene that encodes G-CSFR Csf3r is increased 3.6-fold in KSL cells treated with chemotherapy and EGF compared to cultures with chemotherapy alone (Fig. 5E). To model this study in vivo, we administered 5-FU to C57Bl6 mice and then administered EGF or saline and included an untreated control group (Fig. 5E). Like EGFR, 24 h following treatment with 5-FU induces Csf3r expression (Fig. 5E). The addition of EGF administration further increases Csf3r expression by 3.6-fold compared to 5-FU treatment alone (Fig. 5E). Corresponding to Csf3r mRNA expression, we measured the expression of G-CSFR protein and found that G-CSFR is increased 1.8-fold with 5-FU treatment compared to untreated controls (Fig. 5F). Likewise, treatment with 5-FU and EGF increased G-CSFR by 18.5% compared to 5-FU alone (Fig. 5F). These results indicate that EGF induces both mRNA and expression of G-CSFR protein following 5-FU.
Following chemotherapy and G-CSF, EGFR expression within KSL cells increased by 50% in vitro and by 45% in vivo compared to controls (Fig. 5G,H). To determine whether this increased EGFR expression corresponded to increased EGFR signaling, the combination of 5-FU and G-CSF induced phosphorylation of EGFR (Y1173) compared to control mice (Fig. 5I). These data demonstrate that EGF upregulates G-CSFR at both the levels of mRNA and protein expression. Complementary to this finding, G-CSF upregulates EGFR expression following chemotherapy and promotes phosphorylation of the EGF receptor.
EGFR expression in humans is induced following 5-FU and G-CSF in vivo
To make these findings translationally relevant and validate the findings from our murine studies, we sought to determine whether EGF could promote cancer growth in cancer cell lines. We utilized 2 cancer lines that were generated from patients with colorectal liver metastasis (CRC119 and CRC240) [21] and 3 lines purchased from ATCC (HT-29, HCT-116, and NCI-H460). Following culture with 20 ng/ml EGF for 72 h, HCT-116 displayed a modest increase in cell viability compared to control cultures in media alone (Fig. S3A). All 4 other cell lines demonstrated no differences in cell expansion. Chemotherapy increased EGFR expression in CRC119 and in NCI-H460 and had no effect on other cell lines (Fig. S3B–D). These data indicate that a subset of tumors does not respond to EGF treatment and that chemotherapy does not increase EGFR expression in all cancer cell lines at the time points and concentrations tested.
Next, we examined whether 5-FU and G-CSF could modulate EGFR expression in vivo in humans. When patients with colorectal cancer were treated with 5-FU, the percentage of CD34+EGFR+ cells was 4.4-fold greater compared to untreated cancer patients and was higher than in healthy human donors (Fig. 6A). Following G-CSF injections, CD34+ peripheral blood from healthy human donors displayed a 4.3-fold increase in EGFR compared to CD34+ peripheral blood from untreated healthy human donors (Fig. 6B). This corresponded to a modest increase in phosphorylation of EGFR (Y1078) in G-CSF-treated donors (Fig. 6C). These data demonstrate that EGFR is both expressed and induced in vivo following treatment with either G-CSF or 5-FU.
Fig. 6. EGFR expression in humans is induced following 5-FU and G-CSF in vivo.

(A) Representative flow cytometric analysis and quantification of percentage EGFR in peripheral blood from patients with colorectal cancer while on 5-FU treatment (CRC + 5-FU) compared to patients not on 5-FU treatment (CRC). Healthy human donor PB are shown for comparison. n= 3–10/group. *p= 0.001. (B) Percentage of EGFR+ cells and (C) phosphorylation of EGFR (Y1078) from CD34+ cells in the peripheral blood of healthy human donors at baseline and following G-CSF treatment. *p=0.01 for percentage EGFR, n= 3–7/group.
DISCUSSION
We have previously demonstrated that EGF is a hematopoietic growth factor using a cytokine screen from murine marrow supernatants [33]. Next, we have shown previously that following ionizing radiation injury, EGF could promote HSC regeneration [18]. Although EGF regulates HSC regeneration following radiation, whether EGF also regulates HSC regeneration following chemotherapy was unknown. This distinction is clinically relevant since the mechanisms driving hematopoietic regeneration may not be directly transposable between radiation and chemotherapy. Since there are key differences in the response of both hematopoietic cells and sinusoidal endothelial cells to myelosuppressive injury from radiation and chemotherapy, we sought to address these differences in these current studies.
We demonstrate that EGF accelerates HSC regeneration following 5-FU. While a single injection of 5-FU may not impair the repopulating capacity of HSCs [34], 5-FU can both enrich the stem cell pool and induce functional changes on the enriched HSPC population [35]. 5-FU increased preferentially the expression of EGFR in HSPCs compared to more differentiated whole bone marrow cell populations. This expression of EGFR could prime both stem cells and stem/progenitor cells for EGF signaling to maximize the hematopoietic response when EGF is administered 24 h later. Another mechanism by which EGF increased HSPCs is by increasing EC density in the marrow as measured by MECA+ vessels, thereby encouraging increased secretion of EGF. Using a pharmacologic approach by either supplementing EGF in cultures or EGF in vivo, we showed that increased levels of EGF resulted in increased HSC content after 5-FU. This increase in HSC content corresponded to an increase in myeloid progenitor engraftment, or a myeloid-bias following hematopoietic injury [18, 36].
Complementary to these pharmacologic gain-of-function studies, we employed a genetic approach using VECadherinCre;BaxFL/FL (BaxFL/FL) mice and littermate control mice. While baseline measurements of EGF were increased in BaxFL/FL ECs compared to BaxFL/+ ECs, treatment with FdUMP further increased levels of EGF in both genotypes. These increased levels of EGF resulted in increased HSC content and accelerated hematopoietic regeneration after 5-FU. These results demonstrate that EGF is a hematopoietic growth factor that accelerates regeneration after myelosuppressive chemotherapy.
The mechanism by which EGF promotes cellular proliferation following chemotherapy is by upregulation of cyclin dependent kinases, in particular CDK1, CDK2, and CDK6. Upregulation of these CDKs permits cell cycle progression. For cells to enter S-phase, levels of the CDK inhibitor p21 should be low [27, 37]. In our system, EGF represses p21 expression following chemotherapy. In a report from Sheng et al. [38], EGF was shown to increase expression of p21 and promotes enterocyte proliferation. It is possible the effect of EGF on CDKs and CDK inhibitors is dose-dependent and could vary based on cell type (i.e., hematopoietic cells vs. enterocyte) and whether injury is present.
We demonstrate that dual therapy with G-CSF and EGF following 5-FU increased HSPC content within the marrow. When G-CSF and EGF are administered in combination following 5-FU, mice display increased HSPC compared to mice that received either agent alone, indicating the function of G-CSF has synergy with EGF. These findings are buffeted by a prior report that associated G-CSF and EGFR signaling [39]. Using a genetic approach, Ryan et al. localized the region that was responsible for G-CSF-mediated hematopoietic mobilization to a region within the EGFR locus [39]. Our data demonstrated increased hematopoietic stem/progenitor cell content in the marrow following 5-FU when G-CSF and EGF are co-administered. These data are consistent with published results showing that G-CSF and EGF treatment contributed to the retention of HSPCs in the marrow [39]. Without chemotherapy, EGF does not increase G-CSFR expression, and conversely, G-CSF does not alter EGFR expression. It is possible that this cross-induction of receptor expression requires an injured marrow, like that caused in the setting of chemotherapy. Finally, our results from murine models were validated in humans in which treatment with 5-FU increased levels of EGFR in CD34+ hematopoietic cells in vivo. Moreover, treatment with G-CSF in healthy human donors showed a modest increase in phosphorylation of EGFR within the CD34+ stem/progenitor cell pool.
Although EGF is a known mitogen, culture of cancer cell lines with EGF increased cell viability in only 1 of 5 cell lines. This cell line HCT-116 displayed high levels of EGFR expression. EGFR expression or mutational status is not assessed in patients with colorectal cancer, since its status does not predict response to anti-EGFR therapies [40]. Additional screens of cell lines are required to predict whether EGF could be administered without encouraging cancer cell proliferation.
The hematopoietic phenotype of mice with deficiency of EGFR or G-CSFR have been previously described [18, 41, 42]. Tissue-specific deletion of EGFR within cells of hematopoietic lineages resulted in no differences in complete blood counts nor ability to generate committed progenitors in methylcellulose assays in homeostasis [18]. Only following myelosuppressive radiation does the deficiency of EGFR delay hematopoietic stem/progenitor cell regeneration compared to animals with functional EGFR [18]. Mice that are deficient in G-CSFR have quantitatively decreased numbers of neutrophils, though these neutrophils have normal function and can emigrate appropriately to sites of inflammation [41]. Targeted deletion of the intracellular component of G-CSFR further impairs chemotaxis of neutrophils and neutrophil mobilization from the marrow following G-CSF administration [42]. These data demonstrate that G-CSFR is a major regulator of hematopoiesis in homeostasis, but whether EGFR and G-CSFR signaling are coordinated in response to myelosuppressive stressors are incompletely defined.
Clinical reports have suggested that EGF signaling might promote signal transduction through G-CSFR. Patient case studies suggest that a subset of lung carcinomas, of which about a 1/3 will bear EGFR-positive mutations [43], could produce cytokines that cause extreme leukocytosis or a leukemoid reaction [32], possibly by signal transduction through G-CSFR. For example, a patient with lung sarcomatoid carcinoma, that was highly positive for EGFR by immunohistochemistry, developed leukocytosis with 140 × 109/L WBC (normal range 3–10 × 109/L) in the absence of infectious symptoms and pharmacologic G-CSF treatment [32]. In a series of more than 550 patients with non-small cell lung cancers, 11% of patients presented with leukocytosis or thrombocytosis at the time of diagnosis [31]. This incidence of leukocytosis or thrombocytosis increases to 72% in patients with advanced-stage disease in non-small cell lung cancers and portends a poorer prognosis compared to patients without elevations in blood counts [31]. Other reports have suggested that EGFR-driven cancers could elaborate growth factors, including G-CSF and granulocyte-macrophage colony stimulating factor, to promote a cancer survival advantage [44]. Indeed, lung carcinoma in cultures supplemented with EGF had increased levels of G-CSF in the conditioned media compared to saline-treated cultures [45]. These data are suggestive that cancers with EGFR-positive mutations could promote leukocytosis. Whether leukocytosis was due to EGF and signal transduction through EGFR or G-CSFR remains to be defined. In addition, whether EGF preferentially binds to either EGFR or G-CSFR following 5-FU is still unknown.
CONCLUSIONS
EGF regulates hematopoietic stem cell regeneration following myelosuppressive chemotherapy. When administered in combination with G-CSF, dual therapy results in synergistic activity. Translationally, EGF could be administered either as monotherapy or in combination with G-CSF to accelerate hematopoietic regeneration and improve the chances of cure for patients with EGFR-negative malignancies.
Supplementary Material
SIGNIFICANCE STATEMENT.
Whether epidermal growth factor (EGF), like granulocyte colony stimulating factor (G-CSF), promotes hematopoietic regeneration following chemotherapy is unknown. We demonstrate that EGF accelerates hematopoietic regeneration by increasing expression of G-CSFR. After 5-FU, administration of EGF and G-CSF was synergistic compared to either EGF or G-CSF alone. These data indicate that dual therapy with EGF and G-CSF could accelerate hematopoietic recovery following chemotherapy-induced myelosuppression.
Acknowledgments
Funding: National Cancer Institute of the National Institutes of Health K08CA184552 (PLD) and Duke Cancer Institute as part of the P30 Cancer Center Support Grant (NIH CA014236, PLD).
We thank David G. Kirsch, M.D., Ph.D. for providing VEcadherinCre;BaxFL/+ and BaxFL/FL mice. We thank Joel R. Ross, Ph.D. for preparation of the graphical abstract. This work was funded by the National Cancer Institute of the National Institutes of Health under Award Number K08CA184552 (PLD) and the Duke Cancer Institute as part of the P30 Cancer Center Support Grant (Grant ID: NIH CA014236, PLD).
Footnotes
Conflict of Interest: The authors declare no competing financial interests.
Author Contributions:
Sadhna O. Piryani: Collection and Assembly of Data, Data Analysis and Interpretation, Critical Review of Manuscript, Final Approval of Manuscript
Angel Y.F. Kam: Collection and Assembly of Data, Data Analysis and Interpretation, Critical Review of Manuscript, Final Approval of Manuscript
Evelyna G. Kliassov: Collection and Assembly of Data, Data Analysis and Interpretation
Benny J. Chen: Data Interpretation, Critical Review of Manuscript, Final Approval of Manuscript
Neil L. Spector: Data Interpretation, Critical Review of Manuscript
John P. Chute: Data Interpretation, Critical Review of Manuscript
David S. Hsu: Data Interpretation, Provision of Study Materials
Nelson J. Chao: Data Interpretation, Critical Review of Manuscript, Final Approval of Manuscript
Phuong L. Doan: Conception and Design, Financial Support, Collection and Assembly of Data, Data Analysis and Interpretation, Manuscript Writing, Final Approval of Manuscript
References
- 1.Crawford J, Ozer H, Stoller R, et al. Reduction by granulocyte colony-stimulating factor of fever and neutropenia induced by chemotherapy in patients with small-cell lung cancer. The New England Journal of Medicine. 1991;325:164–170. doi: 10.1056/NEJM199107183250305. [DOI] [PubMed] [Google Scholar]
- 2.Kuderer NM, Dale DC, Crawford J, et al. Impact of primary prophylaxis with granulocyte colony-stimulating factor on febrile neutropenia and mortality in adult cancer patients receiving chemotherapy: A systematic review. Journal of clinical oncology: official journal of the American Society of Clinical Oncology. 2007;25:3158–3167. doi: 10.1200/JCO.2006.08.8823. [DOI] [PubMed] [Google Scholar]
- 3.Smith TJ, Bohlke K, Lyman GH, et al. Recommendations for the use of wbc growth factors: American society of clinical oncology clinical practice guideline update. J Clin Oncol. 2015;33:3199–3212. doi: 10.1200/JCO.2015.62.3488. [DOI] [PubMed] [Google Scholar]
- 4.Demetri GD, Griffin JD. Granulocyte colony-stimulating factor and its receptor. Blood. 1991;78:2791–2808. [PubMed] [Google Scholar]
- 5.Kiel MJ, Yilmaz OH, Iwashita T, et al. Slam family receptors distinguish hematopoietic stem and progenitor cells and reveal endothelial niches for stem cells. Cell. 2005;121:1109–1121. doi: 10.1016/j.cell.2005.05.026. [DOI] [PubMed] [Google Scholar]
- 6.Mendez-Ferrer S, Michurina TV, Ferraro F, et al. Mesenchymal and haematopoietic stem cells form a unique bone marrow niche. Nature. 2010;466:829–834. doi: 10.1038/nature09262. [DOI] [PMC free article] [PubMed] [Google Scholar]
- 7.Chow A, Lucas D, Hidalgo A, et al. Bone marrow cd169+ macrophages promote the retention of hematopoietic stem and progenitor cells in the mesenchymal stem cell niche. The Journal of Experimental Medicine. 2011;208:261–271. doi: 10.1084/jem.20101688. [DOI] [PMC free article] [PubMed] [Google Scholar]
- 8.Ding L, Saunders TL, Enikolopov G, et al. Endothelial and perivascular cells maintain haematopoietic stem cells. Nature. 2012;481:457–462. doi: 10.1038/nature10783. [DOI] [PMC free article] [PubMed] [Google Scholar]
- 9.Ding L, Morrison SJ. Haematopoietic stem cells and early lymphoid progenitors occupy distinct bone marrow niches. Nature. 2013;495:231–235. doi: 10.1038/nature11885. [DOI] [PMC free article] [PubMed] [Google Scholar]
- 10.Himburg HA, Doan PL, Quarmyne M, et al. Dickkopf-1 promotes hematopoietic regeneration via direct and niche-mediated mechanisms. Nature Medicine. 2017;23:91–99. doi: 10.1038/nm.4251. [DOI] [PMC free article] [PubMed] [Google Scholar]
- 11.Montfort MJ, Olivares CR, Mulcahy JM, et al. Adult blood vessels restore host hematopoiesis following lethal irradiation. Exp Hematol. 2002;30:950–956. doi: 10.1016/s0301-472x(02)00813-5. [DOI] [PubMed] [Google Scholar]
- 12.Chute JP, Muramoto GG, Salter AB, et al. Transplantation of vascular endothelial cells mediates the hematopoietic recovery and survival of lethally irradiated mice. Blood. 2007;109:2365–2372. doi: 10.1182/blood-2006-05-022640. [DOI] [PMC free article] [PubMed] [Google Scholar]
- 13.Zachman DK, Leon RP, Das P, et al. Endothelial cells mitigate DNA damage and promote the regeneration of hematopoietic stem cells after radiation injury. Stem Cell Research. 2013;11:1013–1021. doi: 10.1016/j.scr.2013.07.001. [DOI] [PMC free article] [PubMed] [Google Scholar]
- 14.Chute JP, Muramoto GG, Fung J, et al. Soluble factors elaborated by human brain endothelial cells induce the concomitant expansion of purified human bm cd34+cd38- cells and scid-repopulating cells. Blood. 2005;105:576–583. doi: 10.1182/blood-2004-04-1467. [DOI] [PubMed] [Google Scholar]
- 15.Himburg HA, Muramoto GG, Daher P, et al. Pleiotrophin regulates the expansion and regeneration of hematopoietic stem cells. Nature Medicine. 2010;16:475–482. doi: 10.1038/nm.2119. [DOI] [PMC free article] [PubMed] [Google Scholar]
- 16.Chute JP, Saini AA, Chute DJ, et al. Ex vivo culture with human brain endothelial cells increases the scid-repopulating capacity of adult human bone marrow. Blood. 2002;100:4433–4439. doi: 10.1182/blood-2002-04-1238. [DOI] [PubMed] [Google Scholar]
- 17.Kobayashi H, Butler JM, O’Donnell R, et al. Angiocrine factors from akt-activated endothelial cells balance self-renewal and differentiation of haematopoietic stem cells. Nature Cell Biology. 2010;12:1046–1056. doi: 10.1038/ncb2108. [DOI] [PMC free article] [PubMed] [Google Scholar]
- 18.Doan PL, Himburg HA, Helms K, et al. Epidermal growth factor regulates hematopoietic regeneration after radiation injury. Nature Medicine. 2013;19:295–304. doi: 10.1038/nm.3070. [DOI] [PMC free article] [PubMed] [Google Scholar]
- 19.Kojima E, Tsuboi A. Effects of 5-fluorouracil on hematopoietic stem cells in normal and irradiated mice. J Radiat Res. 1992;33:218–226. doi: 10.1269/jrr.33.218. [DOI] [PubMed] [Google Scholar]
- 20.Hooper AT, Butler JM, Nolan DJ, et al. Engraftment and reconstitution of hematopoiesis is dependent on vegfr2-mediated regeneration of sinusoidal endothelial cells. Cell Stem Cell. 2009;4:263–274. doi: 10.1016/j.stem.2009.01.006. [DOI] [PMC free article] [PubMed] [Google Scholar]
- 21.Lu M, Zessin AS, Glover W, et al. Activation of the mtor pathway by oxaliplatin in the treatment of colorectal cancer liver metastasis. PloS One. 2017;12:e0169439. doi: 10.1371/journal.pone.0169439. [DOI] [PMC free article] [PubMed] [Google Scholar]
- 22.Stier S, Cheng T, Dombkowski D, et al. Notch1 activation increases hematopoietic stem cell self-renewal in vivo and favors lymphoid over myeloid lineage outcome. Blood. 2002;99:2369–2378. doi: 10.1182/blood.v99.7.2369. [DOI] [PubMed] [Google Scholar]
- 23.Lehr HA, Mankoff DA, Corwin D, et al. Application of photoshop-based image analysis to quantification of hormone receptor expression in breast cancer. J Histochem Cytochem. 1997;45:1559–1565. doi: 10.1177/002215549704501112. [DOI] [PubMed] [Google Scholar]
- 24.Ploemacher RE, van der Sluijs JP, van Beurden CA, et al. Use of limiting-dilution type long-term marrow cultures in frequency analysis of marrow-repopulating and spleen colony-forming hematopoietic stem cells in the mouse. Blood. 1991;78:2527–2533. [PubMed] [Google Scholar]
- 25.Calvi LM, Adams GB, Weibrecht KW, et al. Osteoblastic cells regulate the haematopoietic stem cell niche. Nature. 2003;425:841–846. doi: 10.1038/nature02040. [DOI] [PubMed] [Google Scholar]
- 26.Fabian MA, Biggs WH, 3rd, Treiber DK, et al. A small molecule-kinase interaction map for clinical kinase inhibitors. Nature Biotechnology. 2005;23:329–336. doi: 10.1038/nbt1068. [DOI] [PubMed] [Google Scholar]
- 27.Lim S, Kaldis P. Cdks, cyclins and ckis: Roles beyond cell cycle regulation. Development. 2013;140:3079–3093. doi: 10.1242/dev.091744. [DOI] [PubMed] [Google Scholar]
- 28.Yoshioka A, Tanaka S, Hiraoka O, et al. Deoxyribonucleoside triphosphate imbalance. 5-fluorodeoxyuridine-induced DNA double strand breaks in mouse fm3a cells and the mechanism of cell death. The Journal of Biological Chemistry. 1987;262:8235–8241. [PubMed] [Google Scholar]
- 29.Kriegs M, Kasten-Pisula U, Rieckmann T, et al. The epidermal growth factor receptor modulates DNA double-strand break repair by regulating non-homologous end-joining. DNA Repair. 2010;9:889–897. doi: 10.1016/j.dnarep.2010.05.005. [DOI] [PubMed] [Google Scholar]
- 30.Myllynen L, Rieckmann T, Dahm-Daphi J, et al. In tumor cells regulation of DNA double strand break repair through egf receptor involves both nhej and hr and is independent of p53 and k-ras status. Radiother Oncol. 2011;101:147–151. doi: 10.1016/j.radonc.2011.05.046. [DOI] [PubMed] [Google Scholar]
- 31.Boddu P, Villlines D, Aklilu M. paraneoplastic leukocytosis and thrombocytosis as prognostic biomarkers in non-small cell lung cancer. Zhongguo Fei Ai Za Zhi. 2016;19:725–730. doi: 10.3779/j.issn.1009-3419.2016.11.02. [DOI] [PMC free article] [PubMed] [Google Scholar]
- 32.Wang D, Zhang H, Yu F, et al. Extreme leukocytosis and leukemoid reaction associated with the lung sarcomatoid carcinoma: An unusual case report. Int J Gen Med. 2017;10:7–9. doi: 10.2147/IJGM.S102524. [DOI] [PMC free article] [PubMed] [Google Scholar]
- 33.Doan PL, Russell JL, Himburg HA, et al. Tie2(+) bone marrow endothelial cells regulate hematopoietic stem cell regeneration following radiation injury. Stem Cells (Dayton, Ohio) 2013;31:327–337. doi: 10.1002/stem.1275. [DOI] [PMC free article] [PubMed] [Google Scholar]
- 34.Lerner C, Harrison DE. 5-fluorouracil spares hemopoietic stem cells responsible for long-term repopulation. Exp Hematol. 1990;18:114–118. [PubMed] [Google Scholar]
- 35.Randall TD, Weissman IL. Phenotypic and functional changes induced at the clonal level in hematopoietic stem cells after 5-fluorouracil treatment. Blood. 1997;89:3596–3606. [PubMed] [Google Scholar]
- 36.Jiang C, Hu X, Wang L, et al. Excessive proliferation and impaired function of primitive hematopoietic cells in bone marrow due to senescence post chemotherapy in a t cell acute lymphoblastic leukemia model. J Transl Med. 2015;13:234. doi: 10.1186/s12967-015-0543-8. [DOI] [PMC free article] [PubMed] [Google Scholar]
- 37.Suryadinata R, Sadowski M, Sarcevic B. Control of cell cycle progression by phosphorylation of cyclin-dependent kinase (cdk) substrates. Biosci Rep. 2010;30:243–255. doi: 10.1042/BSR20090171. [DOI] [PubMed] [Google Scholar]
- 38.Sheng G, Bernabe KQ, Guo J, et al. Epidermal growth factor receptor-mediated proliferation of enterocytes requires p21waf1/cip1 expression. Gastroenterology. 2006;131:153–164. doi: 10.1053/j.gastro.2006.05.007. [DOI] [PubMed] [Google Scholar]
- 39.Ryan MA, Nattamai KJ, Xing E, et al. Pharmacological inhibition of egfr signaling enhances g-csf-induced hematopoietic stem cell mobilization. Nature Medicine. 2010;16:1141–1146. doi: 10.1038/nm.2217. [DOI] [PMC free article] [PubMed] [Google Scholar]
- 40.Jonker DJ, O’Callaghan CJ, Karapetis CS, et al. Cetuximab for the treatment of colorectal cancer. The New England Journal of Medicine. 2007;357:2040–2048. doi: 10.1056/NEJMoa071834. [DOI] [PubMed] [Google Scholar]
- 41.Liu F, Wu HY, Wesselschmidt R, et al. Impaired production and increased apoptosis of neutrophils in granulocyte colony-stimulating factor receptor-deficient mice. Immunity. 1996;5:491–501. doi: 10.1016/s1074-7613(00)80504-x. [DOI] [PubMed] [Google Scholar]
- 42.Semerad CL, Poursine-Laurent J, Liu F, et al. A role for g-csf receptor signaling in the regulation of hematopoietic cell function but not lineage commitment or differentiation. Immunity. 1999;11:153–161. doi: 10.1016/s1074-7613(00)80090-4. [DOI] [PubMed] [Google Scholar]
- 43.Zhang YL, Yuan JQ, Wang KF, et al. The prevalence of egfr mutation in patients with non-small cell lung cancer: A systematic review and meta-analysis. Oncotarget. 2016;7:78985–78993. doi: 10.18632/oncotarget.12587. [DOI] [PMC free article] [PubMed] [Google Scholar]
- 44.Akbay EA, Koyama S, Carretero J, et al. Activation of the pd-1 pathway contributes to immune escape in egfr-driven lung tumors. Cancer Discov. 2013;3:1355–1363. doi: 10.1158/2159-8290.CD-13-0310. [DOI] [PMC free article] [PubMed] [Google Scholar]
- 45.Phan VT, Wu X, Cheng JH, et al. Oncogenic ras pathway activation promotes resistance to anti-vegf therapy through g-csf-induced neutrophil recruitment. Proc Natl Acad Sci U S A. 2013;110:6079–6084. doi: 10.1073/pnas.1303302110. [DOI] [PMC free article] [PubMed] [Google Scholar]
Associated Data
This section collects any data citations, data availability statements, or supplementary materials included in this article.