Abstract
Purpose.
We generated a model of eye growth and tested it against an eye known to develop abnormally, one with a history of retinopathy of prematurity (ROP).
Methods.
We reviewed extant magnetic resonance images (MRIs) from term and preterm-born patients for suitable images (n = 129). We binned subjects for analysis based upon postmenstrual age at birth (in weeks) and ROP history (“Term” ≥ 37, “Premature” ≤ 32 with no ROP, “ROP” ≤ 32 with ROP). We measured the axial positions and curvatures of the cornea, anterior and posterior lens, and inner retinal surface. We fit anterior chamber depth (ACD), posterior segment depth (PSD), axial length (AL), and corneal and lenticular curvatures with logistic growth curves that we then evaluated for significant differences. We also measured the length of rays from the centroid to the surface of the eye at 5° intervals, and described the length versus age relationship of each ray, Lray(x), using the same logistic growth curve. We determined the rate of ray elongation, Eray(x), from Lray dy/dx. Then, we estimated the scleral growth that accounted for Eray(x), G(x), at every age and position.
Results.
Relative to Term, development of ACD, PSD, AL, and corneal and lenticular curvatures was delayed in ROP eyes, but not Premature eyes. In Term infants, G(x) was fast and predominantly equatorial; in age-matched ROP eyes, maximal G(x) was offset by approximately 90°.
Conclusions.
We produced a model of normal eye growth in term-born subjects. Relative to normal, the ROP eye is characterized by delayed, abnormal growth.
Keywords: magnetic resonance imaging, development, ocular, lens development, retinopathy of prematurity
Models of normal and abnormal eye growth were created from a study of extant MRIs.
The relatively oblate eyes of infants typically become relatively prolate with maturation,1 a process influenced by intrinsic developmental signals and by visual experience.2 However, a fundamental question in ophthalmology is specifically where and when the eye grows to transform from its neonatal to its adult shape. Having an accurate, mathematical model of the normal growth of the eye is essential to understanding the mechanisms that underpin typical and atypical ocular development. This is pertinent to the development of common conditions, such as myopia, and less common conditions, such as retinopathy of prematurity (ROP).
Infants born preterm are at increased risk for developing a range of structural ophthalmic sequelae that include impaired ocular growth and a broader-than-normal distribution of refractive error, particularly myopia.3,4 Paradoxically, myopia is typically associated with longer-than-average eyes, but, in ROP myopia, the eye frequently is short.3–14 To be small and myopic, the anterior segment of the ROP eye must be of substantially higher-than-normal dioptric power. Relative to myopic adults born full-term, adults with the same degree of myopia and a history of ROP have eyes with increased corneal curvature (CC), increased lens thickness (LT), and shallower anterior chamber depth (ACD); among these features, the increased CC may be most responsible for the myopia.12
It is clear that preterm birth, and in particular ROP, influences refractive development.4,8,15 For instance, development of the cornea is arrested in the eye with a history of ROP, and so it may be that the eye simply does not lose optical power fast enough to emmetropize.4,16 With respect to the posterior segment, the retina is one controller of eye growth (and, thus, refractive development).17,18 Evidence from simian eyes19,20 strongly indicates that it is the peripheral retina, in particular, which is most important to the process of emmetropization (although the evidence in humans is weaker21). Notably, the peripheral retinal vasculature is abnormal (or even absent) in eyes with ROP.22 Severity of antecedent ROP is correlated positively with incidence and magnitude of refractive error23–25 and with delays in eye growth, anterior and posterior.16 Cycloplegic refractions indicate that the myopic shift in developing ROP eyes happens early and then persists.23,24,26,27 Laser- (or cryo-) therapy, per se, does not seem to influence refractive outcome.26–28 Other biometric measurements of the eye, such as axial length (AL), CC, LT, anterior segment length (ASL) to posterior segment depth (PSD) ratio, and so forth, also have been obtained from various ROP populations.9,10,12,13,16,29–32 However, to our knowledge, no undertaking has yet been made to describe or model the development of these ocular components from infancy to adulthood in ROP eyes.
Therefore, in this retrospective study, we used magnetic resonance images (MRIs), collected cross-sectionally at preterm through young-adult ages, to chart the development of the eye, and then mathematical modeling to estimate the growth of the eye (including the cornea and posterior segment) throughout development. To our knowledge, ours is the first model ever to indicate where and when the eye grows as it matures. Then, we tested our model of eye growth by applying it to the detection of developmental differences between term-born eyes and preterm-born eyes with and without ROP. Our results indicated that ROP, much more than preterm birth alone, is associated with developmental abnormalities of the eye.
Methods
Our study was a retrospective chart review of extant MRIs obtained in the course of patients' clinical care at Boston Children's Hospital. We retrieved all records from the Department of Radiology's SYNAPSE (Fujifilm Holdings Corp., Tokyo, Japan) database. The images had been collected using multiple scanners at different resolutions during approximately the past 5 years. The database contained a total of >24,000 T2-weighted head scans displaying images of the eyes. We reviewed only scans meeting certain acquisition requirements, including isometry in the transverse plane and maximum voxel size (2.5 mm in any dimension). From those, we selected only scans showing high-quality images of the eyes (e.g., motion artifacts, wrapping, or low contrast caused us to reject images).
Excepting adjustments made for multiple post hoc comparisons (described below), we set the threshold for significance at 95% certainty (α = 0.05) for statistical comparisons performed on this dataset.
This study was approved by the Boston Children's Hospital Institutional Review Board and adhered to the tenets of the Declaration of Helsinki.
Subjects
We reviewed, for ophthalmology notes, the charts of all patients whose MRIs passed the initial quality checks; any without ophthalmology notes were excluded from further consideration. Any history, other than preterm birth or ROP, of conditions associated with altered eye growth or altered refractive development (such as cataract, congenital retinal detachment, glaucoma, intraocular surgery other than for the management of ROP, intraocular tumor, microphthalmia, persistent hyperplastic primary vitreous, systemic disorders, or tuberous sclerosis) were exclusion criteria. Finally, only subjects with documented postmenstrual age (PMA) at birth were included. After this review, we determined there were 162 eligible subjects. For subjects who had multiple scans, we selected the scan temporally closest to an ophthalmology visit for analysis.
For statistical analysis, subjects were binned into one of three levels of “Group” based on the PMA (in weeks) at which they were born and then on ROP history: We labeled subjects “Term” (n = 77) if they were born ≥37 weeks PMA, “Preterm” (n = 23) if they were born ≤32 weeks PMA and had no history of ROP, and “ROP” (n = 31) if they were born ≤32 weeks PMA and had a history of ROP noted in their medical charts. We excluded subjects born at intermediate ages (32–37 weeks PMA, n = 31). Finally, we excluded from the analyses two ROP subjects who had ALs that were the longest observed in any group at any age because ROP eyes are typically shorter than normal and, thus, we felt that their eyes did not represent the typical developmental process in ROP (final n = 129; ROP n = 29). As summarized in the Table, our subjects were sent for MRI mainly because of injury, complications of preterm birth, seizures, or headache. Other reasons included hearing loss, developmental delay, and complications of cleft palate.
Table.
Reasons for MRI by Age (Corrected Years) and Group
Image Analyses
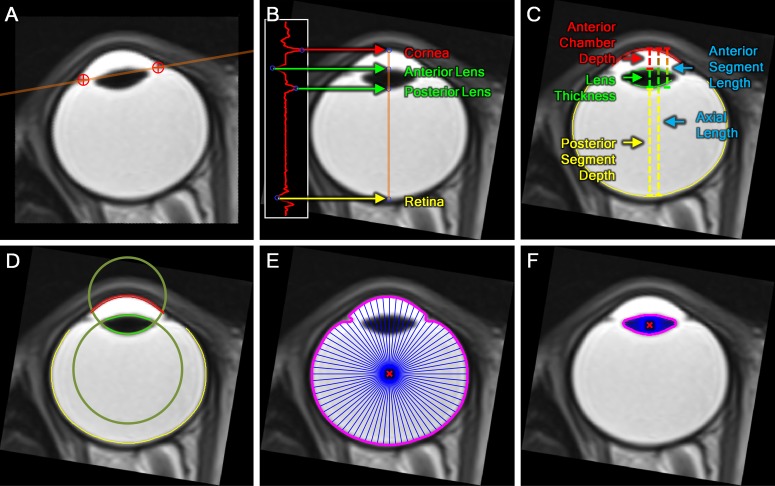
We accessed each subject's MR study session in Voxar3D (Toshiba Medical Visualization Systems Europe, Ltd., Edinburgh, UK) and, by tilt, rotation, and panning, identified the transverse plane through the image that displayed the largest globe cross-section and included the pupil and optic nerve. We exported these derived slices as bitmap images for processing in an adapted version of our custom-developed software.33 The steps in the image analysis procedure are illustrated in Figure 1. In brief: (A) With input from the operator, the software rotated each image so that the plane of the ciliary body was parallel with the horizontal image axis. (B) The program automatically defined the positions of the cornea, lens, and retina by identifying troughs and peaks in the derivative of the intensity profile of a line drawn through the pupil–posterior pole axis of the eye. (C) From the relative positions of these features, we derived ACD (posterior cornea to anterior lens), ASL (anterior cornea to posterior lens), LT (anterior lens to posterior lens), PSD (posterior lens to retina), and AL (anterior cornea to retina). (D) We then identified and segmented edges representing the anterior and posterior cornea, anterior and posterior lens, retina, and sclera. We root mean square (RMS) error fit the corneal and lenticular surfaces with respective circles to generate measurements of curvature. (E) Then, we determined the arithmetic mean position of all pixels in the image of the eye (the centroid), defined by the vitreoretinal and aqueocorneal boundaries, and measured the length of rays, drawn every 5°, from the centroid to the surface. (F) Similarly, we measured the length of rays from the centroid to the margin of the lens.
Figure 1.
The MRI analysis procedure. (A) Sample MRI section exported from Voxar3D. The image must be rotated such that the plane of the ciliary body (brown line), indicated by the operator (red crosshairs), is parallel to the horizontal image axis. (B) Following image rotation, the first derivative of the brightness profile of the axis of the eye (plotted to the left) was obtained. Troughs and peaks in this profile (circles), which corresponded to the cornea, anterior lens, posterior lens, and retina, were automatically identified. (C) From the positions of the identified features, ACD, LT, and PSD were calculated. Corresponding surfaces also were identified (red, cornea; green, lens; yellow, retina). (D) Circles were fit to the anterior and posterior cornea (not shown) and lens (shown) to determine radii of curvature. (E) Rays from the centroid of each eye (red X) were measured to the inner edge of the eye (magenta line) every 5°. (F) This process was repeated for the lens.
Development of Biometric Parameters
To quantitatively contrast the development of ACD, LT, PSD, AL, CC (the average of each cornea's anterior and posterior curvature values), anterior lens curvature (ALC), posterior lens curvature (PLC), and the ratio of ASL to PSD between the groups, we fit each of these parameters with respective generalized logistic growth curves of the form
 |
In our implementation of Equation 1, x was always PMA, a described the magnitude of the total developmental change in the parameter f(x), b was related to the slope of the function, c was the age at which the change in f(x) reached half of a, and y0 represented the initial value of f(x). In the majority of cases, specified in the appropriate location in the Results, we fixed y0 at 0; otherwise, all parameters were free to vary.
We evaluated whether Term, Preterm, and ROP subjects' data fit with respective curves (Equation 1) provided a significantly better fit than all three groups' data fit with a single curve. Specifically, we tested the null hypothesis that the additional fitting accuracy (i.e., lower total sum of squared errors, SS) obtained by the use of more than one curve was not offset by the increase in the degrees of freedom (df) afforded by more curves (i.e., “one curve for all data sets”). With individual eye data fit with each curve, this hypothesis can be tested using the formula
 |
where SS1 is the total sum of the squared deviations from individual points to the solitary fit, SS2 is the total sum of the squared deviations to the three respective fits, n is the total number of subjects in the analysis (so 2n would be the number of eyes), k is the number of groups being tested, and p is the number of parameters in Equation 1 that were allowed to freely vary (typically 3, as y0 was usually fixed at 0).34 The main difference between this calculation and a typical ANOVA is that the error calculations are based upon the mean square (MS) difference from the fitted group curve (Equation 1) rather than from the group mean. However, since two eyes contributed by a subject are likely to be more similar than two eyes contributed by different subjects, the within-individual variability needed to be accounted for and, thus, we modified the F ratio as follows:
 |
where SSR is the sum of the squared intraocular (i.e., repeated-measures) differences from the group mean difference to the three respective fits. The inclusion of SSR in the modified formula (Equation 3), means that the F ratio now includes the ratio of the MS between treatments to the MS subject by treatments (Hays35 formula 13.21.4). We evaluated F with the difference between the number of parameters in the multiple and single curve scenarios as dfnumerator (e.g., multiple curve scenario = 3 curves × 3 free parameters = 9; single curve scenario = 3 free parameters; dfnumerator = 9 − 3 = 6), and the number of subjects less the number of groups (e.g., dfdenominator = n − k = 129 − 3 = 126). The combined use of Equation 3 in the calculation of F and of subjects instead of eyes in the calculation dfdenominator results in an appropriately increased threshold for statistical significance that offsets the putatively decreased variability in the sample inherent in our repeated-measures design.35 Where statistical significance was attained, we concluded that a “different curve for each data set” was appropriate. In those cases, we performed post hoc pairwise comparisons, following the same procedure, to detect which of the three respective curves differed from which others. We made the threshold for statistical significance more stringent (α = 0.01) for these pairwise post hoc tests.
Ocular Abnormalities
To make general statements contrasting the intraocular structures in the three evaluated groups feasible, we developed an “abnormality” score to control for the confounding variable of age-at-test: For each parameter in every eye, we calculated an abnormality score (i.e., Δnormal) by subtracting the Term group's growth curve from every respective measured value. We tested for significant group differences in the abnormality data by two-factor (Group × Eye), repeated-measures ANOVA. Where a significant Group effect was detected, we evaluated intergroup differences, pairwise, using Tukey's Honestly Significant Difference (HSD) post hoc statistical test (SigmaPlot 11.2; Systat Software, Inc., San Jose, CA, USA).
Modeling the Development of the Globe and Lens
To generate model eyes and lenses at any age, we measured the length of rays from the centroid of each (eye or lens) to its surface, at 5° intervals. We preserved relative orientation data (nasal versus temporal) by analyzing the images of left-eyes after flipping them over the axis of the eye; thus, growth modeling was done on actual and pseudo right-eyes. We then described the length of each ray, Lray, as a function of age by fit of Equation 1 (Lray[x] = f[x]); we fixed y0 at 0 when fitting the eye data, but allowed it to vary freely when fitting the lens data (as noted in the Results, below, LT did not increase during the ages observed in our study). So that the position of the lens could be tracked relative to the eye, we also fit the X and Y offsets of the lens centroid, relative to the eye centroid, using Equation 1 with all parameters free to vary. We next calculated the rate of elongation, Eray, from the derivative of Lray:
 |
Because we evaluated Lray at 5° intervals, we produced 72 elongation curves, which we denoted by their angle from the axis of the eye. Below, we use θ and φ to reference these 72 spots on the eye or lens. Since Lray approximates the radius of a circle, the scleral growth that would increase the circumference of the eye at a rate of Eray, Ecirc, is:
 |
Importantly, we noted that scleral growth at point θ, Gθ(x), and at point θ + 180°, both contribute nothing to Eray at θ; conversely, half of the scleral growth at θ ± 90° contributes to Eray at θ (the other half contributes to Eray at θ + 180°), and growth at intermediate angles contributes intermediate amounts. A practical consequence of this is that growth at the equator would serve only to make eyes longer along the axis, whereas growth at the axis would only make eyes wider at the equator; growth at intermediate eccentricities would make eyes longer and wider. Therefore, to calculate the growth occurring at any age (x) and any position (θ) around the globe, G′θ, we referenced the values of Ecirc at every point around the eye (φ) and scaled them based upon their relationship to θ using the formula
 |
 |
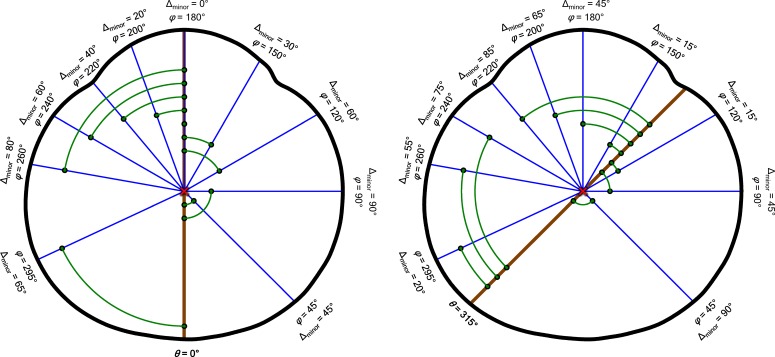
In Equations 6a and 6b, θ and φ indicate points (in our case, every 5°) around the globe. The point at which growth is being measured is θ. It is measured by evaluating the contributions of Ecirc at every other point, φ. Δminor(φ,θ) is the “minor angle” between a φ and θ pair, and we calculated it as shown in Equation 6b. Figure 2 illustrates the relationships between θ, φ, and Δminor for the same 10 positions of φ and two different positions of θ. For an example from the figure, the contribution that Ecirc at position 220 makes when G′ is evaluated at position 315 is Ecirc,220(x) × 85/360 because Δminor(220,315) = 85. By applying Equations 6a and 6b at every x (birth to 10 years corrected age) to every θ (0°–355° in 5° steps) and referencing Ecirc at every φ (0°–355° in 5° steps), we derived a model of where and when the eye grows. Notably, this measure of scleral growth, G′θ, is proportional at each θ, but increases in absolute value with the number of contributing points, φ. However, it can be normalized to the actual growth, in millimeters, around the sclera, Gθ(x), using the following correction factor:
 |
Figure 2.
Demonstration of the calculation of minor angles (Δminor, Equation 6b) to 10 preselected points, φ, from two starting positions, θ: one at the direct posterior of the eye (θ = 0°, left) and one 45° nasal (θ = 315°, right). Angles are measured counterclockwise from the posterior pole around the centroid (red X) of a model eye (thick black line); the positions of the same 10 values of φ are indicated in both panels by blue line segments. As shown, Δminor (green arcs and points) is computed as the smallest angle from φ to the line connecting the centroid and θ (brown line). Growth (Gθ', Equation 6a) is measured all around the globe at every θ, accounting for contributions (Ecirc,φ) from every φ (not just the 10 shown above) scaled by Δminor (Equation 6b).
This was equivalent to G′θ ÷ 9, in our analysis, because φ was in 5° increments.
Results
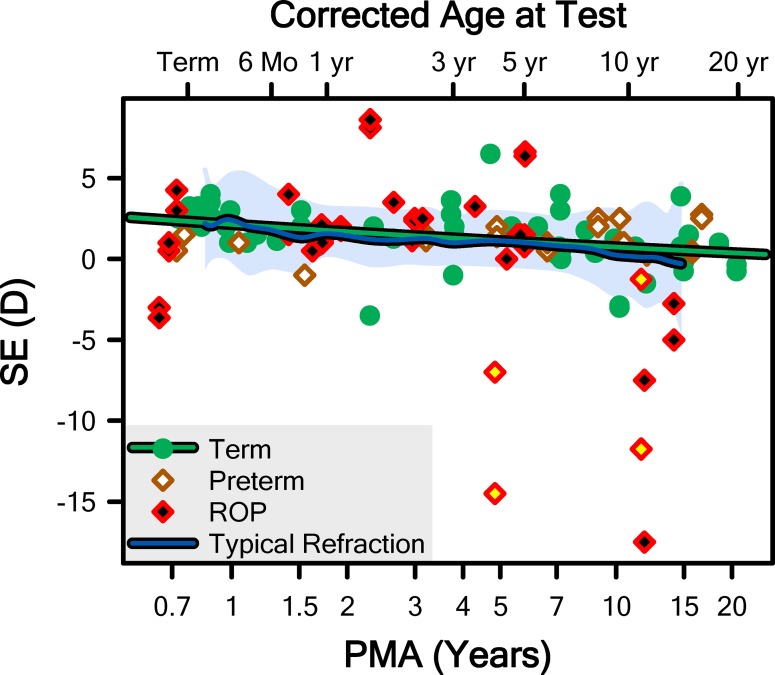
We found results of refractions for 75 (58%) of our subjects. The spherical equivalent (SE) refractions are plotted in Figure 3 along with the mean and 5th to 95th prediction limits for normal derived from Mayer et al.36 (for ages up to 4 years) and the Collaborative Longitudinal Evaluation of Ethnicity and Refractive Error (CLEERE) study (for ages 6–14 years).37 Encouragingly, our Term-born sample appeared to be following the normal course of emmetropization with respect to SE.
Figure 3.
The SE refraction, from the 75 subjects for which this information was available, plotted as a function of postmenstrual age. The mean (blue line) and 5th to 95th prediction interval (pale shaded region) for “typical refraction” was obtained from Mayer et al.36 and the CLEERE study group.37 The green line is the fit of the Term data with Equation 1. The data from the eyes of two ROP subjects with the longest observed axial lengths (Fig. 5) are noted (yellow fills); these subjects were excluded from the fit and all subsequent analyses. Corrected age was calculated as the sum of PMA and 10/13ths of a year (i.e., 40 weeks).
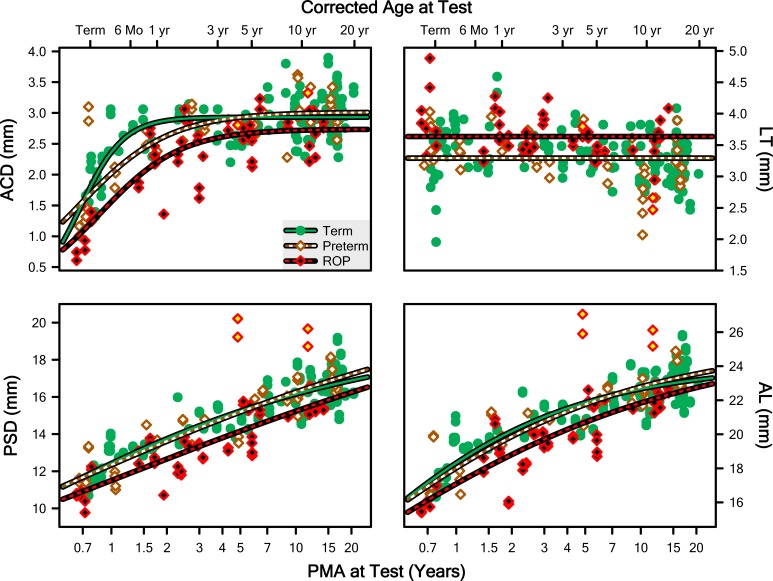
In Figure 4, ACD, LT, PSD, and AL (mm) are plotted as a function of PMA (and corrected age) at test for each Group. The evaluation of the fits of these data with Equation 1 (with y0 fixed at 0 in all cases) revealed that a different curve for each group provided a significantly better model than one curve for all groups for ACD (F = 9.87; df = 6,126; P = 6.53 · 10−9), PSD (F = 4.03; df = 6,126; P = 0.000997), and AL (F = 3.10; df = 6,126; P = 0.00722); note, however, that the fitting process did not converge on a solution for LT for any group. For the three successful fits (ACD, PSD, AL), the pairwise post hoc evaluations found that, on the one hand, the Term and Preterm curves did not significantly differ, in any case. On the other hand, the Term and ROP curves did significantly differ, in every case. The Preterm curve also differed from the ROP curve for ACD only (not PSD or AL). The most notable shift was of the c parameter to the right, indicating that the development of these features of the ROP eye is delayed.
Figure 4.
Measurements from both eyes of every subject plotted as a function of PMA for ACD, LT, PSD, and AL of the whole eye (which is the sum of the other three parameters and a small contribution of corneal thickness). The lines are fits of the data of the Term, Preterm, and ROP groups with Equation 1 with y0 fixed at 0.
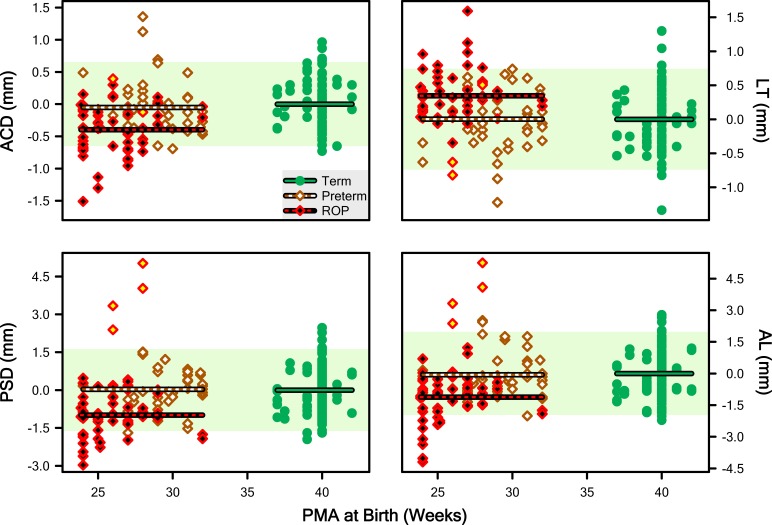
Corresponding abnormality data are plotted as a function of PMA at birth in Figure 5 (we used the mean LT of Term eyes across all ages as the subtrahend since the curve for Term was ambiguous). Respective ANOVA detected significant main effects of Group for each parameter, ACD (F = 13.5; df = 2,126; P = 4.86 · 10−6), LT (F = 9.79; df = 2,126; P = 0.000111), PSD (F = 16.6; df = 2,126; P = 4.14 · 10−7), and AL (F = 13.1; df = 2,126; P = 6.65 · 10−6). The HSD detected differences only between the ROP group and the Term and Preterm subjects; there were two homogenous subsets: “ROP” and “Term and Preterm.” In other words, Term and Preterm were indistinguishable. The direction of the effect in the ROP group was shorter for ACD, PCD, and AL. and longer for LT.
Figure 5.
“Abnormality” scores for ACD, LT, PSD, and AL calculated by taking the difference between each point (minuend) in Figure 4 and the point on the regression line for Term subjects at the same age (subtrahend). Lines plot the mean abnormality for the Term, Preterm, and ROP groups. The pale shaded region indicates the 5th to 95th prediction limit for Term abnormality.
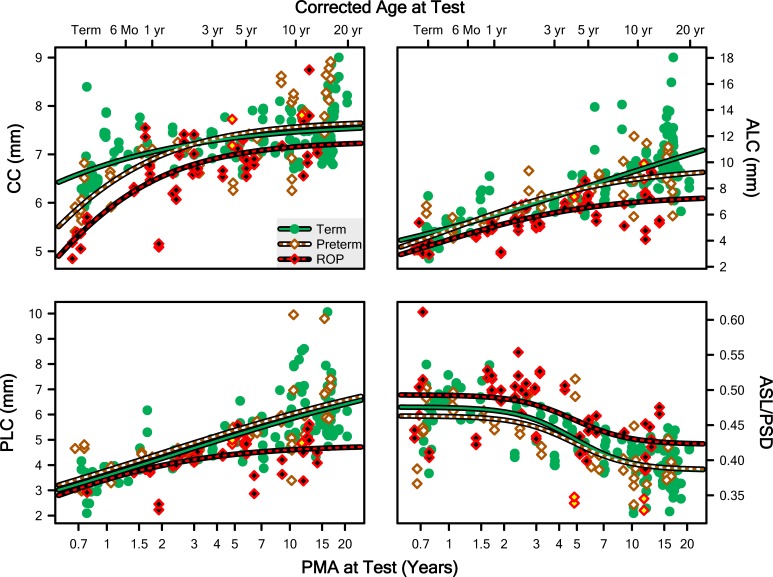
Additional structural features important to the refractive state of the eye are plotted, as a function of age, in Figure 6: CC, ALC, PLC, and the ASL/PSD ratio. The ASL/PSD ratio approximates the ratio of the anterior to posterior nodal distances of the eye (assuming that the cornea and back of the lens approximate the nodes of the eye). We fit the first three of these using Equation 1 with y0 fixed at 0; for the fit to the ratio, y0 was free to vary. In all cases, the curve comparison indicated that a different curve for each group was appropriate: CC (F = 9.46; df = 6,126; P = 1.44 · 10−8), ALC (F = 12.1; df = 6,126; P = 1.04 · 10−10), PLC (F = 8.78; df = 6,126; P = 5.42 · 10−8), and ASL/PSD (F = 4.221; df = 6,126; P = 0.000663). Pairwise post hoc evaluation detected that the Term curves differed from the ROP curves, but not from the Preterm curves, for all four parameters. Furthermore, with the exception of CC, the Preterm curve also was distinct from the ROP curve (i.e., for CC only, the Preterm and ROP data could be satisfactorily fit by a single curve).
Figure 6.
Measurements from both eyes of every subject plotted as a function of PMA for CC, ALC, PLC, and the ratio of the ASL to PSD (ASL/PSD). The lines are fits of the data of the Term, Preterm, and ROP groups with Equation 1 with y0 fixed at 0, except at the bottom right, where y0 was free to vary.
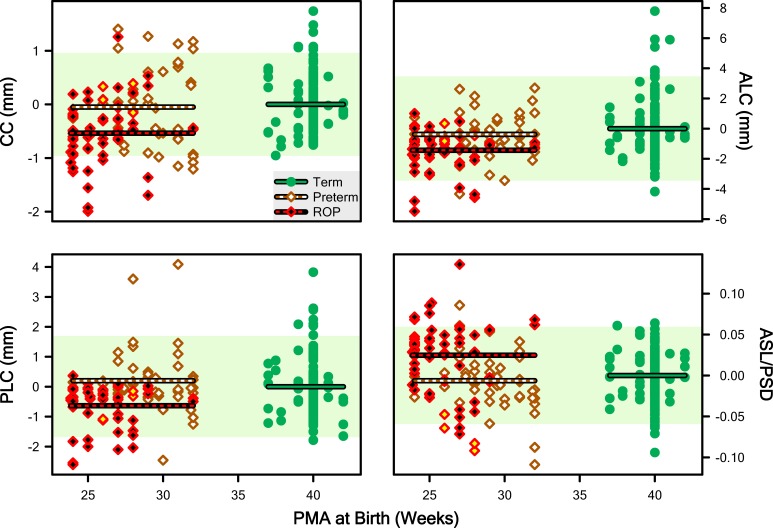
As we did for the length measurements (Fig. 5), we computed abnormality scores for these features and we plot them in Figure 7. The respective ANOVA on these abnormality data detected significant main effects of Group for each parameter: CC (F = 11.1; df = 2,126; P = 3.63 · 10−5), ALC (F = 9.99; df = 2,126; P = 9.42 · 10−5), PLC (F = 8.83; df = 2,126; P = 0.000257), and ASL/PSD (F = 8.03; df = 2,126; P = 0.000524). In each case, HSD testing once again detected two homogenous subsets: ROP, and Term and Preterm.
Figure 7.
“Abnormality” scores for CC, ALC, PLC, and the ratio of ASL to PSD (ASL/PSD). The pale shaded region indicates the 5th to 95th prediction limit for Term abnormality. Lines plot the mean abnormality for the Term, Preterm, and ROP groups.
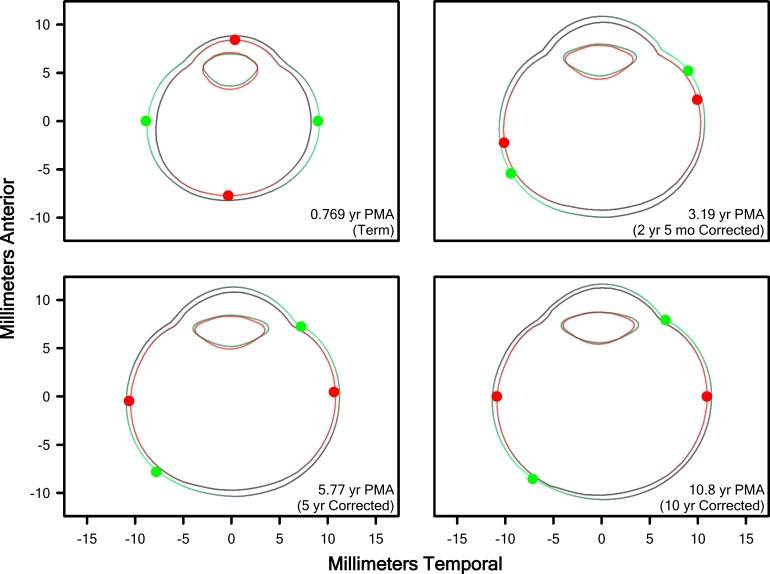
We generated cross-sectional representations of the eye for all ages, term to 10 years (corrected age), from the fits of Equation 1 to the PMA versus length data (72 centroid-to-rim line segments for the eye and lens, respectively). By plotting the connections between nearest neighbors, we generated a boundary with the appearance of an age-typical eye and lens, and plotted these boundaries as a function of PMA. We then used Equations 3 to 7 to estimate the growth required at each point on the boundary of the eye at the selected age and color-coded relative growth of the eye (but not the lens) using a “heatmap.” In Figure 8, for Term and ROP subjects, we plotted model eyes and lenses so generated, at selected ages. In Supplementary Video S1, we plotted the change in these model eyes and lenses as a function of age to visualize, smoothly, ocular and lenticular development. We also facilitated comparison of the shape of the eye, irrespective of size, in a display normalized by the size of the eye. In the Term group, at young ages when growth in the eye was most rapid, the model detected maximum growth near the equator of the eye; thus, the eye normally grows more in length than width over the course of development. Interestingly, in the ROP group, a quite different pattern of growth was detected in the early years: Until approximately age 2½ years, growth of the eye in the ROP group was primarily at the axis, leading ROP eyes to grow more in width than length over the course of development. However, by approximately age 3 years, growth in ROP and term eyes was quite similar. Furthermore, as is apparent in Supplementary Video S1, when the shape of the eye is considered irrespective of size, adult Term and ROP eyes are quite similar, but the shape of the lens remains markedly different.
Figure 8.
Model eye and lens cross-sections from Term (green) and ROP (red) eyes at the ages indicated. Preterm eyes were nearly indistinguishable from Term eyes and are excluded for clarity. Dots indicate the θs of maximal growth, G(x) (Equation 7). Areas of bright color on the eyes indicate regions for which the model indicated the highest growth, while black areas are those the model indicated were growing more slowly; brightness is normalized at each age to the areas of highest and lowest growth, but growth was overall slower at older ages (as evidenced by the decreasing change in size with increasing age).
Discussion
Our model produced plausible growth curves for the normal (i.e., Term) eye. For one example, using A-scan ultrasonography, the CLEERE study group estimated that, from age 6 to 13 years, AL typically grows by approximately 0.64 mm (∼22.54–23.18 mm)38 and our model estimated an almost identical amount of growth, 0.69 mm (22.26–22.94 mm), over the same age range; indeed, our ALs are in good agreement with extant data from preterm to adult ages.39 For another example, it is recognized that the cornea flattens early, relative to the growth of the eye39; this same pattern is clearly evidenced in our data (Fig. 6) wherein CC is shown to saturate early, relative to AL. For additional examples: From age 6 to 12 years, mean ACD measured in CLEERE was approximately 3.11 mm (after subtracting the thickness of the cornea, 0.5 mm40), and our value is approximately 2.93 mm (Fig. 4); at the same ages, CLEERE measures LT at approximately 3.45 mm, and our value is approximately 3.29 mm (Fig. 4)38; lens power is thought to fall precipitously during the first few years of life, largely due to a change in the lens refractive gradient, but also due to a monotonic (and nearly constant) change in curvature,41 and our fits to Term (and Preterm) ALC and PLC followed this same course.
Thus, trusting in our curves, we noted a few interesting features of normal ocular development manifest in our dataset. First, ACD seems to increase only until age approximately 2 years, but PSD continues to increase, albeit at an ever-diminishing rate, for at least another two decades. Similarly, CC reaches maturity early, but ALC and PLC continue to increase indefinitely; experiments on isolated human lenses suggest they increase though the 40s,41 so we would not capture saturation in our sample from pediatric radiology records. With respect to eye growth and emmetropization, our finding that early, rapid growth is mainly at the equator is most consistent with the data that suggest that it is mainly the peripheral retina that mediates these processes; later, smaller-scale refinement of refractive state may be mediated by the fovea.
One place our model failed was in capturing the development of LT. However, it is not surprising that we could not model LT using logistic growth, since changes in LT are known to be multiphasic: increasing in utero to two-thirds–year PMA, decreasing in early childhood, and then slightly increasing again in adolescence.37,38,42–44
With respect to the abnormal development of the ROP eye, for every parameter excepting LT, our models evidenced delayed growth relative to term-born individuals. These delays occurred only in the ROP group and not in the group of similarly preterm-born individuals who never had ROP. Anterior chamber depth, LT, PSD, and AL all differed significantly between Term and ROP subjects at every age, but not between Term and Preterm subjects; in ROP eyes, ACD, PSD, and AL were lower, while LT was higher. The ROP eyes also were characterized by steeper corneas, thicker lenses with steeper anterior and posterior surface curvatures, and relatively short anterior segments. Collectively, these changes would be expected to increase the dioptric power of the anterior of the eye and shorten the posterior nodal distance. Thus, our data are completely consistent with the possibility of short, myopic eyes in ROP; the SEs of our ROP population were relatively myopic, especially at older ages.
Over the course of their development from term to adult shape, the eyes in term-born individuals become relatively prolate. In contrast, the eyes of individuals with a history of ROP are more prolate at term and become relatively oblate with time. However, upon reaching their final, adult shapes, although ROP eyes have some persistent irregularities relative to Term eyes, they are of approximately the same shape with respect to the proportions of their axial and equatorial diameters and CCs; only the lenses remain markedly proportionally different.
Of note, despite the fact that the cornea is a less powerful convergent surface than the lens, the former contributes approximately two-thirds of the total refracting power to the eye (∼43/60 diopters) because the aqueous humor provides a weaker index of refraction than air.45 Thus, the magnitude of the ROP-induced changes to the structure of the lens could be as large as or larger than the changes to the cornea while having a lesser impact on refractive state. Our data suggest that this is the case.
Probably the most detailed and long-term work on the refractive state of the ROP eye has been performed in the cohort from the Early Treatment for Retinopathy of Prematurity (ETROP) study followed by, among others, studies by Quinn et al.24,26,27 Those subjects show a shift to myopia at early ages. Studies of other cohorts have found that the ROP eye is characterized by a peculiar delay in growth at early ages.16 Our model confirmed both of these observations. We do, however, recognize that a major limitation of our mathematical modeling procedure is that it assumes that the growth of the eye follows a sigmoidal function. This probably is a relatively safe assumption over the period of time modeled within our study, because it is not until approximately 10 years of age that significant incidence of school age myopia occurs; school age myopia is something quite distinct from myopia of prematurity. We imagine that a second developmental curve might be needed to describe certain parts of the development of the posterior of the globe as it develops school age myopia. Staphylomata are an additional important cause of myopic refractive state.46–49 Thus, while the asymptotes of our sigmoidal curve (the a parameter) predict an “ultimate” eye, it is unlikely that this prediction will be an accurate estimate of the average shape of the eye at the end of life.
We also noted that the variability in the ROP group was, in general, higher than in the Term group, which is not an unexpected result. A take-home message from this observation is that our models are more likely to describe the development of any given “normal” eye than they are to describe the development of any given eye with a history of ROP. That said, the representativeness of our Term sample must, itself, be treated as somewhat equivocal. That these children were receiving head MRIs at all suggests that they may not have been a perfectly normally developing population, and we have no way of knowing just how representative they really were. We are comforted by the good agreement with the existing literature. This ambiguity can be addressed more fully, in the future, by evaluating how well the Term, Preterm, and ROP curves predict the shapes of eyes in prospectively recruited subjects. An additional limitation of the study is that, while the cross-sectional resolution of our MRIs was reasonably good, very often the slice thickness was quite high (i.e., our scans were not isometric in three dimensions). Therefore, a prospective study using high resolution scans in all three dimensions is necessary to tell us if there is anything interesting, and distinct, happening in the coronal or sagittal planes that is not indicated by our transverse data.
Importantly, this study adds to the overwhelming body of knowledge that indicates that ROP is a disease of the whole eye, with persistent effects that last well after the clinical disease is resolved. It also is the first study, to our knowledge, to generate growth curves for the development of the normal eye, making this the first mathematically-based model of eye growth.
Animal studies in which extraocular lenses are applied to induce retinal hyperopia or myopia find that eye growth is respectively accelerated or retarded to minimize the defocus on the retina.50–52 Moreover, such directionally-appropriate changes in eye growth are observed even if the optic nerve or accommodation system is ablated, indicating that the retina is an important controller of ocular development.17,18 Apparently, retinal control of eye growth is an (almost) entirely local phenomenon (although there is evidence from chickens of a subtle role for feedback from the brain53).54–56 The abnormally avascular peripheral ROP retina may, therefore, underpin the abnormalities that our model detected in the ROP eye's growth.
The procedures described in this study were built on our earlier MRI analyses in a rat model of ROP.33 In many respects, the human data described herein closely parallel, at least as reasonably as is possible between two such strikingly anatomically different eyes (the rat eye consists mostly of lens), the data obtained during the course of that rat work. Thus, the “ROP rat” eye may represent a convenient model in which to study the peculiarities of ROP ocular development. More broadly, modeling the growth of normally and abnormally developing animal eyes can provide a basis for determining the molecular mechanisms that mediate eye growth and refractive development.
Supplementary Material
Acknowledgments
Supported by Fight for Sight (RJM), Boston Children's Hospital Ophthalmology Foundation (ABF, JDA), and The Massachusetts Lions Eye Research Fund (RMH). The authors alone are responsible for the content and writing of the paper.
Disclosure: R.J. Munro, None; A.B. Fulton, None; T.Y.P. Chui, None; A. Moskowitz, None; R. Ramamirtham, None; R.M. Hansen, None; S.P. Prabhu, None; J.D. Akula, None
References
- 1. Ishii K, Iwata H, Oshika T. . Quantitative evaluation of changes in eyeball shape in emmetropization and myopic changes based on elliptic Fourier descriptors. . 2011; 52: 8585– 8591. [DOI] [PubMed] [Google Scholar]
- 2. Flitcroft DI. . The complex interactions of retinal optical and environmental factors in myopia aetiology. . 2012; 31: 622– 660. [DOI] [PubMed] [Google Scholar]
- 3. Fledelius HC. . Pre-term delivery and the growth of the eye. An oculometric study of eye size around term-time. . 1992; 10– 15. [DOI] [PubMed]
- 4. Fledelius HC. . Pre-term delivery and subsequent ocular development. A 7–10 year follow-up of children screened 1982–84 for ROP. 4) Oculometric - and other metric considerations. . 1996; 74: 301– 305. [DOI] [PubMed] [Google Scholar]
- 5. Fielder AR, Quinn GE. . Myopia of prematurity: nature, nurture, or disease? . 1997; 81: 2– 3. [DOI] [PMC free article] [PubMed] [Google Scholar]
- 6. Fielder AR. . Retinopathy of prematurity. : Taylor D, Hoyt CS, . New York, NY: Elsevier Saunders; 1997: 537– 556. [Google Scholar]
- 7. O'Connor AR, Stephenson T, Johnson A,et al. Long-term ophthalmic outcome of low birth weight children with and without retinopathy of prematurity. . 2002; 109: 12– 18. [DOI] [PubMed] [Google Scholar]
- 8. O'Connor AR, Stephenson TJ, Johnson A, Tobin MJ, Ratib S, Fielder AR. . Change of refractive state and eye size in children of birth weight less than 1701 g. . 2006; 90: 456– 460. [DOI] [PMC free article] [PubMed] [Google Scholar]
- 9. Cook A, White S, Batterbury M, Clark D. . Ocular growth and refractive error development in premature infants without retinopathy of prematurity. . 2003; 44: 953– 960. [DOI] [PubMed] [Google Scholar]
- 10. Cook A, White S, Batterbury M, Clark D. . Ocular growth and refractive error development in premature infants with or without retinopathy of prematurity. . 2008; 49: 5199– 5207. [DOI] [PubMed] [Google Scholar]
- 11. Snir M, Friling R, Weinberger D, Sherf I, Axer-Siegel R. . Refraction and keratometry in 40 week old premature (corrected age) and term infants. . 2004; 88: 900– 904. [DOI] [PMC free article] [PubMed] [Google Scholar]
- 12. Baker PS, Tasman W. . Myopia in adults with retinopathy of prematurity. . 2008; 145: 1090– 1094. [DOI] [PubMed] [Google Scholar]
- 13. Mactier H, Maroo S, Bradnam M, Hamilton R. . Ocular biometry in preterm infants: implications for estimation of retinal illuminance. . 2008; 49: 453– 457. [DOI] [PubMed] [Google Scholar]
- 14. Morgan IG. . The biological basis of myopic refractive error. . 2003; 86: 276– 288. [DOI] [PubMed] [Google Scholar]
- 15. Larsson EK, Rydberg AC, Holmstrom GE. . A population-based study of the refractive outcome in 10-year-old preterm and full-term children. . 2003; 121: 1430– 1436. [DOI] [PubMed] [Google Scholar]
- 16. Fledelius HC, Fledelius C. . Eye size in threshold retinopathy of prematurity, based on a Danish preterm infant series: early axial eye growth, pre- and postnatal aspects. . 2012; 53: 4177– 4184. [DOI] [PubMed] [Google Scholar]
- 17. Troilo D. . Neonatal eye growth and emmetropisation—a literature review. . 1992; 6: 154– 160. [DOI] [PubMed] [Google Scholar]
- 18. Wallman J. . Retinal control of eye growth and refraction. . 1993; 12: 133– 153. [Google Scholar]
- 19. Smith EL III Kee CS, Ramamirtham R, Qiao-Grider Y, Hung LF. . Peripheral vision can influence eye growth and refractive development in infant monkeys. . 2005; 46: 3965– 3972. [DOI] [PMC free article] [PubMed] [Google Scholar]
- 20. Smith EL III Ramamirtham R, Qiao-Grider Y,et al. Effects of foveal ablation on emmetropization and form-deprivation myopia. . 2007; 48: 3914– 3922. [DOI] [PMC free article] [PubMed] [Google Scholar]
- 21. Mutti DO, Sinnott LT, Mitchell GL,et al. Relative peripheral refractive error and the risk of onset and progression of myopia in children. . 2011; 52: 199– 205. [DOI] [PMC free article] [PubMed] [Google Scholar]
- 22. Lepore D, Molle F, Pagliara MM,et al. Atlas of fluorescein angiographic findings in eyes undergoing laser for retinopathy of prematurity. . 2011; 118: 168– 175. [DOI] [PubMed] [Google Scholar]
- 23. Quinn GE, Dobson V, Repka MX,et al. Development of myopia in infants with birth weights less than 1251 grams. The Cryotherapy for Retinopathy of Prematurity Cooperative Group. . 1992; 99: 329– 340. [DOI] [PubMed] [Google Scholar]
- 24. Quinn GE, Dobson V, Kivlin J,et al. Prevalence of myopia between 3 months and 5 1/2 years in preterm infants with and without retinopathy of prematurity. Cryotherapy for Retinopathy of Prematurity Cooperative Group. . 1998; 105: 1292– 1300. [DOI] [PubMed] [Google Scholar]
- 25. Wang J, Ren X, Shen L, Yanni SE, Leffler JN, Birch EE. . Development of refractive error in individual children with regressed retinopathy of prematurity. . 2013; 54: 6018– 6024. [DOI] [PMC free article] [PubMed] [Google Scholar]
- 26. Quinn GE, Dobson V, Davitt BV,et al. Progression of myopia and high myopia in the early treatment for retinopathy of prematurity study: findings to 3 years of age. . 2008; 115: 1058– 1064. [DOI] [PubMed] [Google Scholar]
- 27. Quinn GE, Dobson V, Davitt BV,et al. Progression of myopia and high myopia in the Early Treatment for Retinopathy of Prematurity study: findings at 4 to 6 years of age. . 2013; 17: 124– 128. [DOI] [PMC free article] [PubMed] [Google Scholar]
- 28. Quinn GE, Dobson V, Siatkowski R,et al. Does cryotherapy affect refractive error? Results from treated versus control eyes in the cryotherapy for retinopathy of prematurity trial. . 2001; 108: 343– 347. [DOI] [PubMed] [Google Scholar]
- 29. Laws DE, Haslett R, Ashby D, O'Brien C, Clark D. . Axial length biometry in infants with retinopathy of prematurity. . 1994; 8: 427– 430. [DOI] [PubMed] [Google Scholar]
- 30. Chen TC, Tsai TH, Shih YF,et al. Long-term evaluation of refractive status and optical components in eyes of children born prematurely. . 2010; 51: 6140– 6148. [DOI] [PubMed] [Google Scholar]
- 31. Goktas A, Sener EC, Sanac AS. . An assessment of ocular morbidities of children born prematurely in early childhood. . 2012; 49: 236– 241. [DOI] [PubMed] [Google Scholar]
- 32. Kent D, Pennie F, Laws D, White S, Clark D. . The influence of retinopathy of prematurity on ocular growth. . 2000; 14: 23– 29. [DOI] [PubMed] [Google Scholar]
- 33. Chui TY, Bissig D, Berkowitz BA, Akula JD. . Refractive Development in the “ROP Rat.” . 2012; 2012: 956705. [DOI] [PMC free article] [PubMed] [Google Scholar]
- 34. Motulsky H, Christopoulos A. . Oxford: Oxford University Press; 2004: 351. [Google Scholar]
- 35. Hays WL. . Statistics. 5th ed. Fort Worth: Harcourt College Publishers; 1994: xviii 1112. [Google Scholar]
- 36. Mayer DL, Hansen RM, Moore BD, Kim S, Fulton AB. . Cycloplegic refractions in healthy children aged 1 through 48 months. . 2001; 119: 1625– 1628. [DOI] [PubMed] [Google Scholar]
- 37. Zadnik K, Manny RE, Yu JA,et al. Ocular component data in schoolchildren as a function of age and gender. . 2003; 80: 226– 236. [DOI] [PubMed] [Google Scholar]
- 38. Twelker JD, Mitchell GL, Messer DH,et al. Children's ocular components and age, gender, and ethnicity. . 2009; 86: 918– 935. [DOI] [PMC free article] [PubMed] [Google Scholar]
- 39. Gordon RA, Donzis PB. . Refractive development of the human eye. . 1985; 103: 785– 789. [DOI] [PubMed] [Google Scholar]
- 40. Bennett AG, Rabbetts RB, Bennett AG. . Bennett and Rabbetts' Clinical Visual Optics. 3rd ed. Oxford: Butterworth-Heinemann; 1998: viii 451. [Google Scholar]
- 41. Borja D, Manns F, Ho A,et al. Optical power of the isolated human crystalline lens. . 2008; 49: 2541– 2548. [DOI] [PMC free article] [PubMed] [Google Scholar]
- 42. Zadnik K, Mutti DO, Fusaro RE, Adams AJ. . Longitudinal evidence of crystalline lens thinning in children. . 1995; 36: 1581– 1587. [PubMed] [Google Scholar]
- 43. Paquette LB, Jackson HA, Tavare CJ, Miller DA, Panigrahy A. . In utero eye development documented by fetal MR imaging. . 2009; 30: 1787– 1791. [DOI] [PMC free article] [PubMed] [Google Scholar]
- 44. Hashemi H, Jafarzadehpur E, Ghaderi S,et al. Ocular components during the ages of ocular development. . 2015; 93: e74– e81. [DOI] [PubMed] [Google Scholar]
- 45. Freeman MH, Fincham WHA. . Optics. 10th ed. London: Butterworths; 1990: iv 536 p, 512 p. of plates. [Google Scholar]
- 46. Gilmartin B, Nagra M, Logan NS. . Shape of the posterior vitreous chamber in human emmetropia and myopia. . 2013; 54: 7240– 7251. [DOI] [PubMed] [Google Scholar]
- 47. Moriyama M, Ohno-Matsui K, Hayashi K,et al. Topographic analyses of shape of eyes with pathologic myopia by high-resolution three-dimensional magnetic resonance imaging. . 2011; 118: 1626– 1637. [DOI] [PubMed] [Google Scholar]
- 48. Moriyama M, Ohno-Matsui K, Modegi T,et al. Quantitative analyses of high-resolution 3D MR images of highly myopic eyes to determine their shapes. . 2012; 53: 4510– 4518. [DOI] [PubMed] [Google Scholar]
- 49. Ohno-Matsui K. . Proposed classification of posterior staphylomas based on analyses of eye shape by three-dimensional magnetic resonance imaging and wide-field fundus imaging. . 2014; 121: 1798– 1809. [DOI] [PubMed] [Google Scholar]
- 50. Smith EL III Hung LF, Kee CS, Qiao-Grider Y, Ramamirtham R. . Continuous ambient lighting and lens compensation in infant monkeys. . 2003; 80: 374– 382. [DOI] [PubMed] [Google Scholar]
- 51. Smith EL III Hung LF, Arumugam B. . Visual regulation of refractive development: insights from animal studies. . 2014; 28: 180– 188. [DOI] [PMC free article] [PubMed] [Google Scholar]
- 52. Wildsoet CF. . Active emmetropization—evidence for its existence and ramifications for clinical practice. . 1997; 17: 279– 290. [PubMed] [Google Scholar]
- 53. Wildsoet CF, Schmid KL. . Optical correction of form deprivation myopia inhibits refractive recovery in chick eyes with intact or sectioned optic nerves. . 2000; 40: 3273– 3282. [DOI] [PubMed] [Google Scholar]
- 54. Wallman J, Gottlieb MD, Rajaram V, Fugate-Wentzek LA. . Local retinal regions control local eye growth and myopia. . 1987; 237: 73– 77. [DOI] [PubMed] [Google Scholar]
- 55. Smith EL III Hung LF, Huang J, Blasdel TL, Humbird TL, Bockhorst KH. . Effects of optical defocus on refractive development in monkeys: evidence for local, regionally selective mechanisms. . 2010; 51: 3864– 3873. [DOI] [PMC free article] [PubMed] [Google Scholar]
- 56. Smith EL III Hung LF, Huang J, Arumugam B. . Effects of local myopic defocus on refractive development in monkeys. . 2013; 90: 1176– 1186. [DOI] [PMC free article] [PubMed] [Google Scholar]
Associated Data
This section collects any data citations, data availability statements, or supplementary materials included in this article.


