

Abstract
The spread of methicillin-resistant strains of Staphylococcus aureus (MRSA) in health-care settings has become increasingly difficult to control and has since been able to spread in the general community. The prevalence of MRSA within the general public has caused outbreaks in groups of people in close quarters such as military barracks, gyms, daycare centres and correctional facilities. Correctional facilities are of particular importance for spreading MRSA, as inmates are often in close proximity and have limited access to hygienic products and clean clothing. Although these conditions are ideal for spreading MRSA, a recent study has suggested that recurrent epidemics are caused by the influx of colonized or infected individuals into the correctional facility. In this paper, we further investigate the effects of community dynamics on the spread of MRSA within the correctional facility and determine whether recidivism has a significant effect on disease dynamics. Using a simplified hotspot model ignoring disease dynamics within the correctional facility, as well as two metapopulation models, we demonstrate that outbreaks in correctional facilities can be driven by community dynamics even when spread between inmates is restricted. We also show that disease dynamics within the correctional facility and their effect on the outlying community may be ignored due to the smaller size of the incarcerated population. This will allow construction of simpler models that consider the effects of many MRSA hotspots interacting with the general community. It is suspected that the cumulative effects of hotspots for MRSA would have a stronger feedback effect in other community settings.
Keywords: methicillin-resistant Staphylococcus aureus, hotspots, mathematical model, metapopulation model, Latin Hypercube Sampling
1. Introduction
Staphylococcus aureus is a gram-positive bacterium that causes skin and respiratory infections in humans. Strains may be non-pathogenic and live for years undetected by the host (Scanvic et al., 2001), while pathogenic strains of S. aureus are responsible for the majority of Staph infections in the general population. It is currently estimated that roughly 20% of the human population are long-term carriers of this family of bacterium (Cole et al, 2001, Kluytmans et al, 1997), demonstrating its strong ability to spread and colonize new hosts. In recent history, new strains of antibiotic resistant strains of S. aureus have wreaked havoc on health-care systems in many countries (Cooper et al., 2004). These strains are resistant to many front-line antibiotics and have posed a significant issue for the health-care system where the bacteria are spread rapidly. Strains that are resistant to many of our commonly prescribed antibiotics are referred to as Methicillin-resistant Staphylococcus Aureus (MRSA), while the remainder are referred to as Methicillin-susceptible Staphylococcus Aureus. The resistance of MRSA to antibiotics makes it very difficult to treat, and effective antibiotics are limited to more severe cases so as to not increase the number of resistant strains.
Symptoms take the form of small red bumps that resemble spider bites (Bick, 2007). Within a few days, these open into pus-filled boils. Related symptoms include fever and rash. S. aureus colonizes in the nostrils (Yan et al., 2013), but other sites for infection include the respiratory tract, open wounds, intravenous catheters and the urinary tract (Mahmood, Tahir, Jameel, Ziauddin, & Aslam, 2010). MRSA results in up to 12,000 deaths annually in the United States (Centers for Disease Control and Prevention, 2013).
MRSA is currently estimated to have colonized roughly 1% of the United States population (Gorwitz et al., 2008), and outbreaks have been documented in hospitals, correctional facilities, military barracks and within sports teams (Beam, Buckley, 2006, Bonatti, 2008). Individuals are also at risk of becoming colonized with MRSA when there is sharing of personal hygiene products or where personal hygiene is below standards to prevent the spread of Staph infections. The success of MRSA within health-care settings is in part attributed to the reduced immune response from ill patients, spreading from health-care workers and the ability of MRSA to survive on surfaces for several days (Coughenour, Stevens, & Stetzenbach, 2006).
The United States has the highest incarceration rate in the world, with approximately 1 in 31 adults (over 7.3 million people) in correctional facilities at any time (Okano & Blower, 2010). Newly incarcerated individuals are at risk for HIV, Hepatitis B and C, syphilis, gonorrhea, Clamydia and TB. Inmates are at increased risk for blood-borne pathogens, sexually transmitted diseases, influenza and shingles. After release, most inmates interact with the general public (Bick, 2007). The recidivism rate is also extremely high; many former prisoners re-offend and are re-imprisoned. This creates a large community transitioning between jails and the rest of society. It should be noted that jails are for offences with sentences less than a year, while prisons are for longer-term incarceration (Freudenberg, 2001).
Large correctional facilities such as the Los Angeles County Jail (LACJ) can house 20,000 inmates at any given time (Okano & Blower, 2010). Within the jail, prisoners are routinely transferred to different areas, to prevent gang formation (Fleisher & Decker, 2001). Thus there are a lot of people living in close quarters and also moving about. These are ideal conditions for MRSA to spread. MRSA is hyperendemic in most US correctional facilities. Risk factors include prolonged incarceration, skin lacerations and abrasions, previous antibiotic use, draining one’s own abscesses or performing one’s own wound dressing changes, washing clothing by hand, sharing razors, clothing, linen or soap and require co-payments to see a clinician (Bick, 2007).
MRSA has been responsible for several outbreaks within correctional facilities in recent years, with studies suggesting that these outbreaks are caused by the steady influx of individuals colonized by MRSA from the general public. Although Staph infections spread within the Los Angeles County Jail (LACJ), Kajita et al. showed that MRSA would not be able to sustain endemic status without the admission/release of individuals (Kajita, Okano, Bodine, Layne, & Blower, 2007). Due to the high re-offending rate in the United States, it was also suggested that the effects of recidivism of previously incarcerated individuals may lead to a sustained prevalence within correctional facilities.
In addition to Kajita et al. (2007), there have been a number of mathematical models for MRSA in a variety of settings. Early modelling of MRSA by Austin and Anderson (1999) used stochastic differential equations to examine the spread of MRSA between hospitals, while allowing for heterogeneity in hospital sizes. Chamchod and Ruan (2012) used both deterministic and stochastic models to examine MRSA in nursing homes. They showed that MRSA would likely persist without strict screening and decolonization at admission and that the introduction of a colonized individual into an MRSA-free nursing home had a much greater probability of leading to a major outbreak than the introduction of a contaminated healthcare worker. McBryde et al. (McBryde, Pettitt, & McElwain, 2007) modelled MRSA in an intensive care unit using four compartments: colonized and uncolonized patients and contaminated and uncontaminated healthcare workers. They showed that transmission of MRSA was sustained through admission of colonized patients, while increasing staff does not necessarily lead to reduced transmission of nosocomial pathogens. Cooper et al. (2004) considered both hospitals and the community, showing that the timing of interventions, level of resource provisions and chance combine to determine whether control efforts succeed or fail. Beggs et al. (Beggs, Shepherd, & Kerr, 2009) used a stochastic Monte Carlo model to look at the effects of hand hygiene on between-patient transmission. They showed that the benefits of hand hygiene were felt most intensely in the first tranche of compliance, with higher levels of hand hygiene yielding only marginal benefits. Collins et al. (2010) used a metapopulation model to determine the costs of antibiotic resistance due to MRSA. They showed that costs associated with toxin production and antibiotic resistance can explain why hospital and community-acquired MRSA strains are successful in different environments where transmission routes and host susceptibility vary.
This paper is organized as follows. In Section 2, we introduce and analyse our first mathematical model, a basic model for MRSA with hotspots. In Section 3, we extend the basic model to a metapopulation model with two patches, accounting for infection in both the community and in correctional facilities. In Section 4, we adapt the model to account for recidivism. We conclude with a discussion.
2. Model with hotspots
2.1. The model
We use the model of Kajita et al. (Kajita et al., 2007) as our starting point. In this model, individuals belong to one of three classes: susceptible, colonized (and infectious) or infected. The mechanics of MRSA lead to a highly connected model where individuals could move from any one compartment to another. A susceptible individual becomes colonized with MRSA after an effective contact with a colonized or infected individual at rates βC or βI, respectively. If recovery is added to this model, then infected individuals may recover from infection but move to the colonized compartment, where they remain colonized with MRSA. Due to the lack of a removed class, the model collapses down to an SIS model when the contact rates satisfy βC ≈ βI. We will consider the contact rates for colonized and infected individuals to be similar, which will lead to an SIS model. This will be important for the meta-population analysis where a system with m states and n patches has n × m differential equations.
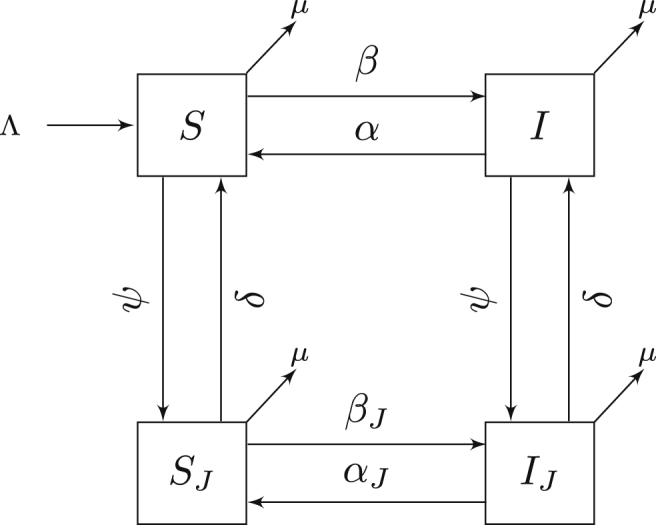
Hotspots are defined as regions that contain an area that may increase the incidence of disease. To study the basic dynamics of infection in hotspots, we next consider a model that disregards the dynamics within the correctional facility. A previous study demonstrated that the influx of colonized individuals from the community was sufficient to maintain an outbreak within the LACJ (Kajita et al., 2007). This suggests that community dynamics play an important role in the persistence of MRSA in prison and/or healthcare settings. However, these effects are in turn amplified by the presence of MRSA in these hotspots. We therefore suggest a simplified model shown in Figure 1 that allows individuals to interact with a potential hotspot (the correctional facility in this case). In contrast to the model presented in Kajita et al. (2007), we remove the colonized class and introduce two new classes (SJ and IJ) representing the incarcerated population. Although this model does not consider the dynamics in the facility, it will allow us to analyse the effects of visiting an area that either increases or decreases the likelihood of becoming colonized/infected.
Fig. 1.

Compartmental model of MRSA using an SIS model. Flow of the model is defined by system (1). All states and parameters are described in Table 1.
By excluding the disease dynamics within the correctional facility, we are able to analyse the model in a straightforward way. Although it is a large simplification to assume an area either increases incidence of infection or doesn’t, without considering the underlying dynamics, we will later show that this assumption is reasonable due to the small relative size of the incarcerated population.
The flow diagram for our hotspot model is shown in Figure 1. For this system, we make the following assumptions:
-
1.
Individuals in all compartments die at rate µ and reach age of majority at a constant rate Λ.
-
2.
Density-dependent transmission of infection occurs through contact with an infected individual at rate β (outside of the correctional facility). Transmission of disease is ignored within SJ and IJ.
-
3.
Infected individuals become susceptible at rate α in the general community through decolonization.
-
4.
Individuals are incarcerated at rate ψ and are released from custody at rate δ, a proportion pI of whom will be infected.
-
5.
Individuals in SJ remain susceptible after exiting the correctional facility with probability pS.
The model with hotspots is given by
| (1) |
Note that the denominator in the infection term reflects the fact that infected individuals in the community can only come into contact with individuals outside the correction facility.
2.2. Analysis
Proposition 2.0.1
Suppose pS = 1 and . Then the disease-free equilibrium
exists and is locally stable. If pS ≠ 1, then the disease-free equilibrium does not exist.
Proof
We first treat the case where individuals may become infected by entering the correctional facility (pS ≠ 1). In the absence of any infected individuals, we have
Therefore the disease-free equilibrium cannot exist so long as individuals continue to enter the correctional facility.
We next treat the case pS = 1, where MRSA can be contracted without contact from infected individuals. This limits the ability to use the next-generation method for determining R0; however, we can still obtain a threshold value from the associated linear system using the Jacobian matrix. At the disease-free equilibrium the Jacobian matrix is
with corresponding characteristic equation
The solutions to this equation are the solutions to the two following upward-facing parabolas:
A second-degree equation has two roots with negative real part if and only if all of its coefficients are strictly positive. Since the first equation has positive coefficients (note that ps ≤ 1), the corresponding eigenvalues have negative real part for all positive parameter values. The second equation provides the following criterion for local stability of the disease-free equilibrium:
This can be simplified noting that
which gives
as required. □
The endemic equilibrium X* is given by
where I* is the positive solution to the second-degree equation
| (2) |
Remark
All simulations in this paper will be taken with the incarcerated and community populations at equilibrium. This yields
At equilibrium, we have
This equilibrium will also hold for system (3). The above system can be solved explicitly, which provides global stability of this equilibrium.
2.3. Simulations
To better understand the effects of a hotspot on the spread of an epidemic, we consider three probabilities of an individual remaining susceptible, with all other parameter values shown in Table 1. These simulations represent a very simplified version of how hotspots influence disease dynamics when R0 from the previous section is above and below unity. We do not consider the effects of other parameters, as the SIS dynamics are well known. All values for simulations are listed in Table 1 and were chosen from literature when available or estimated to give values of R0 of 0.8–1.4. All numerical simulations and figures generated were completed in Matlab using the Runge–Kutta (4,5) method.
Table 1.
Legend for all states and parameters for all models with units included. Parameters used for simulations are indicated and are used in all simulations unless otherwise specified.
| Description | Units | Sim.(Low/High) | ||
|---|---|---|---|---|
| NT | Total number of individuals | People | 100,000 | |
| N | Number of individuals in the community (including SR where applicable) | People | ||
| NJ | Number of individuals incarcerated | People | ||
| S | Number of susceptible individuals (Comm.) | People | ||
| SR | Number of susceptible individuals (Recid.) | People | ||
| SJ | Number of susceptible individuals (Incar.) | People | ||
| I | Number of infected individuals (Comm.) | People | 1 | |
| IR | Number of infected individuals (Recid.) | People | 0 | |
| IJ | Number of infected individuals (Incar.) | People | 0 | |
| Λ | Rate of individuals reaching age of majority | People days−1 | N ⋅ µ | |
| µ | Death rate | Days−1 | ||
| β | Contact rate (Comm.) | People−1days−1 | 0.01/0.04 | |
| Contact rate (Comm./Comm.) | People−1days−1 | 0.01/0.04 | ||
| Contact rate (Comm./Recid.) | People−1days−1 | 0.01/0.04 | ||
| Contact rate (Recid./Recid.) | People−1days−1 | 0.01/0.04 | ||
| βJ | Contact rate (Incar.) | People−1days−1 | 0.01/0.04 | |
| ψ | Incarceration rate (Comm.) | Days−1 | ||
| ψR | Incarceration rate (Recid.) | Days−1 | ||
| 1/δ | Average incarceration time | Days | 45 | |
| 1/α | Average infectious period (Comm.) | Days | 45 | |
| 1/αJ | Average infectious period (Incar.) | Days | 45 | |
| pR | Probability of recidivism | 0.4 |
Figure 2a shows how increasing the probability of infection while disease is endemic in the community has a limited effect on the overall burden of disease. This is due to the smaller size of the population within the hotspot, which is unable to produce as many infections as the dominating non-linear terms in the much larger general population. However, the effect of an endemic disease in a correctional facility is more clear in Figure 2b, where it is not well spread in the general population, with a long-term visible disparity between the curves comprising approximately 35 individuals. Although these differences are small compared to the numbers in Figure 2a, they do suggest a way to maintain a reservoir of MRSA within the correctional facility if the reproductive ratio had been successfully decreased past unity for the general population. This indicates the need to maintain control efforts at low levels of disease in the general population through education and decolonization treatments when required (sparingly to reduce resistance), should the disease still be present in hotspots (correctional facilities, hospitals). The effects of the probability of infection (1 − pS) are proportional to the size of the incarcerated community, which is substantially smaller than the general public it serves.
Fig. 2.

Epidemic curves for varying values of pS (probability of remaining susceptible) for (a) high and (b) low values of β. All other parameter values for simulations are listed in Table 1.
3. A metapopulation model
We next consider a metapopulation model with two patches. The first represents community dynamics, while the second represents the dynamics within correctional facilities.
3.1. Flowchart, equations and model assumptions
The flow diagram is shown in Figure 3. For this system, we make the following additional assumptions:
-
1.
Density-dependent transmission of infection within the correctional facility occurs at rate βJ.
-
2.
Infected individuals become susceptible at rate αJ in the correctional facility through decolonization.
-
3.
There is no transmission between the correctional facility and other individuals.
Fig. 3.
Compartmental model for the two-patch SIS meta-population model. All states and parameters are listed in Table 1. Flow of the model is defined by system (3).
The metapopulation model is given by
| (3) |
3.2. Analysis
Proposition 3.0.2
The region is positively invariant for system (3).
Proof
This follows directly from the construction of the model. If any state is empty, there can be no removal of individuals from that state (all negative terms for each equation are proportional to the state itself). Therefore solutions cannot cross the boundary of Γ and hence remain positive for all time. Furthermore, by summing all equations of system (3), we get N′ = Λ − µN. The population is therefore bounded since we have and each component of N is nonnegative. □
Proposition 3.0.3
For system (3), the disease-free equilibrium
is unique.
Proof
The system at equilibrium can be re-written in matrix form as
Using a result from Li and Shuai (Li & Shuai, 2009), since all off-diagonal entries of D are nonpositive and the sum of the entries in each column of D is positive, D is a nonsingular M-matrix and . Therefore the system at equilibrium has the unique disease-free equilibrium stated above. □
Theorem 3.1
Suppose
where . Then the disease-free equilibrium, X0, is locally asymptotically stable if R0 < 1 and unstable if R0 > 1.
Proof
We will consider the next-generation method proposed by van den Dreissche and Watmough (van den Driessche & Watmough, 2002). The matrices F and V are as follows
Since system (3) satisfies the conditions of next-generation method, we define .
The eigenvalues of are the roots of the quadratic equation
(4) Thus
The spectral radius is defined as the maximum eigenvalue of the next-generation matrix. Since Equation (4) defines an upward-facing parabola with positive y-intercept and vertex to the left of the y-axis, the maximum eigenvalue must be the positive root. Therefore we have that
The conclusion follows from Theorem 2 from van den Dreissche and Watmough. □
Although we are not able to determine the stability of the endemic equilibria, we can state that if R0 > 1, then positive solutions persist. It is important to note that the presence of βJ in the reproduction number means the correctional facility can sustain an epidemic even when community transmission is low. The number of infected individuals will be substantially smaller in this case, due to the relative size of the incarcerated population. Should the incarcerated population become too large, the dynamics within the prison would become more significant and could possibly sustain an epidemic in the community. This suggests that community dynamics drive infection dynamics in correctional facilities and that MRSA (or any other similarly spread disease) could not be eradicated without reducing the spread within the community. However, as we have seen with the hotspots model, increasing the number of areas that increase incidence of disease (hospitals, clinics, gyms) has a cumulative effect on the community dynamics.
3.3. Sensitivity analysis
To determine which parameters have a significant effect on the value of R0, a set of N = 1000 sample parameter sets were chosen through the method of Latin Hypercube Sampling developed by Mckay (Mckay, Beckman, & Conover, 2000). In this method, a range is chosen for each parameter and is divided into N equiprobable compartments. This division creates a hypercube with Nk cells, where k is the number of parameters in the sample. A single parameter value is chosen randomly from each compartment under a uniform (in our case) distribution in such a way that, in each sample generated, there are no two parameters sampled from the same compartment. Once a parameter value has been chosen, its corresponding compartment cannot be reused in another sample. Once generated, each sample was used to calculate the respective value of R0. Partial rank correlation coefficients were then used to determine the sensitivity of R0 following the method of Blower and Dowlatabadi (Blower & Dowlatabadi, 1994). The results are shown in Fig. 4, Fig. 5.
Fig. 4.

PRCC sensitivity analysis with N = 1000 simulations for all parameters of system (3) using ranges from Table 2.
Fig. 5.

Dependence of R0 on the three most sensitive parameters (determined from the PRCCs) of system (3): (a) contact rate in the community, (b) recovery rate in the community, (c) contact rate in the correctional facility. Results were generated over N = 1000 simulations with parameter ranges shown in Table 2.
Model parameters and ranges were determined when available through the literature or were estimated to produce values of R0 in the range of 0.8–1.4. Studies place the decolonization (or recovery) rate for MRSA in a large range from one month to up to a year (Scanvic et al., 2001). This is problematic for an SIS model whose basic reproductive ratio in the single-patch model is most sensitive to the contact and decolonization rates. Furthermore, due to the removal of the carrier class from the original Kajita et al. model (Kajita et al., 2007), the spread cannot be limited by the rate at which individuals progress to infection. To remedy this, the average time of decolonization will be chosen in lower ranges to allow for more reasonably sized epidemics (noting that all final sizes of epidemics are not to scale).
The previous section illustrated how the effect of the presence of disease within a correctional facility (or any potential hotspot) is proportional to the relative size of that population. We will therefore consider a model that represents the incarcerated population of the United States, which currently has the highest incarceration rate of any country (Walmsley, 2013). Incarceration rates and average duration of incarceration were picked from US national data and other parameter values from similar models (Durose et al, 2014, Kajita et al, 2007).
Figure 4, using ranges from Table 2, shows that the most sensitive parameter for system (3) is the community contact rate, followed by the community recovery rate and the contact rate in the correctional facility. The first two parameters being the most sensitive was expected, as they are they are responsible for the direct number of secondary cases in the reduced one-patch SIS model. The sensitivity of βJ is likely due to its ability to maintain a (small) epidemic when the values of the aforementioned parameters are sufficiently low. This sensitivity is also enhanced in comparison to β since larger ranges were chosen for the contact within the correctional facility. Plots of the dependence of R0 on the three most significant parameters — the community and incarcerated contact rates (β and βJ), and the community recovery rate (α) — are illustrated in Figure 5.
Table 2.
Initial and Final values for PRCC/LHS using uniform distribution.
| Parameter | Initial | Final | Parameter | Initial | Final | ||||
|---|---|---|---|---|---|---|---|---|---|
| β | 0.005 | 0.04 | ψ | ||||||
| 0.005 | 0.04 | ψR | |||||||
| 0.005 | 0.04 | pR | 0 | 0.6 | |||||
| 0.005 | 0.04 | α | |||||||
| βJ | 0.005 | 0.06 | αJ | ||||||
| µ | δ |
3.4. Simulations
The dynamics of system (3) are illustrated in Figure 6 with parameters from Table 1. We have excluded the dynamics for the general population when the disease spreads well. The results in these situations are similar to those of the previous section; due to the small relative size of the incarcerated population, changes in the parameters for incarcerated individuals have little effect. Instead, we look at how changes in the spread of disease within the correctional facility affects the incarcerated population with low values for β in Figure 6a. With these parameters, it takes high values of βJ to sustain a small population of infected individuals in the correctional facility. This again demonstrates the need to maintain a vigilant eye on areas (not limited to correctional facilities) that may be providing a reservoir when the disease is controlled in the general population.
Fig. 6.

Simulations of system (3) with varying values of βJ: (a) the number of infected individuals in the correctional facility with low disease transmission in the community (low β), and (b) the number of infected individuals in the correctional facility with high disease transmission in the community (high β). In (c), we see the number of infected individuals in the community with low disease transmission (β). All other parameter values are listed in Table 1.
In Figure 6b, we vary the values for βJ with high levels of transmission in the community. There is an increase in incidence, with a deformation of the curve for higher levels of βJ. This is due to the faster spread within the correctional facility dominating the effects of community transmission, until this decreases and the curve continues to increase proportionally to the rising incidence in the community.
Figure 6c shows the community effects of varying the transmission rate within the correction facility when the community transmission is low.
4. Metapopulation model with recidivism
The previous model allowed us to analyse how community disease dynamics drive the outbreaks in prisons. However, it has been suggested that the effects of recidivism (reincarceration in correctional facilities due to reoffending) would need to be explored (Kajita et al., 2007). The definition of recidivism used in surveys is often broad, and Canadian rates can vary from 20% to 50% (Porporino, 1993). However, this skews the model proposed by Kajita et al. (2007), since individuals released from a correctional facility have a higher rate of incarceration than the general public (Durose et al., 2014). Furthermore, when nasal cultures were taken from inmates in a New York state prison, it was found they were at a 10-fold risk of being carriers of MRSA (Mukherjee et al., 2013). This higher concentration of colonization of inmates coupled with high rates of recidivism increases the number of infected individuals both within the community and within the jails. We have also taken the opportunity to determine whether heterogeneous contact between the recidivists and general population has a significant effect on the spread.
4.1. Flowchart, equations and model assumptions
The flow diagram is shown in Figure 7. For this system, we make the following additional assumptions:
-
1.
Density-dependent transmission of infection through contact with an infected individual occurs at rates , and (general community contact, contact between the general community and recidivists, and contact among recidivists).
-
2.
Recidivists are incarcerated at an increased rate ψR.
Fig. 7.
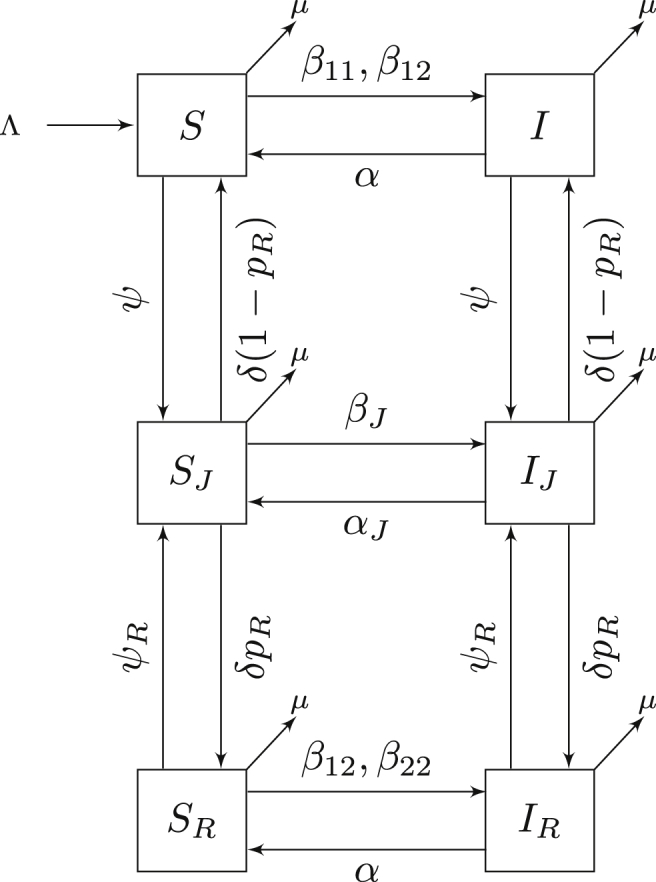
Compartmental model for MRSA transmission with susceptible and infectious classes for the general public, incarcerated and recidivist individuals. Flow of the model is defined by system (5).
The model with recidivism is given by
| (5) |
Remark
In the limiting case that ψ = ψR and , model (5) is equivalent to model (3).
4.2. Analysis
Proposition 4.0.1
The region is positively invariant for system (5).
Proof
This follows directly from the construction of the model. If any state is empty, there can be no removal of individuals from that state (for any state X = 0 we have X′ ≥ 0). Therefore solutions cannot cross the boundary of Γ and remain positive for all time. Furthermore, by summing all equations of system (5), we get . The population is therefore bounded since we have . □
Proposition 4.0.2
System (5) always has a unique disease-free equilibrium X* given by
where .
Proof
The system at equilibrium can be re-written in matrix form as
Again, using a result from Li and Shuai (2009), since all off-diagonal entries of D are non-positive and the sum of the entries in each column of D is positive, D is a non-singular M-matrix and . Therefore the system at equilibrium has the unique disease-free equilibrium stated above. □
Proposition 4.0.3
If R0 < 1, then the disease-free equilibrium X* is locally asymptotically stable; it is unstable if R0 > 1, where .
Proof
This follows directly from the next-generation method. □
Remarks
- 1.
An explicit expression for R0 can be found by defining R0 as the maximum x-intercept of the associated characteristic equation of since it is a cubic function and can be expressed using radicals. Whether or not this is possible, this equation would be too large to analyse directly due to the highly connected nature of the system. For models with more than five disease classes, no explicit formula can be derived for R0 using radicals, a consequence of the Abel–Ruffini Theorem. However, the results of van den Dreissche and Watmough (van den Driessche & Watmough, 2002) still hold for models with a finite number of infectious classes and therefore sensitivity analyses on R0 can still be used to determine which parameters are most significant. For system (5), we are interested in the effects of recidivism and heterogeneous contacts on the reproductive ratio of MRSA. The effects of all other parameters on this system have been left out due to the similarity with system (3). We also note that the simulations for this model will be taken with the incarcerated, recidivist and community populations at equilibrium. This yields
- 2.
Note that the next-generation method did not apply to the hotspots model, since that model did not satisfy condition [A4] of the theorem in van den Driessche and Watmough (van den Driessche & Watmough, 2002); namely, that if the population is free of disease it will remain free of disease. In the hotspots model, if there is no disease present, individuals can still become infected by entering the jail (the hotspot).
At equilibrium, we have
Local stability can be verified using the Jacobian matrix of this system and the Routh–Hurwitz criterion (results not shown). Since initial conditions for the simulations are taken at equilibrium, the populations will remain at equilibrium for all time.
4.3. Sensitivity analysis
Having shown that a small incarcerated population has a relatively small effect on the basic reproductive ratio of the two-patch model, high estimates for the incarceration rate (ψ) are chosen. It is important to note that the total incarceration rate of the model is increased past the values of ψ due to the increase of incarcerations at rate ψR. Incarceration and recidivism rates are taken from the US data on correctional facilities (Durose et al, 2014, Walmsley, 2013). Statistics on recidivism are often clouded by the various ways they can be categorized. A recidivist could be defined as someone who has committed a new offense, has violated parole conditions or has returned to the prison to serve the remainder of their sentence following temporary release. Furthermore, recidivism rates vary by age group or by what crime had been committed (Porporino, 1993). This variety of ways to define recidivism leads to difficulty in determining an overall rate for the general population. Recidivism rates are not well-documented for provincial offenders in Canada; however, the percentage of offenders who return to federal facilities is publicly available. These data are limited as they measure return to a correctional facility under parole or supervision and exclude new crimes. To circumvent this issue, we will use recidivism data from the National Institute of Justice in the United States and define recidivism to be the proportion of released inmates who are re-arrested by the end of the first year.
Figure 8 shows that the most sensitive parameters of the system are the community contact rate () followed by the community recovery rate (α) and the prison contact rate (βJ). These results reproduce the same effects that were observed in system (3). We note that the probability of recidivism and heterogeneous contacts are not sensitive parameters. This is due to the limited effect of these parameters as they act on small populations. Plots of the dependence of R0 on the community and incarcerated contact rates (β and βJ) and the community recovery rate (α) are illustrated in Figure 9.
Fig. 8.

PRCC sensitivity analysis with N = 1000 simulations for all parameters of system (5) using ranges from Table 2.
Fig. 9.

Dependence of R0 on the most sensitive parameters (determined from the PRCCs) of system (5): (a) contact rate in the community, (b) contact rate in the correctional facility, (c) recovery rate in the community. Results generated over N = 1000 simulations with parameter ranges shown in Table 2.
4.4. Numerical simulations
Although the disease as a whole is not sensitive to the recidivism-specific parameters, they do affect the spread of disease within the correctional facilities. We consider three simulations, as the remainder are highly similar to the previous model, and we will only consider the effects of the incarcerated population. The probability of recidivism and both incarceration rates are varied. Results are illustrated in Figure 10. Decreasing the incarceration rates or probability of recidivism decreases the incidence of disease in prison; however, the effects of decreasing incarceration of recidivist individuals are naturally dampened at low levels of pR (few recidivists). An important consequence of these results is that the burden of MRSA in prisons is reduced when the incarceration rates are lowered since the prison size also decreases, reducing transmission.
Fig. 10.

Simulations of system (5) of the number of infected incarcerated individuals with varying levels of (a) the probability of recidivism (pR), (b) the general incarceration rate (ψ) and (c) the recidivist incarceration rate (ψR). All other parameter values are listed in Table 1.
5. Discussion
The models we have explored demonstrated that the dynamics within the correctional facility may be ignored when considering disease dynamics in the general public. This is due to the small size of the incarcerated population relative to the whole population. However, Figure 6 shows that community transmission rates can lead to much higher incidence within the correctional facility. This corroborates what was found in the case of the Los Angeles County Jail (Kajita et al., 2007), where it was found that the endemic status of MRSA was due to the influx of infected individuals into the system. We verified this using simulations of system (5), but the results were omitted due to high similarity with system (3).
We also note that, when studying the effects of dynamics of the correctional facility on the general community, the size of the incarcerated population in any country is too small to create a significant effect on the transmission in the community for the ranges of ψ and δ taken from the literature. This result shows that, with sufficient transmission within the prison, a small population of infected individuals is present within the general community. Although these transmission rates are much higher than would be expected to occur in a correctional facility, it is important to consider when attempting to eradicate the disease within the general community. In other words, if we have a single remaining hotspot for MRSA while the disease is being controlled in the general population, subsequent epidemics would be observed should control strategies be lessened due to perceived absence of the disease.
Increasing the probability of recidivism and the rates of incarceration of recidivists increased the number of infected individuals within the correctional facility. This effect becomes more important if we consider the potentially long infectious period of MRSA-colonized individuals during a community outbreak. We can also extend these results to similar infections with long infectious periods such as gonorrhoea (similar to MRSA with modified contact structure). Reducing rates of recidivism would be beneficial in maintaining smaller incarcerated populations and reducing the number of secondary infections caused by an infection acquired within the facility. However, it is unlikely to have as much of an effect while the disease is endemic in the community. It is therefore important to maintain control measures to reduce disease transmission in any correctional facilities, as outbreaks would otherwise be more frequent due to community-led dynamics. We also examined whether or not a heterogeneous contact rate had any substantial effect on the transmission of the disease. When the two groups outside of the correctional facility had limited contact, recidivist individuals were protected from infection, again corroborating the driving dynamics of larger populations.
Although we have shown that transmission of MRSA could be maintained by correctional facilities with low transmission in the community, it can only maintain a small population infected with high transmission in the facility. Instead, we can extend these results to the transmission of MRSA hotspots as a whole. For example, hospitals have a population more than 13 times larger than the incarcerated population in the US, where MRSA is often a secondary complication of hospitalization. Furthermore, including other health-care facilities such as clinics and doctors’ offices, and also including hotspots such as gyms and daycare centres together, the effects of hotspots for disease transmission become much greater in the general community. In these situations, the cumulative effect on the general population may have a stronger influence. Reducing the prevalence of MRSA would need to be a concerted and maintained effort between all potential hotspots.
Acknowledgements
We thank Lindi Wahl for technical discussions. RS? is supported by an NSERC Discovery Grant. For citation purposes, please note that the question mark in “Smith?” is part of the author’s name.
Footnotes
Peer review under responsibility of KeAi Communications Co., Ltd
References
- Austin D.J., Anderson R.M. Studies of antibiotic resistance within the patient, hospitals and the community using simple mathematical models. Philosophical Transactions of the Royal Society of London. Series B, Biological Sciences. 1999;354(1384):721–738. doi: 10.1098/rstb.1999.0425. [DOI] [PMC free article] [PubMed] [Google Scholar]
- Beam J.W., Buckley B. Community-acquired Methicillin-Resistant Staphylococcus aureus: Prevalence and risk factors. Journal of Athletic Training. 2006;41(3):337–340. [PMC free article] [PubMed] [Google Scholar]
- Beggs C.B., Shepherd S.J., Kerr K.G. How does healthcare worker hand hygiene behaviour impact upon the transmission of MRSA between patients?: An analysis using a Monte Carlo model. BMC Infectious Diseases. 2009;9(1):1. doi: 10.1186/1471-2334-9-64. [DOI] [PMC free article] [PubMed] [Google Scholar]
- Bick J.A. Infection control in jails and prisons. Healthcare Epidemiology. 2007;45:1047–1055. doi: 10.1086/521910. [DOI] [PubMed] [Google Scholar]
- Blower S.M., Dowlatabadi H. Sensitivity and uncertainty analysis of complex models of disease transmission: And HIV model, as an example. International Statistical Review = Revue Internationale de Statistique. 1994;62(2):229–243. [Google Scholar]
- Bonatti H. Epidemiology and outcomes of community-associated Methicillin-Resistant Staphylococcus Aureus infection. Year Book of Surgery. 2008;2008:148–150. [Google Scholar]
- Centers for Disease Control and Prevention Antibiotic resistance threats in the United States, 2013. 2013. http://www.cdc.gov/drugresistance/threat-report-2013/
- Chamchod F., Ruan S. Modeling the spread of methicillin-resistant Staphylococcus aureus in nursing homes for elderly. PLoS ONE. 2012;7(2):e29757. doi: 10.1371/journal.pone.0029757. [DOI] [PMC free article] [PubMed] [Google Scholar]
- Cole A.M., Tahk S., Oren A., Yoshioka D., Kim Y.H., Park A. Determinants of Staphylococcus aureus nasal carriage. Clinical and Diagnostic Laboratory Immunology. 2001;8(6):1064–1069. doi: 10.1128/CDLI.8.6.1064-1069.2001. [DOI] [PMC free article] [PubMed] [Google Scholar]
- Collins J., Rudkin J., Recker M., Pozzi C., O’Gara J.P., Massey R.C. Offsetting virulence and antibiotic resistance costs by MRSA. The ISME Journal. 2010;4(4):577–584. doi: 10.1038/ismej.2009.151. [DOI] [PubMed] [Google Scholar]
- Cooper B.S., Medley G.F., Stone S.P., Kibbler C.C., Cookson B.D., Roberts J.A. Methicillin-resistant Staphylococcus aureus in hospitals and the community: Stealth dynamics and control catastrophes. Proceedings of the National Academy of Sciences of the United States of America. 2004;101(27):10223–10228. doi: 10.1073/pnas.0401324101. [DOI] [PMC free article] [PubMed] [Google Scholar]
- Coughenour C., Stevens V., Stetzenbach L.D. An evaluation of methicillin-resistant Staphylococcus aureus survival on five environmental surfaces. Microbial Drug Resistance (Larchmont, N.Y.) 2006;17(3):457–461. doi: 10.1089/mdr.2011.0007. [DOI] [PubMed] [Google Scholar]
- Durose M.R., Cooper A.D., Snyder H.N. Recidivism of prisoners released in 30 states in 2005: Patterns from 2005 to 2010. Bureau of Justice Statistics Special Report. 2014 [Google Scholar]
- Fleisher M.S., Decker S.H. An overview of the challenge of prison gangs. Corrections Management Quarterly. 2001;5:1–9. [Google Scholar]
- Freudenberg N. Jails, prisons, and the health of urban populations: A review of the impact of the correctional system on community health. Journal of Urban Health : Bulletin of the New York Academy of Medicine. 2001;78(2):214–235. doi: 10.1093/jurban/78.2.214. [DOI] [PMC free article] [PubMed] [Google Scholar]
- Gorwitz R.J., Kruszon-Moran D., McAllister S.K., McQuillan G., McDougal L.K., Fosheim G.E. Changes in the prevalence of nasal colonization with Staphylococcus Aureus in the United States. The Journal of Infectious Diseases. 2008;197:1226–1234. doi: 10.1086/533494. [DOI] [PubMed] [Google Scholar]
- Kajita E., Okano J.T., Bodine E.N., Layne S.P., Blower S. Modelling an outbreak of an emerging pathogen. Nature Reviews. Microbiology. 2007;5(9):700–709. doi: 10.1038/nrmicro1660. [DOI] [PubMed] [Google Scholar]
- Kluytmans J., van Belkum A., Verbrugh H. Nasal carriage of Staphylococcus aureus: epidemiology, underlying mechanisms, and associated risks. Clinical Microbiology. 1997;10(3):505–520. doi: 10.1128/cmr.10.3.505. [DOI] [PMC free article] [PubMed] [Google Scholar]
- Li M.Y., Shuai Z. Global stability of an epidemic model in a patchy environment. Canadian Applied Mathematics Quarterly. 2009;17(1):175–187. [Google Scholar]
- Mahmood K., Tahir M., Jameel T., Ziauddin A., Aslam H.F. Incidence of Methicillin-resistant Staphylococcus aureus (MRSA) causing nosocomial infection in a Tertiary Care Hospital. Annals of King Edward Medical University. 2010;16(2) [Google Scholar]
- McBryde E.S., Pettitt A.N., McElwain D.L.S. A stochastic mathematical model of methicillin resistant Staphylococcus aureus transmission in an intensive care unit: Predicting the impact of interventions. Journal of Theoretical Biology. 2007;245(3):470–481. doi: 10.1016/j.jtbi.2006.11.008. [DOI] [PubMed] [Google Scholar]
- Mckay M.D., Beckman R.J., Conover W.J. A comparison of three methods for selecting values of input variables in the analysis of output from a computer code. Technometrics : A Journal of Statistics for the Physical, Chemical, and Engineering Sciences. 2000;42(1):55. [Google Scholar]
- Mukherjee D.V., Herzig C.T., Jeon C.Y., Lee C.J., Apa Z.L., Genovese M. Prevalence and risk factors for Staphylococcus aureus colonization in individuals entering maximum-security prisons. Epidemiology and Infection. 2013;142(3):484–493. doi: 10.1017/S0950268813001544. [DOI] [PMC free article] [PubMed] [Google Scholar]
- Okano J.T., Blower S. Are correctional facilities amplifying the epidemic of community-acquired methicillin-resistant Staphylococcus aureus? Nature Reviews. Microbiology. 2010;8:82–83. doi: 10.1038/nrmicro2200-c1. [DOI] [PubMed] [Google Scholar]
- Porporino F.J. Forum on corrections research. Correctional Service of Canada. 1993;5(3) [Google Scholar]
- Scanvic A., Denic L., Gaillon S., Giry P., Andremont S., Lucet J.C. Duration of colonization by methicillin-resistant Staphylococcus aureus after hospital discharge and risk factors for prolonged carriage. Clinical Infectious Diseases : an Official Publication of the Infectious Diseases Society of America. 2001;21(10):1393–1398. doi: 10.1086/320151. [DOI] [PubMed] [Google Scholar]
- van den Driessche P., Watmough J. Reproduction numbers and sub-threshold endemic equilibria for compartmental models of disease transmission. Mathematical Biosciences. 2002;190(1–2):29–48. doi: 10.1016/s0025-5564(02)00108-6. [DOI] [PubMed] [Google Scholar]
- Walmsley R. World prison population list. International Centre for Prison Studies. 2013;10 [Google Scholar]
- Yan M., Pamp S.J., Fukuyama J., Hwang P.H., Cho D.Y., Holmes S. Nasal microenvironments and interspecific interactions influence nasal microbiota complexity and S. aureus carriage. Cell Host & Microbe. 2013;14(6):631–640. doi: 10.1016/j.chom.2013.11.005. [DOI] [PMC free article] [PubMed] [Google Scholar]