Fig. 1.

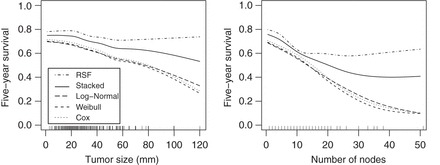
The association of tumor size (mm) and the number of nodes with 5-year survival for the GBCS data set with the other covariates to their median value. The tick marks at the bottom of the plots indicate the skewness of both covariates.

The association of tumor size (mm) and the number of nodes with 5-year survival for the GBCS data set with the other covariates to their median value. The tick marks at the bottom of the plots indicate the skewness of both covariates.