

Abstract
The cell line OVCAR-4 was recently ranked as one of the most representative cell lines for high grade serous ovarian cancer (HGSOC). However, little work has been done to assess the susceptibility of OVCAR-4 cells and tumors to the more common types of molecular targeting. Proteome profiles suggest OVCAR-4 express high levels of integrin αvβ3 receptors. Using flow cytometry with fluorescent antibodies we determined that OVCAR-4 cells have high number of integrin αvβ3 receptors ([9.8 ± 2.5] × 104/cell) compared to the well-characterized cell line U87-MG ([5.2 ± 1.4] × 104/cell). However, OVCAR-4 cells also have roughly three times the surface area of U87-MG cells, so the average αvβ3 receptor density is actually lower (11 ± 3 versus 18 ± 6 receptors/μm2). A series of new fluorescent molecular probes was prepared with structures comprised of a deep-red squaraine fluorophore (~680 nm emission) covalently attached to zero, one, or two cyclic pentapeptide cRGD sequences for integrin targeting. Microscopy studies showed that uptake of the divalent probe into cultured OVCAR-4 cells was 2.2 ± 0.4 higher than the monovalent probe, which in turn was 2.2 ± 0.4 higher than the untargeted probe. This probe targeting trend was also seen in OVCAR-4 mouse tumor models. The results suggest that clinically relevant OVCAR-4 cells can be targeted using molecular probes based on αvβ3 integrin receptor antagonists such as the cRGD peptide. Furthermore, deep-red fluorescent cRGD-squaraine probes have potential as targeted stains of cancerous tissue associated with HGSOC in surgery and pathology settings.
Keywords: Cancer, Integrin, OVCAR-4, Cyclic peptide, Squaraine dye
Graphical abstract
1 Introduction
Ovarian cancer is the 5th leading cause of cancer related deaths among women in the United States, and is the most lethal gynecological disease.1 While many cancers have seen improvements in survival rates in recent years due to early detection and improved therapies, ovarian cancer survival rates have stayed mostly static.2 Detection of ovarian cancer usually occurs at stages II-IV after metastasis, and primary treatment for ovarian cancer remains surgical debulking followed by chemotherapy.3 Since the amount of residual tumor after resection correlates with decreased survival,4,5 there is a pressing need for improved imaging strategies to facilitate early detection or identify the cancerous tissue for removal. Research progress is hindered by the lack of clinically relevant model systems6,7 that reproduce the molecular and mutational characteristics of ovarian cancer.2,8 For example, high-grade serous ovarian cancer (HGSOC) is responsible for approximately 80% of ovarian cancer cases and two-thirds of ovarian cancer deaths. This makes it the most common and deadly ovarian cancer sub-type and a very high priority for rigorous study. However, a recent comparison between the molecular profiles of 47 cell lines to the molecular and genetic changes present in 489 clinically relevant HGSOC tumors found that the most cited cell lines (e.g. SKOV3 and A2780) are not those most likely to represent HGSOC.8,9 To combat this problem, several recent publications have sorted an expanded panel of ovarian cancer cell lines based on features characteristic of their clinical relevance, including genomic sequences, behaviour in 2-dimensional-cell culture, and their in vitro response to chemotherapeutic drugs.8,10,11 Follow-up work is needed to characterize the biological response of the most clinically relevant cell lines to known cancer targeting ligands. This present study focuses on OVCAR-4, a cell-line collected from a 42 year-old ovarian cancer patient and found to be resistant to combination chemotherapy.12 OVCAR-4 was ranked as one of the highest matches to HGSOC (0.46 correlation with copy-number alterations of HGSOC)8 and yet has a sparse 56 PubMed citations over the last three decades. Most of these reports employed OVCAR-4 for in vitro studies of cell toxicity caused by potential chemotherapeutics. A recent in vivo study demonstrated the ability of this cell line to reliably form xenograft tumors in nude mice, suggesting that it as a promising experimental model for the ovarian cancer community.13 However, the susceptibility of OVCAR-4 cells to the more common types of molecular targeting is not known.14
A mass spectrometry based analysis of the global proteome of the NC-60 cell line indicates that OVCAR-4 cells overexpress integrin receptors.15 More specifically, the αvβ3 integrin subunits αv and β3 are approximately 60% higher in OVCAR-4 cells than in A498 cells which are considered to be integrin positive.16,17 Integrins are transmembrane proteins which regulate cell adhesion and interactions with the extracellular matrix, processes vital to cell proliferation. The αvβ3 Integrin is overexpressed on many cancer cells and also the surfaces of growing tumor blood vessels. The high expression of integrin receptors on OVCAR-4 cells is consistent with studies that observed cell binding to the substrates, laminin and fibronectin, that bear the arginine-glycine-aspartate (RGD) motif that is well-known to be recognized by the αvβ3 integrin receptor.15,18 But no study has directly investigated the propensity of OVCAR-4 cells for targeting by RGD-based molecular probes.
The aim of this study was to determine the number and density of αvβ3 receptors on the surface of OVCAR-4 cells, and then measure cell uptake of two targeted, deep-red fluorescent probes: a monovalent probe with one RGD targeting unit and a divalent probe with two RGD targeting units. We elucidated the cell entry mechanism and also confirmed selective targeting of subcutaneous OVCAR-4 tumors in a nude mouse model. Technically, the microscopy and in vivo imaging studies were greatly helped by the deep-red fluorescence emitted by the probes which provided optimal tissue penetration. The results suggest a path towards potential clinical translation using fluorescent RGD-probes to stain the cancerous tissue associated with HGSOC in surgery and pathology settings.19–24
2. Materials and Methods
2.1. Fluorescent Probes
Synthesis of the fluorescent molecular probes Sq, SqRDG1, and SqRGD2, and a summary of their photophysical properties are provided as Supplementary Information. Cy3RGD1 was purchased from Molecular Targeting Technologies Incorporated (catalog number RG-1002). The following dye labeled antibodies were purchased from ThermoFischer, Anti-Human CD51/CD61 (Integrin alpha/beta 3) FITC (catalog number 11-0519-42), Mouse IgG1 kappa Isotype Control FITC (catalog number 11-4714-42). Nystatin was obtained from Alfa Aesar and amiloride was obtained from Sigma Aldrich. TRITC-Dextran (70 kDa) was obtained from Molecular Probes.
2.2. Cell Culture
OVCAR-4 (CVCL_1627) human ovarian adenocarcinoma cells were obtained from the National Cancer Institute (NCI) Division of Cancer Treatment and Diagnosis (DCTD) Tumor Repository and were cultured in RPMI media supplemented with 0.1 mM NEAA and 1.5 g/L NaHCO3. U-87 MG (CVCL_0022) human glioblastoma cells and MCF-7 (CVCL_0031) human mammary adenocarcinoma were cultured in EMEM media supplemented with 0.1 mM NEAA, 1.5 g/L NaHCO3, and 1 mM sodium pyruvate. A549 (CVCL_0023) human alveolar adenocarcinoma were cultured in F-12K media supplemented with 0.1 mM NEAA. All media additionally contained 10% (w/w) FBS and 1% streptomycin-penicillin. Culture was done at 37 °C, 5% CO2 over air.
2.3. Flow Cytometry
The OVCAR-4, U-87 MG, MCF-7, and A549 cells (3 × 10⁵) were dissociated from a confluent plate with a non-enzymatic cell dissociation solution (Gibco). The cells were concentrated to 1.5×10⁶ cells/mL and incubated for 30 minutes at 4 oC with either 3 μg/mL of FITC-conjugated anti-αvβ3 antibody or 7.5 μg/mL of FITC conjugated IgG1 kappa isotype control. The cells were then washed twice with flow cytometry buffer and fixed with IC fixation buffer. Data was collected using a flow cytometer equipped with a BD LSRFortessa X-20 analyzer. The samples were excited with a blue laser (488 nm), and data was collected with a FITC 530/30 nm filter (max: 10,000 events). The geometric mean fluorescence of each sample was calculated using FlowJo software by subtracting the isotype control fluorescence from the sample fluorescence, and the value compared to a calibration plot created from a Quantum™ FITC-5 MESF kit to identify the number of FITC fluorophores per cell. Division by the number of FITC fluorophores per antibody (αvβ3: 4.6 ± 0.5) identified the number of antibodies on each cell, and thus the number of integrin receptors per cell, assuming only one antibody per receptor. All experiments were reproduced independently.
2.4. Microscopy
2.4.1. Sample preparation
Cells were seeded onto an 8-well chambered coverglass (Lab-Tek, Nunc) and grown to 80% confluence (48 hours). The medium was removed and the cells were washed with PBS, then separate samples were incubated with 100 nM of Sq, SqRGD1, or SqRGD2 in warm growth medium at 37 °C for a designated amount of time. Competitive probe uptake experiments employed mixtures of Cy3RGD1 (100 nM) with either Sq, SqRGD1, or SqRGD2 (100 nM). After incubating the cells with fluorescent probe(s), each cell sample was treated with 100 μL of ice cold 4% paraformaldehyde for 5 minutes. The media was removed, and the cells fixed with 4% paraformaldehyde for 20 minutes at room temperature, co-stained with Hoechst dye (3 μM) for 30 minutes, and finally washed twice with PBS and imaged under PBS.
2.4.2. Probe Uptake Inhibition Studies
OVCAR-4 cells were prepared and fixed as described above with the following modifications. Blocking with free cRGD: cells were incubated with a mixture of free cRGD (1 μM) and fluorescent probe (100 nM). Low temperature inhibition of active transport: cells were chilled at 4 °C for 15 minutes followed by incubation with probes at 4°C. Depletion of intracellular ATP: cells were treated with sodium azide (0.1%) and deoxyglucose (50 mM) in growth media for 1 hour then washed with PBS before incubation with probe. Inhibition of clathrin mediated endocytosis: cells were treated with 400 mM sucrose for 1 hour then washed with PBS before incubation with probe. Inhibition of caveolae mediated endocytosis: cells were treated with 25 μg/mL nystatin for 30 minutes then washed with PBS before incubation with probe. Inhibition of micropinocytosis: cells were treated with 3 mM amiloride for 30 minutes then washed with PBS before incubation with probe. Dextran colocalization: cells were incubated simultaneously with 1.0 mg/mL TRITC-Dextran (70 kDa) and one of the probes.
2.4.3. Imaging of Probe Internalization
The treated and fixed cells were imaged using a GE Healthcare DeltaVision Deconvolution fluorescence microscope equipped with an X-cite 120 fluorescence illumination system. Epifluorescence images were collected in softWoRx using a Photometrics Cascade II:512 EMCCD camera operating in CCD mode with the following filter sets Cy5 (Ex: 640/20, Em: 685/40), Cy3 (Ex: 490/20, Em: 528/38), Hoechst (Ex: 360/40, Em: 457/50), 2 second acquisition times and 1 MHz readout speed. Images were deconvolved in softWoRx, and a 50 point rolling background was subtracted in ImageJ. The mean fluorescence intensity for a cell population was calculated from the average of 25 randomly generated 25×25 pixel extra-nuclear regions of interest. Averages and SEM were calculated and plotted in GraphPad Prism.
2.4.4. Cell Surface Area Measurements
Cells were seeded onto an 8-well chambered coverglass (Lab-Tek, Nunc, USA) and allowed to attach and spread (12 hours) before fixation (4% paraformaldehyde, 20 minutes). The fixed cells were stained with 200 μL of 0.10 mg/mL DiI for 48 hours at 3 °C, co-stained with 3 μM Hoechst for 10 minutes, and finally washed 10 times with PBS and imaged under PBS. Fluorescence microscopy was conducted on a Nikon A1-R Confocal system with a 100× objective at 0.20 μM lateral and axial resolution. Sufficient Z-slices (~80 per cell) were collected to ensure complete sampling above and below the cells. Images were collected in Nikon Elements and processed in ImageJ by: (1) manual thresholding to remove extracellular artifacts, (2) applying a 1×1×1 3D Gaussian filter to reduce erroneous noise inflation of surface area, (3) construction of a 3D surface model with the 3D viewer plugin, (4) exporting of the surface model as a STL (ASCII) file. Netfabb was then used to measure the surface area from the STL file. Means and SEM were plotted in GraphPad Prism.
2.5. In Vivo Imaging
Following a protocol approved by the institutional animal care committee, twelve female Foxn1 nude mice (Charles River Laboratories) were inoculated with OVCAR-4 tumors (106 cells, 100 μL) in 1:1 Matrigel (Corning):media, on the right rear flank. Once tumors reached approximately 500 mm3 (~6 weeks) three separate cohorts received intravenous injection of either Sq, SqRGD1, or SgRGD2 (10 nmol/mouse, 100 μL, n=3). At 3 hours, the mice were anesthetized and sacrificed via cervical dislocation. The liver, heart, lungs, spleen, kidney, muscle, blood, skin, and the tumor were removed and imaged using an In Vivo Imaging Station with a Cy5.5 filter set and a 3 second acquisition time. Probe biodistribution in each mouse was determined by processing the organ fluorescence images in ImageJ: (1) a 300 point rolling background was subtracted, (2) a threshold was used to create a Region of Interest (ROI) around each organ, (3) the Mean Pixel Intensity (MPI) of the ROI was measured, (4) the MPI of each organ was normalized against the MPI of the muscle, (5) the normalized MPI results from the mice in a cohort were averaged and plotted with the SEM in GraphPad Prism. The analysis assumes that the MPI values are proportional to the molar amount of fluorescent probe in the tissue.
3. Results
3.1. Fluorescent Probe Design and Synthesis
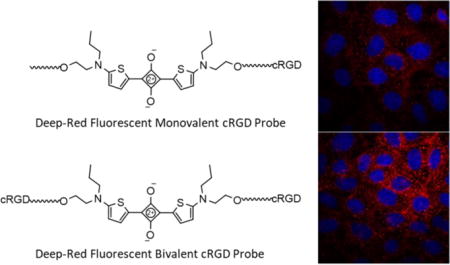
The study employed the three deep-red fluorescent probes in Figure 1. They have the same squaraine fluorophore whose narrow and intense emission could be readily imaged in cell culture and also in living subjects.25 Furthermore, the untargeted probe, Sq, has the same brightness as the two targeted versions (Table S1) which facilitated comparative image analysis. The targeting group was the cyclic peptide cRGD, an antagonist for the αvβ3 receptor, and there were two targeted fluorescent probes, monovalent SqRDG1 with one cRGD targeting unit and divalent SqRGD2 with two cRGD targeting units. A green emitting probe, Cy3RGD1, with one cRGD targeting unit was also utilized in the competitive cell uptake experiments.
Figure 1.
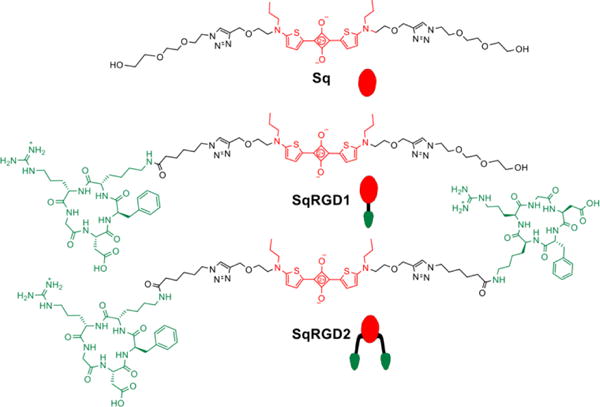
Chemical and schematic structures of fluorescent probes
3.2. Quantification of Cell-Surface Integrin Receptors
The expression levels of αvβ3 receptor were quantified by conducting flow cytometry experiments. OVCAR-4 cells were treated with FITC-conjugated anti-αvβ3 antibody and the cell fluorescence intensity was detected with a flow cytometer (Figure S4). The number of αvβ3 receptors per cell was determined by comparison of the cell fluorescence with a calibration plot created from FITC-conjugated bead standards. The same measurements were repeated with a positive control cell-line (U-87 MG) and two negative control cell-lines (A549 and MCF-7). In Table 1 is the average number of αvβ3 integrin receptors per cell for these cell-lines, and as expected both OVCAR-4 and U-87 MG had high levels of αvβ3 receptor while A549 and MCF-7 had no detectable expression (Figure S4 and S5). The high and low expression of αvβ3 receptor for OVCAR-4 and A549 cells was confirmed by fluorescence micrographs of the cells after incubation with the FITC-conjugated anti-αvβ3 antibody (Figure 2). The average cell surface area was determined using an optical microscopy method that stained the cell plasma membrane with a fluorescent dye (DiI) and constructed a 3-D model from confocal laser scanning microscopy (CLSM) slices. Representative 3-D reconstructions of the CLSM slices for A549, OVCAR-4, and U-87 MG cell lines are shown in Figure S5. In conjunction with the αvβ3 receptor count per cell, these surface area measurements gave the receptor density. OVCAR-4 cells were found to have roughly three times the surface area of U-87 MG cells, which means the receptor density for the OVCAR-4 cells was ~40% smaller.
Table 1.
αvβ3 receptor number per cell, average cell surface area, and receptor density
| Cell Line | αvβ3 receptors per cell | cell surface area (μm2) | receptor density (receptors/μm2) |
|---|---|---|---|
| A549 | - | 3500 ± 600 | - |
| OVCAR-4 | 98000 ± 25000 | 8900 ± 500 | 11 ± 3 |
| U87-MG | 52000 ± 14000 | 2900 ± 500 | 18 ± 6 |
Figure 2.
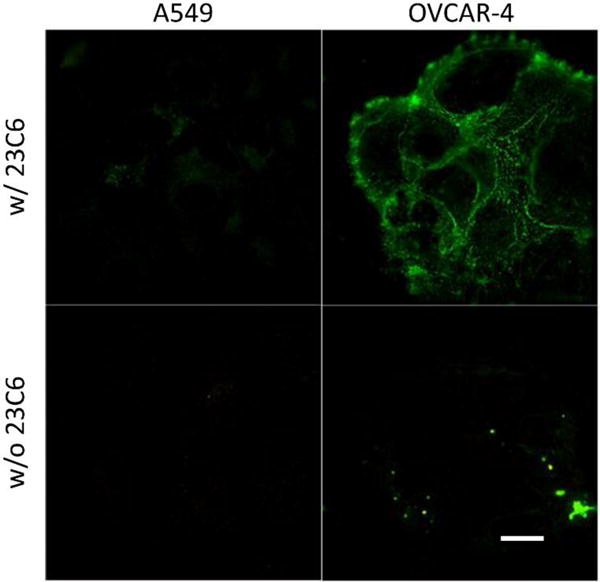
Immunocytochemistry micrographs of cells treated with 23C6-FITC (anti αVβ₃) confirming expression of αvβ3 in OVCAR-4 and absence in A549 cells. Scale bar is 30 μm.
3.3. Internalization in OVCAR-4 Cells In Vitro
A series of fluorescence microscopy experiments measured the uptake of the cRGD-targeted probes into OVCAR-4 cells. Separate populations of cells were treated with SqRGD1 or SqRGD2 in media for 30 minutes, fixed, and imaged. Deep-red fluorescence signal from the SqRGD1 and SqRGD2 was seen as punctate spots inside the cells, and there was minimal uptake of untargeted Sq (Figure 3a,b). Both the rate and amount of cell internalization was greater for the divalent SqRGD2 probe (Figure 3c,d). After 20 minutes, the mean deep-reed fluorescence intensity of OVCAR-4 cells treated with divalent SqRGD2 was 2.3 ± 0.7 times greater than cells treated with SqRGD1 probe.
Figure 3.
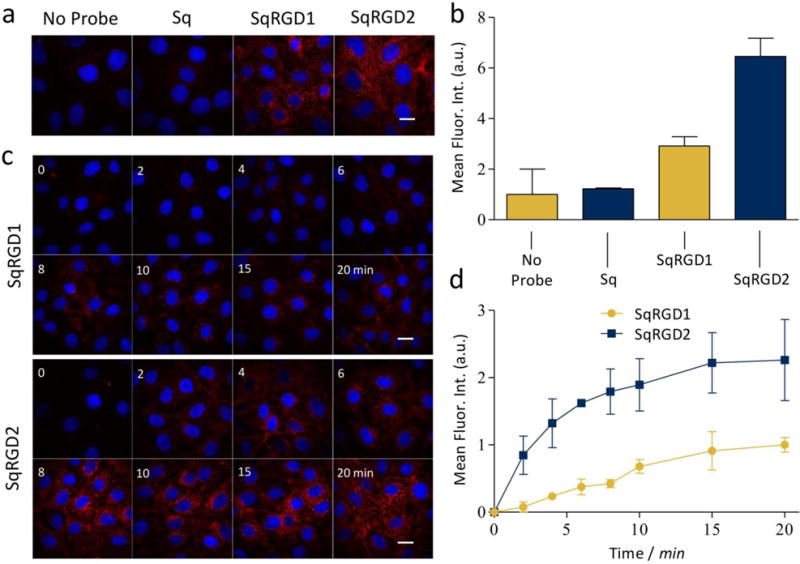
(a) Representative micrographs comparing internalization of probe (100 nM) in OVCAR-4 cells after 30 minute, with (b) associated quantification of deep-red intracellular fluorescence. (c) Representative micrographs comparing internalization of probe (100 nM) in OVCAR-4 cells over time, with (d) associated quantification of deep-red intracellular fluorescence. Blue fluorescence indicates Hoechst nuclear stain. Scale bar is 30 μm.
A second set of competitive cell uptake experiments incubated OVCAR-4 cells for 30 minutes with either a binary mixture of green, monovalent Cy3RGD1 and deep-red monovalent SqRGD1, or a binary mixture of Cy3RGD1 and divalent SqRGD2. Shown in Figure 4 are representative cell micrographs and quantitative analyses for each cell uptake experiment. When competing directly against Cy3RGD1, the divalent SqRGD2 was more competitive than the monovalent SqRGD1. This is succinctly expressed by the ratio of deep-red to green fluorescence inside the cells, which was 2.2 fold greater for the SqRGD2/Cy3RGD1 competition versus the SqRGD1/Cy3RGD1 competition.
Figure 4.
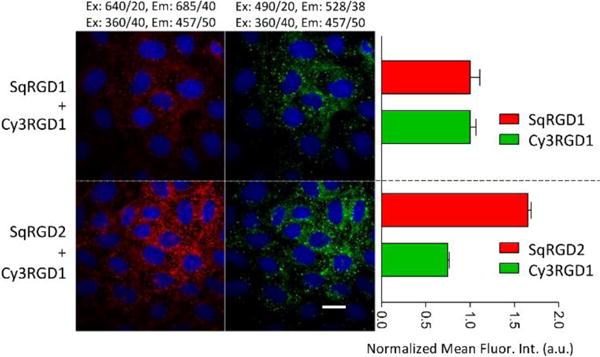
Micrographs showing competitive internalization of green Cy3RGD1 probe and a deep-red squaraine probe (each 100 nM) in OVCAR-4 cells after 30 minutes, with associated quantification of intracellular fluorescence. The SqRGD2 competed better against Cy3RGD1 than the SqRGD1. Blue fluorescence shows Hoechst nuclear stain. Scale bar is 30 μm.
The micrographs in Figure 3 suggested that the probes were taken up by endocytosis and this was confirmed by co-incubation and imaging experiments that mixed each deep-red RGD probe with TRITC-Dextran, a known marker for endosomes and lysosomes (Figure S6). In order to elucidate the uptake mechanism, a series of cell uptake experiments were conducted under conditions that inhibited a specific pathway. Receptor blocking experiments showed that the presence of excess free cRGD (structure shown in Scheme S2) lowered the cell uptake of SqRGD1 and SqRGD2 (Figure 5), indicating that the probe uptake was mediated by αvβ3 receptors. Both cold temperature and ATP depletion significantly decreased probe uptake, which are observations consistent with an active membrane transport process (Figures S7, S8). Three inhibitors of specific endocytosis pathways were also examined. Pretreatment of the cells with hyptertonic sucrose, known to inhibit clathrin mediated endocytosis, greatly reduced probe uptake (Figure S9). Cell treatment with nystatin, an inhibitor of caveolae mediated endocytosis, also inhibited cell uptake, but cell treatment with amiloride, an inhibitor of micropinocytosis, had no effect on probe uptake as expected.
Figure 5.
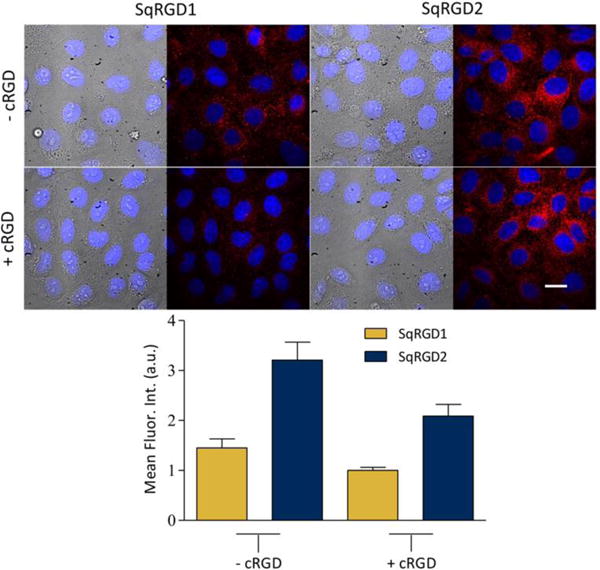
Micrographs showing internalization of SqRGD1 or SqRGD1 (each 100 nM) in OVCAR-4 cells after 30 minutes, with associated quantification of deep-red intracellular fluorescence. Probe internalization was inhibited by the presence of free cRGD (1.0 μM) in the sample. Blue fluorescence shows Hoechst nuclear stain. Scale bar is 30 μm.
Early in the microscopy studies we noticed that the fluorescent images due to staining by SqRGD1 or SqRGD2 were susceptible to bleaching if the cell samples were illuminated constantly for several minutes (Figure S10). This was one reason why prolonged live cell imaging was not employed to quantify cell uptake. To ensure that the micrograph intensities in Figures 3–5 could be directly compared, the fluorescent images were acquired with a constant 2 second acquisition time.
3.4. Uptake in OVCAR-4 Tumors In Vivo
Fluorescence imaging was used to compare the biodistribution of Sq, SqRGD1, and SqRGD2 in living nude mice bearing OVCAR-4 tumors in their rear flanks. The mice were inoculated with OVCAR-4 cells supported in Matrigel, and the tumors were allowed to grow over 6 weeks. Three separate cohorts were dosed with 3 nmol of either Sq, SqRGD1, or SqRGD2 by tail vein injection and after 3 hours the mice were sacrificed. The organs and tumors were collected and imaged using an in vivo imaging station with a deep-red fluorescence filter set. Shown in Figure 6 is a representative set of images and a quantitative summary of the imaging data. The tumors from mice dosed with SqRGD2 were almost 3 times brighter than the tumors from mice treated with SqRGD1, which in turn were about 50% brighter than the tumors from mice treated with Sq. There was also higher accumulation of SqRGD2 in the kidneys, liver and lungs.
Figure 6.
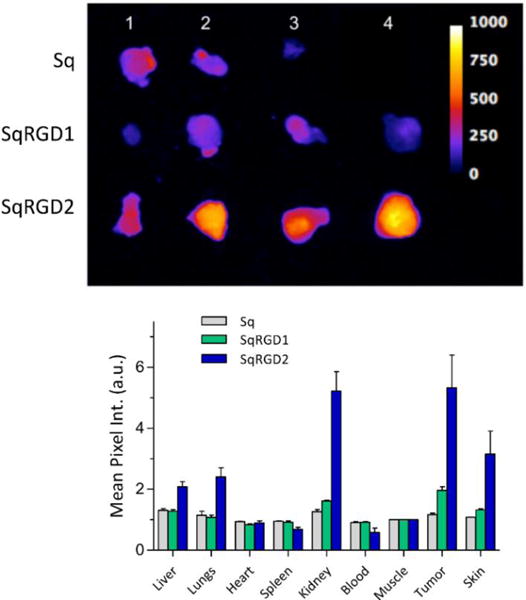
(top) Deep-red fluorescence images of OVCAR-4 tumors removed from mice 3 hours after intravenous injection (3 nmol/mouse) of (top row, 3 tumors) Sq, (middle row, 4 tumors) SqRGD1, and (bottom row, 4 tumors) SqRGD2. All images were scaled for pixel intensity of 0-1000. (bottom) Biodistribution of fluorescent probes in excised tissue, reported as average mean pixel intensity (MPI) normalized to excised muscle, ± SEM.
4. Discussion
Most studies involving integrin expression rely on semi-quantitative assays such as Western blots,26 and very few have explicitly quantified the number of αvβ3 receptors per cell.27 As expected, our flow cytometry measurements did not detect αvβ3 on the surface of A549 or MCF-7 cells which do not express the integrin β3 subunit.27 The high number of αvβ3 receptors on the surface of OVCAR-4 cells ([9.8 ± 2.5] × 104/cell) was almost twice that on the surface of U87-MG cells, which is considered a high αvβ3 expression cell-line. However, OVCAR-4 cells have roughly three times the surface area of U87-MG cells which means the average αvβ3 receptor density for OVCAR-4 cells (11 ± 3 receptors/μm2) is lower than U87-MG cells (18 ± 6 receptors/μm2). From a molecular targeting perspective, cell surface receptor densities are more informative than cell transcriptome or proteome profiles. The average αvβ3 receptor density defines the average distance between integrin subunits which is an important parameter that influences molecular recognition processes such clustering, signaling, and internalization.28,29 But it must be emphasized that integrins are often sequestered into focal adhesions and thus there is significant deviation of receptor density across the cell surface and this variation is likely to change with cell status.30
The deep-red fluorescence of the squaraine probes matches closely with the common Cy5 filter set that is available on most microscopes and animal imaging stations. This means the same squaraine probes can be studied in vitro and in vivo which improves reliability of the conclusions. Typically, squaraine dyes are brighter and more photostable than Cy 5, but the thiophene-derived squaraine probes used here have about the same properties as Cy 5. Photobleaching is not a performance concern for in vivo imaging which only requires weak illumination light and is the major application of this research. But many types of fluorescence microscopy experiments are facilitated by using ultrabright and stable fluorescent probes. If this was deemed to be an important goal, we could easily improve the squaraine brightness and photostability by employing a well-established chemical modification strategy that surrounds the dye with a protective macrocycle.31
While numerous molecular imaging studies have looked at the targeting of RGD-based probes to cancer cells and tumors, very few have determined if probe is on the cell surface or intracellular.32–33 This is important as probe accumulation inside the cancer cells is expected to give a higher and more sustained imaging signal.34 To ensure that the fluorescent signal was only due to probe molecules inside the cell, the imaging protocol included several wash steps to remove any probe from the external surface.35 Additionally, automated focusing on the nucleus was used to view the intracellular region, and deconvolution image processing removed fluorescence signal from outside this region. There was substantial internalization of SqRGD1 and SqRGD2 by OVCAR-4 cells compared to the non-targeted control probe Sq. Furthermore, internalization of the divalent SqRGD2 occurred faster than the monovalent SqRGD1. In principle, this could be due to a difference in probe avidities for the integrin receptors, or alternatively a difference in the rate of receptor internalization after probe binding. Some insight was gained from competitive fluorescence probe uptake experiments in which the two deep-red probes each competed separately against a green monovalent probe (Cy3RGD1). Uptake of Cy3RGD1 was decreased in the presence of deep-red divalent probe (SqRGD2) compared to the presence of deep-red monovalent probe (SqRGD1). Presumably the divalent SqRGD2 occupied a higher number of cell surface receptors which lowered the uptake of Cy3RGD1. Endocytosis inhibition studies revealed that probe uptake was primarily due to clathrin and caveolae mediated endocytosis, and inhibition of either pathway decreased probe internalization by ~40%. Both of these pathways have been indicated as entry routes for RGD bearing probes, however, the extent of inhibition by caveolae inhibitor nystatin was surprising.36 This may be explained by reports that nystatin, which inhibits internalization by binding with cholesterol, may also affect clathrin mediated mechanisms as well.37 There is literature evidence that when multivalent probes crosslink integrins, there is a strong bias towards clathrin mediated endocytosis.32,36 It appears that the endocytotic pathways for uptake of monovalent SqRGD1 and divalent SqRGD2 are similar, which suggests that the enhanced uptake of divalent SqRGD2 is not due to probe-induced integrin clustering, but rather higher receptor avidity.
Consistent with previous reports,13 we found that subcutaneous OVCAR-4 tumors grew slowly, but reliably in nude mice. Fluorescence imaging of the excised tumors from mice treated with fluorescent probe showed the same trend as the cell internalization studies. That is, there was significantly more uptake of the divalent SqRGD2 compared to the monovalent SqRGD1. The divalent SqRGD2 also showed higher levels in the kidney, which is not surprising as prior studies of divalent RGD probes has found that complete clearance requires more than four hours38. While SqRGD2 did show higher levels in the lung, skin, and liver compared to SqRGD1, the liver accumulation was actually far lower than in other literature studies.38,39 Increased retention in non-tumor tissue and organs is an attribute shared by most molecular probes with multiple peptide targeting groups.40
5. Conclusion
The number αvβ3 integrin receptors on the surface of OVCAR-4 cells is high ([9.8 ± 2.5] × 104/cell) and almost twice the receptor number on the surface of U87-MG cells. But OVCAR-4 cells have roughly three times the surface area of U87-MG cells, which means the average αvβ3 receptor density for OVCAR-4 cells is actually lower (11 ± 3 versus 18 ± 6 receptors/μm2). OVCAR-4 cell uptake of a divalent probe with two cRGD targeting units was faster and more extensive than cell uptake of a monovalent probe with one cRGD. The same trend was observed for probe accumulation in OVCAR-4 tumors in a mouse model. The results suggest that clinically relevant OVCAR-4 cells can be targeted using molecular probes based on αvβ3 integrin receptor antagonists such as the cRGD peptide. Furthermore, there is extensive cell uptake of the fluorescent probes which favours high contrast molecular imaging and efficient drug delivery. With further development these fluorescent RGD-based probes could help clinicians to identify patients with integrin positive HGSOC that should respond to integrin-targeted chemotherapy.41 A related path towards clinical translation is fluorescence guided surgery of ovarian cancer, where an emerging paradigm employs 700 nm and 800 nm emission channels for simultaneous visualization of two different molecular probes that target distinct anatomical locations (e.g., cancer and nerves.)42 The bright and narrow deep-red emission of fluorescent squaraine probes matches very well with the 700 nm observation channel and thus should nicely complement fluorescent molecular probes that can be observed with the 800 nm channel.43-44
Supplementary Material
Acknowledgments
This work was supported by grants from the NIH (R01GM059078 to B.D.S. and T32GM075762 to S.K.S, C.L.S. and F.M.R.).
Footnotes
Supplementary Material
Supplementary data associated with this article is available.
References
- 1.Siegel RL, Miller KD, Jemal A. Cancer statistics, 2016. CA: Cancer J Clin. 2016;66:7–30. doi: 10.3322/caac.21332. [DOI] [PubMed] [Google Scholar]
- 2.Bowtell DD, Böhm S, Ahmed AA, Aspuria PJ, Bast RC, Jr, et al. Rethinking ovarian cancer II: reducing mortality from high-grade serous ovarian cancer. Nat Rev. 2015;15:668–679. doi: 10.1038/nrc4019. [DOI] [PMC free article] [PubMed] [Google Scholar]
- 3.Vaughan S, Coward JI, Bast RC, Jr, Berchuk A, Berek JS, et al. Rethinking ovarian cancer: recommendations for improving outcomes. Nat Rev Cancer. 2011;11(10):719–725. doi: 10.1038/nrc3144. [DOI] [PMC free article] [PubMed] [Google Scholar]
- 4.Bristow RE, Tomacruz RS, Armstrong DK, Trimble EL, Montz FJ. Survival effect of maximal cytoreductive surgery for advanced ovarian carcinoma during the platinum era: a meta-analysis. J Clin Oncol. 2002;20(5):1248–1259. doi: 10.1200/JCO.2002.20.5.1248. [DOI] [PubMed] [Google Scholar]
- 5.Wimberger P, Wehling M, Lehmann N, Kimmig R, Schmalfeldt B, et al. Influence of residual tumor on outcome in ovarian cancer patients with FIGO stage IV disease. Ann Surg Oncol. 2010;17(6):1642–1658. doi: 10.1245/s10434-010-0964-9. [DOI] [PubMed] [Google Scholar]
- 6.Banerjee S, Kaye SB. New strategies in the treatment of ovarian cancer: current clinical perspectives and future potential. Clin Cancer Res. 2013;19(5):961–8. doi: 10.1158/1078-0432.CCR-12-2243. [DOI] [PubMed] [Google Scholar]
- 7.Banerjee S, Kaye SB. The role of targeted therapy in ovarian cancer. Eur J Cancer. 2011;47(3):116–130. doi: 10.1016/S0959-8049(11)70155-1. [DOI] [PubMed] [Google Scholar]
- 8.Domcke S, Sinha R, Levine DA, Sander C, Schultz N. Evaluating cell lines as tumour models by comparison of genomic profiles. Nat Commun. 2013;4:2126. doi: 10.1038/ncomms3126. [DOI] [PMC free article] [PubMed] [Google Scholar]
- 9.Integrated genomic analyses of ovarian carcinoma. Nature. 2011;474(7353):609–615. doi: 10.1038/nature10166. [DOI] [PMC free article] [PubMed] [Google Scholar]
- 10.Beaufort CM, Helmijr JC, Piskorz AM, Hoogstraat M, Ruigrok-Ritstier K, et al. Ovarian cancer cell line panel OCCP: clinical importance of in vitro morphological subtypes. PLoS One. 2014;9(9):e103988. doi: 10.1371/journal.pone.0103988. [DOI] [PMC free article] [PubMed] [Google Scholar]
- 11.Anglesio MS, Wiegand KC, Melnyk N, Chow C, Salamanca S, et al. Type-specific cell line models for type-specific ovarian cancer research. PLoS One. 2013;8(9):e72162. doi: 10.1371/journal.pone.0072162. [DOI] [PMC free article] [PubMed] [Google Scholar]
- 12.Hamilton TC, Young RC, Robet FO. Experimental model systems of ovarian cancer: applications to the design and evaluation of new treatment approaches. Semin Oncol. 1984;11(3):285–289. [PubMed] [Google Scholar]
- 13.Mitra AK, Davis DA, Tomar S, Roy L, Gurler H, et al. In vivo tumor growth of high-grade serous ovarian cancer cell lines. Gynecol Oncol. 2015;138(2):372–7. doi: 10.1016/j.ygyno.2015.05.040. [DOI] [PMC free article] [PubMed] [Google Scholar]
- 14.Asanuma D, Sakabe M, Kamiya M, Yamamoto K, Hiratake J, et al. Sensitive β-galactosidase-targeting fluorescence probe for visualizing small peritoneal metastatic tumours in vivo. Nature Com. 2015;6:6463. doi: 10.1038/ncomms7463. [DOI] [PMC free article] [PubMed] [Google Scholar]
- 15.Gimond C, Aumailley M. Cellular interactions with the extracellular matrix are coupled to diverse transmembrane signaling pathways. Exp Cell Res. 1992;203(2):365–373. doi: 10.1016/0014-4827(92)90010-6. [DOI] [PubMed] [Google Scholar]
- 16.Pozzo DA, Ni MH, Esposito E, Dallavalle S, Musso L, et al. Novel tumor-targeted RGD peptide–camptothecin conjugates: Synthesis and biological evaluation. Bioorganic Med. 2010;18(1):64–72. doi: 10.1016/j.bmc.2009.11.019. [DOI] [PubMed] [Google Scholar]
- 17.Gholami AM, Hahne H, Wu Z, Auer FJ, Meng C, et al. Global proteome analysis of the NCI-60 cell line panel. Cell Rep. 2013;4(3):609–620. doi: 10.1016/j.celrep.2013.07.018. [DOI] [PubMed] [Google Scholar]
- 18.Pfaff M, Reinhardt DP, Sakai LY, Timpl R. Cell adhesion and integrin binding to recombinant human fibrillin-1. FEBS Lett. 1996;384(3):247–250. doi: 10.1016/0014-5793(96)00325-0. [DOI] [PubMed] [Google Scholar]
- 19.Hekman MCH, Boerman OC, Bos DL, Massuger LFAG, Weil S, et al. Improved intraoperative detection of ovarian cancer by folate receptor alpha targeted dual-modality imaging. Mol Pharm. 2017;14(10):3457–3463. doi: 10.1021/acs.molpharmaceut.7b00464. [DOI] [PMC free article] [PubMed] [Google Scholar]
- 20.Tummers QRJG, Hoogstins CES, Gaarenstroom KN, de Kroon CD, van Poelgeest MIE, Vuyk J, et al. Intraoperative imaging of folate receptor alpha positive ovarian and breast cancer using the tumor specific agent EC17. Oncotarget. 2016;7(22):32144–55. doi: 10.18632/oncotarget.8282. [DOI] [PMC free article] [PubMed] [Google Scholar]
- 21.Nick AM, Coleman RL, Ramirez PT, Sood AK. A framework for a personalized surgical approach to ovarian cancer. Nat Rev Clin Oncol. 2015;12(4):239–245. doi: 10.1038/nrclinonc.2015.26. [DOI] [PMC free article] [PubMed] [Google Scholar]
- 22.Hoogstins CE, Tummers QR, Gaarenstroom KN, de Kroon CD, Trimbos JB, et al. A novel tumor-specific agent for intraoperative near-infrared fluorescence imaging: a translational study in healthy volunteers and patients with ovarian cancer. Clin Cancer Res. 2016;22(12):2929–38. doi: 10.1158/1078-0432.CCR-15-2640. [DOI] [PubMed] [Google Scholar]
- 23.Harlaar NJ, Kelder W, Sarantopoulos A, Bart J, Themelis G, et al. Real-time near infrared fluorescence (NIRF) intra-operative imaging in ovarian cancer using an αvβ3-integrin targeted agent. Gynecol Oncol. 2013;128(3):590–595. doi: 10.1016/j.ygyno.2012.12.011. [DOI] [PubMed] [Google Scholar]
- 24.Handgraaf H, Verbeek F, Tummers Q, Boogerd L, Velde C, et al. Real-time near-infrared fluorescence guided surgery in gynecologic oncology: a review of the current state of the art. Gynecol Oncol. 2014;135(3):606–13. doi: 10.1016/j.ygyno.2014.08.005. [DOI] [PubMed] [Google Scholar]
- 25.Johnson JR, Fu N, Arunkumar E, Leevy WM, Gammon ST, et al. Squaraine rotaxanes: Superior substitutes for Cy-5 in molecular probes for near-infrared fluorescence cell imaging. Angew Chemie – Int Ed. 2007;46(29):5528–31. doi: 10.1002/anie.200701491. [DOI] [PMC free article] [PubMed] [Google Scholar]
- 26.Taherian A, Li X, Liu Y, Haas TA. Differences in integrin expression and signaling within human breast cancer cells. BMC Cancer. 2011;11(293) doi: 10.1186/1471-2407-11-293. [DOI] [PMC free article] [PubMed] [Google Scholar]
- 27.Benedetto S, Pulito R, Crich S, Tarone G, Aime S, et al. Quantification of the expression level of integrin receptor αvβ3 in cell lines and MR imaging with antibody-coated iron oxide particles. Magn Reson Med. 2006;56(4):711–6. doi: 10.1002/mrm.21023. [DOI] [PubMed] [Google Scholar]
- 28.Atilgan E, Ovryn B. Nucleation and growth of integrin adhesions. Biophys J. 2009;96(9):3555–3572. doi: 10.1016/j.bpj.2009.02.023. [DOI] [PMC free article] [PubMed] [Google Scholar]
- 29.Welf ES, Naik UP, Ogunnaike BA. A spatial model for integrin clustering as a result of feedback between integrin activation and integrin binding. Biophys J. 2012;103(6):1379–1389. doi: 10.1016/j.bpj.2012.08.021. [DOI] [PMC free article] [PubMed] [Google Scholar]
- 30.Ballestrem C, Hinz B, Imhof BA, Wehrle-Haller B. Marching at the front and dragging behind. J Cell Biol. 2001;155(7):1319–1332. doi: 10.1083/jcb.200107107. [DOI] [PMC free article] [PubMed] [Google Scholar]
- 31.Johnson JR, Fu N, Arunkumar E, Leevy MW, Gammon ST, et al. Squaraine rotaxanes: superior substitutues for Cy-5 in molecular probes for near-infrared fluorescence cell imaging. Angew Chem Int Ed. 2007;46:5528–5531. doi: 10.1002/anie.200701491. [DOI] [PMC free article] [PubMed] [Google Scholar]
- 32.Sancey L, Lucie S, Garanger E, Elisabeth G, Foillard S, et al. Clustering and internalization of integrin αvβ3 with a tetrameric RGD-synthetic peptide. Mol Ther. 2009;17(5):837–43. doi: 10.1038/mt.2009.29. [DOI] [PMC free article] [PubMed] [Google Scholar]
- 33.Cressman S, Sun Y, Maxwell E, Fang N, Chen D, Cullis P. Binding and uptake of RGD-containing ligands to cellular αvβ3 integrins. Int J Pept Res Ther. 2009;15(1):49–59. [Google Scholar]
- 34.Chuang KH, Wang HE, Chen FM, Tzou SC, Cheng CM, et al. Endocytosis of PEGylated agents enhances cancer imaging and anticancer efficacy. Mol Cancer Ther. 2010;9(6):1903–12. doi: 10.1158/1535-7163.MCT-09-0899. [DOI] [PubMed] [Google Scholar]
- 35.Castel S, Pagan R, Mitjans F, Piulats J, Goodman S, et al. RGD peptides and monoclonal antibodies, antagonists of alpha(v)-integrin, enter the cells by independent endocytic pathways. Lab Invest. 2001;81(12):1615–26. doi: 10.1038/labinvest.3780375. [DOI] [PubMed] [Google Scholar]
- 36.Guo Z, He B, Jin H, Zhang HH, Dai W, et al. Targeting efficiency of RGD-modified nanocarriers with different ligand intervals in response to integrin αvβ3 clustering. Biomaterials. 2014;35(23):6106–17. doi: 10.1016/j.biomaterials.2014.04.031. [DOI] [PubMed] [Google Scholar]
- 37.McMahon HT, Boucrot E. Molecular mechanism and physiological functions of clathrin-mediated endocytosis. Nat Rev Mol Cell Biol. 2011;12(8):517–533. doi: 10.1038/nrm3151. [DOI] [PubMed] [Google Scholar]
- 38.Cao Q, Li ZB, Chen K, Wu Z, He L, et al. Evaluation of biodistribution and anti-tumor effect of a dimeric RGD peptide–paclitaxel conjugate in mice with breast cancer. Eur J Nucl Med Mol Imaging. 2008;35(8):1489–1498. doi: 10.1007/s00259-008-0744-y. [DOI] [PubMed] [Google Scholar]
- 39.Jin Z-H, Furukawa T, Degardin M, Sugyo A, Tsuji AB, et al. αVβ3 integrin-targeted radionuclide therapy with 64Cu-cyclam-RAFT-c(-RGDfK-)4. Mol Cancer Ther. 2016;15(9):2076–85. doi: 10.1158/1535-7163.MCT-16-0040. [DOI] [PubMed] [Google Scholar]
- 40.Ruoslahti E, Bhatia SN, Sailor MJ. Targeting of drugs and nanoparticles to tumors. J Cell Biol. 2010;188(6):759–68. doi: 10.1083/jcb.200910104. [DOI] [PMC free article] [PubMed] [Google Scholar]
- 41.Kobayashi M, Sawada K, Kimura T. Potential of integrin inhibitors for treating ovarian cancer: A literature review. Cancers. 2017;9(7):83. doi: 10.3390/cancers9070083. [DOI] [PMC free article] [PubMed] [Google Scholar]
- 42.Handgraaf HJM, Verbeek FPR, Tummers QRJG, Boogerd LSF, Van De Velde CJH, et al. Real-time near-infrared fluorescence guided surgery in gynecologic oncology: A review of the current state of the art. Gynecol Oncol. 2014;135(3):606–13. doi: 10.1016/j.ygyno.2014.08.005. [DOI] [PubMed] [Google Scholar]
- 43.Tichauer KM, Samkoe KS, Sexton KJ, Hextrum SK, Yang HH, et al. In vivo quantification of tumor receptor binding potential with dual-reporter molecular imaging. Mol Imaging Biol. 2012;14(5):584–92. doi: 10.1007/s11307-011-0534-y. [DOI] [PMC free article] [PubMed] [Google Scholar]
- 44.Huang L, Li Z, Zhao Y, Yang J, Yang Y, et al. Nanomedicine: enhancing photodynamic therapy through resonance energy transfer constructed near-infrared photosensitized nanoparticles. Adv Mater. 2017;29(28):1604789. doi: 10.1002/adma.201604789. [DOI] [PMC free article] [PubMed] [Google Scholar]
Associated Data
This section collects any data citations, data availability statements, or supplementary materials included in this article.