

SUMMARY
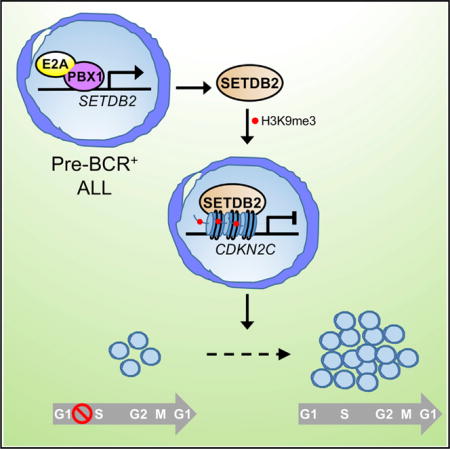
Acute lymphoblastic leukemia (ALL) is associated with significant morbidity and mortality, necessitating further improvements in diagnosis and therapy. Targeted therapies directed against chromatin regulators are emerging as promising approaches in preclinical studies and early clinical trials. Here, we demonstrate an oncogenic role for the protein lysine methyltransferase SETDB2 in leukemia pathogenesis. It is overexpressed in pre-BCR+ ALL and required for their maintenance in vitro and in vivo. SETDB2 expression is maintained as a direct target gene of the chimeric transcription factor E2A-PBX1 in a subset of ALL and suppresses expression of the cell-cycle inhibitor CDKN2C through histone H3K9 tri-methylation, thus establishing an oncogenic pathway subordinate to E2A-PBX1 that silences a major tumor suppressor in ALL. In contrast, SETDB2 was relatively dispensable for normal hematopoietic stem and progenitor cell proliferation. SETDB2 knockdown enhances sensitivity to kinase and chromatin inhibitors, providing a mechanistic rationale for targeting SETDB2 therapeutically in ALL.
Graphical abstract
In Brief: Lin et al. report that the protein lysine methyltransferase SETDB2 is a direct target of chimeric transcription factor E2A-PBX1 and required for pathogenesis in B cell precursor leukemia. SETDB2 suppresses expression of the cell-cycle inhibitor CDKN2C, establishing an oncogenic pathway that silences a major tumor suppressor in acute leukemia.
INTRODUCTION
Acute lymphoblastic leukemia (ALL) is associated with significant morbidity and mortality in adults and children, despite ongoing improvements in diagnosis and therapy. ALLs are sub-categorized based on their karyotype, cell type, and immunophenotype, and many are associated with fusion proteins that serve as driving oncogenic mutations (Armstrong and Look, 2005; Pui and Evans, 2006). One of these fusion proteins is E2A-PBX1, which fuses the transcription factor E2A with the homeobox gene PBX1 to create a chimeric transcription factor involved in a phenotypically and genetically distinctive subtype of ALL (Borowitz et al., 1993; Nourse et al., 1990) associated with an intermediate clinical risk (Moorman et al., 2007; Pui et al., 2004). Despite its key role in leukemia pathogenesis, E2A-PBX1 has not yet proven to be a “druggable” transcription factor for therapeutic targeting. A potential strategy that circumvents this obstacle is to target the products of essential downstream genes. Several genes encoding pre-B cell receptor components are directly regulated by E2A-PBX1 to sustain the expression of a functional pre-B cell receptor complex (Geng et al., 2015), and targeting the pre-B cell receptor signaling pathway with kinase inhibitors shows promising efficacy in preclinical studies of E2A-PBX1+ ALL (Duque-Afonso et al., 2016; Geng et al., 2015). However, this approach is likely to be limited, since inhibition of kinase signaling pathways is generally associated with development of resistance and short-lived clinical response (Logue and Morrison, 2012; Sakamoto et al., 2015).
An alternative approach is to target chromatin modifier enzymes (epigenetic regulators), whose function may be required by or cooperate with chimeric transcription factors in leukemia development (Dawson and Kouzarides, 2012). Many leukemias harbor mutations in epigenetic factors (Cancer Genome Atlas Research Network et al., 2013), and epigenetic regulators may be aberrantly expressed or recruited to oncoprotein complexes to drive leukemia development (Bernt et al., 2011; Gilan et al., 2016; Zhu et al., 2016). Thus, inhibition of epigenetic regulators is an emerging therapeutic approach for antagonizing oncogenic transcription programs, including those driven by chimeric transcription factors, and several epigenetic therapies have been advanced into clinical trials (Cai et al., 2015). Furthermore, preclinical studies show that combination therapy targeting epigenetic factors has greater efficacy and less toxicity (Gilan et al., 2016). However, there is little understanding of the epigenetic factors that may functionally contribute to ALL pathogenesis.
To identify critical epigenetic regulators in ALL, we used high-throughput genomic approaches, which identified SETDB2, a histone H3K9 tri-methyltransferase, as a major regulator of leukemogenesis downstream of E2A-PBX1. Our studies provide basic mechanistic insight into the epigenetic role of SETDB2 in leukemia pathogenesis and implicate it as a promising therapeutic target.
RESULTS
SETDB2 Is an Epigenetic Target Gene of E2A-PBX1 in preB-ALL
To identify potential downstream effectors in E2A-PBX1-transformed pre-BCR+ leukemia, a differential expression screen was conducted using human E2A-PBX1+ cell lines (RCH-ACV and 697) depleted of E2A-PBX1 by short hairpin RNAs (shRNAs) coupled with high-throughput RNA sequencing (RNA-seq) (Figures S1A–S1D). The overall quality of RNA-seq data was assured by sample-wise clustering based on global transcriptomic expression (Figure S2A). This identified 364 and 323 genes that were significantly upregulated and downregulated, respectively, in both cell lines (Figure S2B). Collectively, these 687 differentially expressed genes were enriched in gene ontology (GO) terms “lymphocyte differentiation,” “regulation cell death,” and “apoptosis,” consistent with the observed phenotypes in RCH-ACV cells depleted of E2A-PBX1 (Figure S2C). In addition, previously reported genetic targets associated with E2A-PBX1+ preB-ALL, such as WNT16 (Diakos et al., 2014; McWhirter et al., 1999) and NOTCH2 (Feldman et al., 2000), were also captured in this screen. Taken together, these data demonstrated the robustness and sensitivity of the high-throughput screen for the transcriptional program subordinate to E2A-PBX1 in pre-BCR+ ALL cells.
Since epigenetic regulators play important roles in leukemia initiation and development, the dataset was interrogated for epigenetic factors whose expression was directly or indirectly dependent on E2A-PBX1. Notably, SETDB2, a member of the protein lysine methyltransferase (PKMT) family coding for an H3K9 tri-methyltransferase, was downregulated with high significance in two E2A-PBX1+ cell lines (697 and RCH-ACV) following depletion of E2A-PBX1 (Figure 1A). Western blot analysis also confirmed that shRNA-mediated E2A-PBX1 knockdown resulted in decreased levels of SETDB2 in these two cell lines (Figure 1B). In addition, PRDM8, which codes for an H3K9me2 methyltransferase, was also downregulated in both cell lines but only reached statistical significance in 697 cells. Therefore, we reasoned that H3K9 methylation, typically associated with repressive chromatin states, may be a potential critical epigenetic mark in E2A-PBX1-mediated oncogenic transformation. In support of this hypothesis, SETDB2 was observed to be significantly overexpressed in E2A-PBX1+ patients compared with mononuclear control cells (Figure 1C) (Haferlach et al., 2010). Furthermore, chromatin immunoprecipitation (ChIP)-PCR analysis demonstrated that E2A-PBX1 occupied the SETDB2 promoter (Figure 1D), consistent with ChIP sequencing (ChIP-seq) data (Geng et al., 2015) and suggesting that SETDB2 is likely an E2A-PBX1 binding target in primary patient ALL (Figure S2D). In support of this, E2A-PBX1 strongly activated the proximal SETDB2 promoter as measured by reporter assay (Figure S2E). Taken together, these data demonstrate that SETDB2 is a candidate epigenetic target in E2A-PBX1-induced preB-ALL.
Figure 1. SETDB2 Is a Direct Target Gene of E2A-PBX1 in Pre-BCR+ Leukemia.

(A) Heatmap shows expression levels of protein lysine methyltransferase (PKMT) family proteins in the indicated cell lines with or without E2A-PBX1 knockdown. Normalized expression level is expressed as log2 of FPMK (fragments per million read per thousand gene length). Heatmap of log2 fold changes is calculated from comparing the fold change of mean expression value in E2A-PBX1-depleted cells (KD) versus control cells (Ctr). Rows that include green blocks indicate genes downregulated in E2A-PBX1-depleted cells.
(B) Western blot analysis shows the expression of SETDB2 after E2A-PBX1 knockdown in RCH-ACV and 697 cell lines. GAPDH was used as loading control.
(C) Boxplot of SETDB2 expression level distribution in primary E2A-PBX1 B-ALL samples versus mononuclear cells of healthy donors. Notches are displayed in the boxplot to indicate significant median difference at 95% confidence if two notches do not overlap. Sample mean is indicated as a red dot within boxplot. Significant mean difference is calculated by unpaired t test; *p < 0.0002.
(D) Bar graph indicates chromatin occupancy determined by ChIP-qPCR of exogenous E2A-PBX1 GFP-fusion protein in RCH-ACV cells. IgH Eu and NCAPD2 served as positive and negative controls, respectively. Data indicate mean ± SEM (n = 3). Statistical analysis was performed by Student t test. *p < 0.05; n.s., not significant; TSS, transcription start site.
See also Figures S1 and S2.
SETDB2 Is Critical for Growth and Maintenance of Human E2A-PBX1+ preB-ALL
To functionally delineate the role of SETDB2 in E2A-PBX1+ preB-ALL, its potential oncogenic requirement was assessed using in vitro and in vivo transformation model systems. SETDB2 depletion by shRNA knockdown in three E2A-PBX1+ human leukemia cell lines significantly reduced and impaired in vitro growth in liquid culture or colony formation in methylcellulose medium, strong indicators of their dependency on SETDB2 (Figures 2A–2E). The in vivo requirement of SETDB2 was assessed in non-obese diabetic-severe combined immunodeficiency (NOD-SCID) mice transplanted with either control or SETDB2 depleted cells. Mice transplanted with two different dosages of SETDB2-depleted cells survived about 50% longer than control mice (Figure 2F). Although leukemia eventually developed in mice transplanted with SETDB2-depleted cells, this was caused by cells that had escaped SETDB2 knockdown by unknown mechanisms (Figures 2F and 2G), further supporting the essential requirement for SETDB2. To complement results from the knockdown studies, a CRISPR-Cas9 approach (Heckl et al., 2014) was used to inactivate SETDB2 in E2A-PBX1+ cells (Figures 2H and 2I; Figure S3A). E2A-PBX1+ cells transduced with SETDB2 small guide RNAs (sgRNAs) (GFP+ cells) showed a 40% growth reduction in liquid culture compared to control cells (Figure 2J; Figure S3C), which matched the percentage of SETDB2 deletion measured by Sanger sequencing of GFP+ individual cells (Figure S3B). Taken together, multiple experimental approaches demonstrate that E2A-PBX1+ leukemia cells are strongly dependent on SETDB2 for leukemia maintenance.
Figure 2. Dependency of Human E2A-PBX1+ Leukemia Cells on SETDB2 for Growth and Maintenance.

(A) E2A-PBX1+ cell lines were transduced with lentiviral vectors expressing control (shLuc) or SETDB2 shRNAs. mCherry positive cells were sorted and relative SETDB2 transcript levels were quantified by qRT-PCR 4 days after transduction.**p < 0.01; ***p < 0.001.
(B) Western blot analysis indicates shRNA-mediated knockdown of SETDB2 in E2A-PBX1+ cell lines. GAPDH was used as loading control.
(C and D) Cell proliferation and colony-forming assays of human E2A-PBX1+ cell lines after shRNA-mediated knockdown of SETDB2. Cell numbers (C) and colony numbers (D) were enumerated after 4 and 5 days, respectively, and expressed relative to the numbers obtained with control shRNA-transduced cells. Data indicate means ± SEM (n = 3). **p < 0.01; ***p < 0.001.
(E) Representative colony morphologies are shown for the experiment in (C). Scale bars, 400 μm.
(F) Survival curves are shown for a cohort of mice transplanted with RCH-ACV leukemia cells treated with control or SETDB2 shRNAs in two cell dosages, 5 × 10⁴ and 4 × 10⁶ (n = 7 in each cohort). Log-rank test was used for statistical analysis.
(G) SETDB2 transcript levels are shown for bone marrow cells isolated from diseased mice 10 and 20 days after transplantation with control or SETDB2 shRNAs, respectively. Data indicate means ± SEM (n = 3). n.s., not significant.
(H) Scheme is indicated for SETDB2 sgRNAs. MBD, methyl-CpG binding domain; Pre, pre-SET motif; SET, SET domain.
(I) Gel image shows the result of T7 endonuclease assay performed on genomic DNA isolated from RCH-ACV cells transduced with 3 different SETDB2 sgRNAs. Digested PCR products (indicated by red asterisks) of the SETDB2 locus represent the presence of strand mismatches resulting from indels that were generated from imprecise repair of a DNA double-strand break.
(J) RCH-ACV cells were transduced with Cas9 vector only or together with SETDB2 sgRNAs, and GFP+ cells were sorted after 4 days. GFP+ cells were mixed 50/50 with non-treated RCH-ACV cells and monitored every 2 days. Diagram indicates mean ± SEM (n = 3).
See also Figure S3.
Human Hematopoietic Stem and Progenitor Cells Are Less Dependent on SETDB2
In direct comparison with primary leukemia samples, SETDB2 expression levels were significantly lower in normal hematopoietic stem and progenitor cells (cord blood and adult bone marrow CD34+ cells) (Figure 3A). In addition, analysis of several public RNA-seq datasets also showed that SETDB2 expression levels are lower in normal hematopoietic stem and progenitor cells (HSPCs) than primary leukemia cells (Figure 3B). The functional contributions of SETDB2 were examined by shRNA knockdown in cord blood and adult bone marrow CD34+ cells (Figures 3C and 3F) using colony-forming assays, which showed only slight reduction in colony-forming efficiency between control or SETDB2 knockdown HSPCs (Figures 3D, 3E, 3G, and 3H), in contrast to the substantial growth inhibition mediated by SETDB2 shRNAs in leukemia cells (Figures 2C–2E). Furthermore, SETDB2 was observed to have very low expression (on average, 3.8 reads per kilobase of transcript per million mapped reads [RPKM]) in more than 50 different normal tissues (Figure S4A). To gain more insight into the function of SETDB2 in leukemia pathogenesis, it was overexpressed in cord blood CD34+ cells. No significant differences were observed in the colony-forming abilities of SETDB2-expressing versus control CD34+ cells (Figures S4B and S4C), and its overexpression did not transform mouse HSPCs (data not shown). Thus, SETDB2 alone cannot transform progenitor cells. Together, these findings suggest that SETDB2 has low impact on normal HSPC function and is selectively important for leukemia cells, supporting its further evaluation as a therapeutic target.
Figure 3. Depletion of SETDB2 Minimally Impacts Normal HSPCs.

(A) Boxplot shows the relative expression level of SETDB2 in normal cord blood CD34+ cells (CB CD34+; n = 3), adult bone marrow CD34+ cells (adult BM CD34+; n = 3), ALL patients (n = 6), and AML patients (n = 4).
(B) Boxplot shows SETDB2 expression (RNA-seq) in normal human and mouse HSCs and progenitors and various subtypes of acute leukemia (RNA-seq data from the European Blueprint database).
(C–E) Normal cord blood CD34+ cells and (F–H) adult bone marrow CD34+ cells were transduced with lentiviral vectors expressing control (against luciferase, shLuc) or SETDB2 shRNAs. mCherry-positive cells were sorted, and relative SETDB2 transcript level was quantified by qRT-PCR 4 days after transduction (C and F). Colony-forming assays of human cord blood and bone marrow CD34+ cells after shRNA-mediated knockdown of SETDB2 were performed. Colony numbers (D and G) were enumerated after 10 days and expressed relative to the numbers obtained with control shRNA-transduced cells. Data indicate mean ± SEM (n = 3). **p < 0.01; ***p < 0.001. Representative colony morphologies are also shown (E and H).
(F–H) Same experiments as in (C)–(E) were performed, using adult bone marrow CD34+ cells. n.s., not significant.
Scale bars, 400 μm.
See also Figure S4.
SETDB2 Mediates Oncogenic Effects in E2A-PBX1+ ALL through Suppression of CDKN2C and Cell-Cycle Perturbation
To elucidate the oncogenic mechanism of SETDB2 in leukemia maintenance, global levels of H3K9me3, a silencing histone mark, were assessed by western blot and ChIP-seq after SETDB2 depletion in RCH-ACV cells. The results showed that global levels of H3K9me3 were not impacted by SETDB2 depletion (Figures 4A–4C), suggesting that the oncogenic mechanism of SETDB2 is likely mediated by more restricted effects on select target genes. Analysis of the transcriptomic dataset by gene set enrichment analysis (GSEA) showed that the expression of multiple cell-cycle-related gene sets was significantly enriched in SETDB2-depleted RCH-ACV versus control cells (Figure 4D; Figure S5A), implicating that cell-cycle-related genes are potential SETDB2 downstream targets. To identify potential direct targets of SETDB2, an integrative analysis of ChIP-seq and transcriptomic data was performed that identified a subset of genes (n = 27) whose H3K9me3 levels were reduced concomitantly with increased transcript levels following SETDB2 depletion (Figure 4E; Figure S5B). Notably, the gene for the cell-cycle inhibitor CDKN2C was one of the potential SETDB2 targets that met the selection criteria (Figure 4F).
Figure 4. Cell-Cycle-Related Genes Are Potential SETDB2 Downstream Targets.

(A) Western blot shows H3K9me3 levels in the indicated cells before and after SETDB2 knockdown.
(B and C) H3K9me3 levels as shown for genome-wide H3K9me3 ChIP-seq on SETDB2 knockdown or control cells. Number of mapped reads (B) and density heat map (C) are shown.
(D) GSEA plots are shown for indicated gene sets in SETDB2 knockdown versus control cells.
(E) H3K9me3 ChIP-seq profiles of a subset of potential SETDB2 target genes (n = 27) are shown for SETDB2 knockdown and control cells.
(F) Schematic illustration shows ChIP-seq peaks in CDKN2C locus.
See also Figure S5.
Given that multiple cell-cycle gene sets were associated with SETDB2 depletion, CDKN2C was investigated for its role in SETDB2-mediated E2A-PBX1+ leukemia development. ChIP-qPCR assay detected the binding of endogenous SETDB2 on the CDKN2C locus, confirming that CDKN2C is a direct target of SETDB2 (Figure 5A). ChIP-qPCR assays also confirmed the ChIP-seq data that shRNA-mediated SETDB2 depletion resulted in the reduction of H3K9me3 levels at the CDKN2C locus (Figure 5B). Conversely, exogenous overexpression of a SETDB2-GFP fusion protein increased the level of H3K9me3 on the CDKN2C locus (Figure 5C), which correlated with increased chromatin occupancy of SETDB2-GFP at CDKN2C (Figure 5D). In addition, depletion of SETDB2 or E2A-PBX1 substantially upregulated CDKN2C transcript levels (Figures 5E and 5F), demonstrating a strong dependency of CDKN2C repression on upstream E2A-PBX1-mediated signaling.
Figure 5. Oncogenic Mechanism for SETDB2 Role in Human Leukemia.

(A) Bar graph shows chromatin occupancy determined by ChIP-qPCR of endogenous SETDB2 in RCH-ACV and 697 cells.
(B and C) Bar graph shows H3K9me3 level determined by ChIP-qPCR after SETDB2 knockdown (B) or overexpression of exogeneous SETDB2 GFP-fusion protein (C) in RCH-ACV cells.
(D) Bar graph shows chromatin occupancy determined by ChIP-qPCR of exogenous SETDB2 GFP-fusion protein in RCH-ACV cells. NCAPD2 served as negative control.
(E and F) Bar graphs indicate CDKN2C expression levels in RCH-ACV and 697 cells after E2A-PBX1 (E) or SETDB2 (F) shRNA treatment.
(G and H) Flow cytometry plot (G) and bar graph (H) show results of BrdU/7-AAD staining to assess cell-cycle status by flow cytometry in RCH-ACV cells after SETDB2 or CDKN2C knockdown.
(I and J) Flow cytometry plot (I) and bar graph (J) show results of cell-cycle analysis for CDKN2C overexpression in RCH-ACV cells.
(K) Bar graph shows RCH-ACV cell proliferation status after exogenous SETDB2 or CDKN2C overexpression.
(L) Bar graph shows RCH-ACV proliferation status after overexpression of exogenous SETDB2 WT or SET domain deletion mutants. Data indicate mean ± SEM (n = 3). Statistical analysis was performed by Student t test. *p < 0.05; **p < 0.01; ***p < 0.001; n.s., not significant.
See also Figures S5 and S6.
Given the role of CDKN2C in cell-cycle regulation, the cell-cycle state was evaluated in leukemia cells following CDKN2C perturbations. Although there was no significant change in cell-cycle status following CDKN2C knockdown (Figures 5G and 5H), likely due to its low basal level of expression, exogenous overexpression of CDKN2C in RCH-ACV cells significantly induced growth arrest and apoptosis (Figures 5I and 5J), resulting in reduced cell proliferation (Figure 5K). These results phenocopy the loss of SETDB2 (Figures 5G and 5H) or E2A-PBX1 (Figures S5C and S5D) and indicate that SETDB2 serves a crucial role in regulating proliferation in E2A-PBX1+ ALL cells through direct regulation of CDKN2C. Furthermore, knockdown of CDKN2C significantly rescued the growth deficiency in E2A-PBX1- or SETDB2-depleted RCH-ACV cells, demonstrating that CDKN2C is an important downstream mediator of SETDB2 in E2A-PBX1+ leukemia (Figures S5E and S5F). By comparison, expression of the CDKN2A gene, which is also subordinate to E2A-PBX1, was not dependent on SETDB2 (Figures S6A and S6B), consistent with previous studies of an alternative suppressive mechanism involving BMI1 (Smith et al., 2003).
SETDB2 Depletion Enhances Sensitivity to Kinase and Epigenetic Inhibitors
Given the potential roles of targeted therapies in ALL, SETDB2 depletion was evaluated in combination with kinase or epigenetic inhibitors for potential therapeutic enhancement. Recent preclinical studies have suggested dasatinib, a multi-kinase inhibitor, as a candidate therapy in pre-BCR+ ALL (Duque-Afonso et al., 2015, 2016; Geng et al., 2015). Thus, it was tested in combination with SETDB2 depletion in RCH-ACV and 697 cells in dose-response assays. SETDB2 depletion increased dasatinib sensitivity in RCH-ACV and 697 cells, significantly reducing the half maximal inhibitory concentration (IC50) for dasatinib (Figures 6A and 6C). SETDB2 depletion also enhanced sensitivity to JQ1 (Figures 6B and 6D), a potent inhibitor of the BET family of bromodomain proteins that has broad activity in diverse acute leukemia subtypes (Da Costa et al., 2013; Zuber et al., 2011). These data suggest that targeting SETDB2 in combination with kinase or epigenetic inhibitors might provide improved therapeutic efficacy in E2A-PBX1+ preB-ALL.
Figure 6. SETDB2 Knockdown Increases Sensitivity to Kinase and Epigenetic Inhibitors.
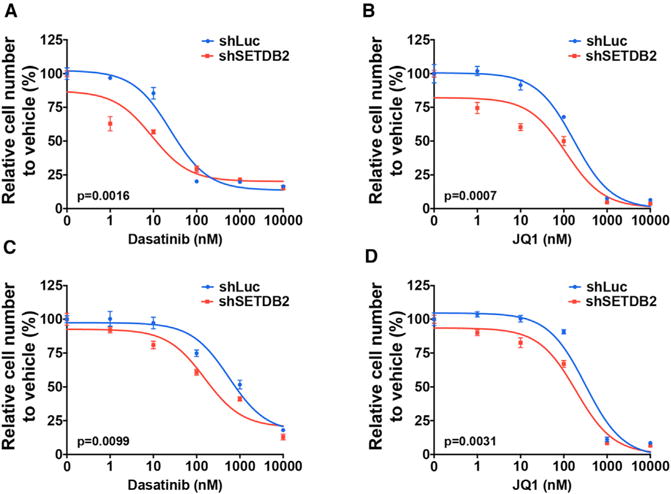
(A and C) Dose-response curves are shown for control or SETDB2 shRNA-treated RCH-ACV (A) and 697 (C) cells cultured in increasing concentrations of dasatinib. IC50 for dasatinib in combination with control or SETDB2 shRNA is 24.84 versus 9.23 nM (for RCH-ACV cells) and 560 versus 154 nM (for 697 cells), respectively.
(B and D) Dose-response curves are shown for control or SETDB2 shRNA-treated RCH-ACV (B) and 697 (D) cells cultured in increasing concentrations of JQ1. IC50 for JQ1 in combination with control or SETDB2 shRNA is 172.6 versus 112.5 nM (for RCH-ACV cells) and 316.4 versus 192.8 nM (for 697 cells), respectively.
DISCUSSION
In this study, we demonstrate an oncogenic role for the protein lysine methyl-transferase SETDB2 in leukemia pathogenesis. It is overexpressed in a subset of ALL with the pre-BCR+ phenotype and required for their maintenance in vitro and in vivo. In E2A-PBX1+ B-ALL, SETDB2 expression is maintained as a direct target gene of the chimeric transcription factor E2A-PBX1. In these leukemias, SETDB2 epigenetically suppresses expression of the cell-cycle inhibitor CDKN2C through histone H3K9 tri-methylation, thereby establishing an oncogenic pathway (E2A-PBX1 / SETDB2 / CDKN2C) subordinate to E2A-PBX1 in ALL. Our studies provide a strong rationale for the development of pharmacologic inhibitors and pre-clinical studies to further establish the efficacy of targeting SETDB2 therapeutically in leukemia.
The role of SETDB2 as a transcriptional silencing factor in leukemia is consistent with its contributions in various homeostatic processes. These include regulation of early embryonic development in zebrafish through epigenetic silencing of target genes (Du et al., 2014; Xu et al., 2010), and association with virus-induced susceptibility to bacteria superinfection by suppressing the inflammatory response through epigenetic inhibition of genes in the nuclear factor κB (NF-κB) signaling pathway (Schliehe et al., 2015). A potential role in cancer pathogenesis has been suggested by genomic sequencing studies (from The Cancer Genome Atlas; TCGA) revealing various mutations and copy number alterations of SETDB2 in a broad subset of cancers (Figure S4D). However, with the exception of a recent report characterizing the role of SETDB2 in a gastric cancer cell line (Nishikawaji et al., 2016), there has been no functional link with oncogenesis. Our studies provide this by demonstrating that SETDB2 overexpression sustains leukemogenesis based on multiple lines of evidence, including mechanistic studies and clinical data.
Through integration of ChIP-seq and transcriptomic datasets, we identified SETDB2 candidate target genes in E2A-PBX1+ cells based on the criterion that SETDB2 epigenetically silences subordinate genes by writing the H3K9me3 repressive histone mark. The most functionally significant of these target genes is CDKN2C, whose silencing is strongly linked to the oncogenic function of SETDB2 in E2A-PBX1+ cells to promote cell-cycle progression and leukemia cell proliferation. Of note, an additional CDK inhibitor gene (CDKN2A) is also silenced in E2A-PBX1+ leukemia cells, but through a different mechanism involving BMI1 (Smith et al., 2003). Thus, two distinct oncogenic pathways subordinate to E2A-PBX1 mediate silencing of major tumor suppressor genes to promote aberrant cell cycling (Figure S6C).
In addition to E2A-PBX1+ ALL, a broad cross-section of other leukemia subtypes, both ALL and AML, overexpress SETDB2 and show strong dependence on it for growth and proliferation both in vitro and in vivo (data not shown). However, most of these non-E2A-PBX1 cases do not display upregulation of CDKN2C following SETDB2 knockdown, suggesting oncogenic mechanisms based on alternative downstream target genes (data not shown). Indeed, the lack of overlap between SETDB2 targets identified in E2A-PBX1+ cells and those reported in mouse bone-marrow-derived macrophages (Schliehe et al., 2015), or a gastric cancer cell line (Nishikawaji et al., 2016), suggests that SETDB2 downstream targets are highly dependent on biological context, but the specific mechanisms for SETDB2 recruitment to the respective chromatin sites have not been determined. Furthermore, although SETDB2 has been shown to methylate substrate H3K9me2 peptide in vitro (Falandry et al., 2010), a recent report showed that SETDB2 can positively regulate specific targets independent of its H3K9me3 methyltransferase activity (Roqueta-Rivera et al., 2016). However, this does not appear to apply to the maintenance of leukemias, since several of our observations support a requirement for methyltransferase activity including the following: (1) H3K9me3 methylation state and expression of the CDKN2C gene were reciprocally modulated in parallel by changes in SETDB2 expression, (2) disruption of the SET domain by CRISPR caused deleterious effects, and (3) the functional consequences of SETDB2 overexpression on leukemia cell maintenance required its SET domain (Figure 5L). Since we identified SETDB2 targets based on H3K9me3 methylation state change, we cannot rule out the possibility that SETDB2 may function on non-histone substrates, like other protein lysine methyltransferases, in regulation of ALL leukemogenesis, which merits further investigation (Hamamoto et al., 2015; Rathert et al., 2008).
Overexpression and dependence on SETDB2 provide a rationale for its consideration as a therapeutic target for broad subtypes of leukemia, particularly E2A-PBX1+ preB-ALL. By comparison, hematopoietic stem cells (HSCs) and progenitors express much lower transcript levels than primary leukemias, consistent with their reduced sensitivity to SETDB2 depletion. The average median expression of SETDB2 in over 50 normal tissues (The Genotype-Tissue Expression Project; GTEx) (Figure S4A) is at least 6-fold lower than primary AML/ALL samples, suggesting a potential safe therapeutic index. In addition to targeting SETDB2 alone, its knockdown enhanced sensitivity to kinase and epigenetic inhibitors, suggesting a potential approach to future combination treatments. In conclusion, SETDB2 is a functionally important epigenetic regulator in pre-BCR+ ALL that should be further investigated as a candidate therapeutic target.
EXPERIMENTAL PROCEDURES
Bioinformatics and Data Analysis
RNA-seq libraries were constructed using Illumina’s TruSeq Stranded mRNA LT Kit and sequenced at Centrillion Genomics Technologies (http://www.centrilliontech.com). RAW fastq files were mapped by bowtie2 to the human hg19 genome assembly. Mapped (BAM) files were subjected to read counting using the R-Bioconductor package (GenomicAlignments: summarizeOverlaps function). The expression matrix (prior normalization) was then used for differential expression calculations and statistical modeling using the R-Bioconductor package (DESeq2). Sample-wise clustering and MA plots were generated by the R package “ape” and base function “plotMA.” Protein lysine methyltransferase family members were downloaded from the Gene Ontology database (amigo.geneontology.org), and heatmaps were generated using R function heatmap.2. Primary leukemia expression microarrays were accessed from GEO: GSE13204 (Haferlach et al., 2010). Raw microarray image processing, expression calling, and normalization were performed by the R-Bioconductor package “affy.” ChIP-seq samples were analyzed as follows: (1) Reads mapped by BWA to human genome assembly hg19; (2) peaks were called and differential peaks were analyzed using MAC2; (3) peaks were viewed by the genome browser integrative genomics viewer (IGV); and (4) density plots and heatmaps were generated using the program ngsplot. Normalized SETDB2 expression values (RPKM) of hematopoietic cells (HSCs, common myeloid progenitors [CMPs], and common lymphoid progenitors [CLPs]) and AML primary samples were downloaded from TCGA (https://tcga-data.nci.nih.gov/) and Blueprint (http://dcc.blueprint-epigenome.eu/#/home). Normal tissue expression was accessed from GTEx (https://www.gtexportal.org).
ChIP and Genomic qPCR
ChIP assays were performed as described elsewhere (Duque-Afonso et al., 2016). Briefly, cells were harvested and fixed with 1% fresh formaldehyde, and immune-complexes were precipitated using anti-SETDB2 (M17, Abnova) or anti-H3K9me3 antibody (ab8898, Abcam) with Protein G Dynabeads (10003D, Invitrogen) or GFP-Trap magnetic beads (gtma-20 and bmab-30, ChromoTek). Real-time qPCR was performed on the precipitated DNA using primers flanking the SETDB2, CDKN2C, IGLL1, IgH Eu, and NCAPD2 genes. Previously published ChIP-seq peaks for E2A-PBX1 were chosen for validation as controls (Geng et al., 2015). The relative values to input were determined using SYBR Green. Primers are listed in Table S1.
Real-Time qPCR
RNA was isolated using TRIzol Reagent, and cDNA was synthesized using iScript Reverse Transcription Supermix (Bio-Rad) following the manufacturer’s recommendations. qPCR analysis was performed using a CFX384 real-time PCR system (Bio-Rad) with TaqMan Master Mix and primers (Applied Biosystems). All signals were quantified using the ΔCt method and were normalized to the level of Actb. TaqMan probes used in real-time PCR are provided in Table S2.
Cell Culture
293T and Phoenix cells were cultured in DMEM supplemented with 10% fetal bovine serum (FBS), 100 U/mL penicillin/streptomycin, and 0.29 mg/mL L-glutamine. Human leukemia cell lines were cultured in RPMI 1640 medium supplemented with 10% FBS, 100 U/mL penicillin/streptomycin, and 0.29 mg/mL L-glutamine. HSPCs were isolated from fresh human umbilical cord blood or bone marrow obtained from the Stanford Hospital using Ficoll-Paque Plus (GE Healthcare Life Sciences), followed by the EasySep Human CD34+ Selection or Progenitor Enrichment Kit (STEMCELL Technologies) to obtain enrichment >90%. Following isolation, cells were maintained in serum-free StemSpan II media (STEMCELL Technologies) supplemented with cytokines (PeproTech: stem cell factor [SCF], thrombopoietin [TPO], Flt3L, interleukin [IL]-6, IL-3 [100 ng/mL each]; Cellagen Technology: StemRegenin1 [SR1; 0.75 μM]) (Buechele et al., 2015).
shRNA Design, Lentivirus Generation, and Cell Transduction
shRNAs were designed using a commercial web tool (Invitrogen). Individual shRNA sequences (Table S3) were cloned into a p309-mCherry, p309-GFP (Bassik et al., 2013; Matheny et al., 2013), or pSicoR-mCherry (Ventura et al., 2004) lentiviral vector. Lentivirus generation and transduction of human leukemia cells are described elsewhere (Wong et al., 2015). The sorted mCherry+ cells were cultured for 7 days for colony-forming assay or used in bone marrow transplantation experiments.
Expression Vector Construction and Retrovirus Preparation
E2A-PBX1, SETDB2, and CDKN2C cDNAs fused with GFP were generated by the In-Fusion cloning system (Clontech Laboratories) and cloned into pMSCV-puro vector (Clontech). SETDB2 cDNA was obtained from GE Healthcare Life Sciences (clone MHS6278-202808172). Retrovirus generation and transduction of human leukemia cells are described elsewhere (Wong et al., 2015). Briefly, retrovirus was packaged in Phoenix-Eco cells, and RCH-ACV cells expressing ecotropic receptor were used for transduction by spinoculation (2,500 rpm, 32°C, for 2.5 hr). GFP+ cells were sorted by FACS 3 days after transduction.
sgRNA Construction and Validation
The pL-CRISPR.EFS.GFP lentiviral vector (#57818, Addgene) was used for the construction of sgRNA expression vectors (Heckl et al., 2014). sgRNA sequences targeting the SET1 or SET2 domain of SETDB2 were selected from the Gecko v2 database and listed in Table S4. GFP+ cells were sorted and mixed 50/50 with untransduced cells for cell proliferation assay. Indel frequency was analyzed by Sanger sequencing and T7 endonuclease assay using primers listed in Table S5.
Colony-Forming Assays
Human leukemia cells, cord blood CD34+ cells, or adult bone marrow CD34+ cells (obtained with informed consent and Stanford University Institutional Review Board approval) were transduced with shRNAs against the gene of interest or luciferase (control), followed by cell sorting after 4 days. mCherry+ human leukemia cells (2,000 cells per well) were cultured in methylcellulose medium (H4230, STEMCELL Techonologies). Colonies were counted after 7 days. mCherry+ cord blood CD34+ cells or adult bone marrow CD34+ cells (10,000 cells per well) were cultured in Methocult H4230 methylcellulose medium (STEMCELL Technologies) supplemented with SCF, TPO, Flt3L, IL-6, IL-3 (100 ng/mL each), and SR1 (0.75 mM) (Buechele et al., 2015). Colonies were counted after 10 days.
Transplantation Assays
Transplantation assays were performed as previously described (Wong et al., 2015). RCH-ACV human leukemia cells were transduced with control (shLuc) or SETDB2 (shSETDB2) shRNA lentivirus with mCherry fluorescence reporter by spinoculation. After 72 hr, sorted mCherry+ cells in 0.2 mL PBS containing 0.5% FBS were transplanted into sublethally irradiated (200 rad) NOD.Cg-Prkdcscid Il2rgtm1Wjl/SzJ (NSG) mice (8–10 weeks old). All experiments on mice in this study were performed with the approval of, and in accordance with, the Stanford University Panel on Laboratory Animal Care.
Cell-Cycle Analysis
Bromodeoxyuridine (BrdU)/7-AAD incorporation assays were performed according to the manufacturer’s protocol (#559619, BD Pharmingen). BrdU incorporation (APC [allophycocyanin]- or FITC [fluorescein isothiocyanate]-labeled anti-BrdU antibodies) was measured with DNA content (7-ADD) in fixed and permeabilized cells.
Western Blot Analysis
Acid-extracted nuclear protein fractions were used for western blots to detect histone modifications (Wong et al., 2015). The blots were reacted with primary antibodies specific to histone H3 (ab1791, Abcam), histone H3K9me3 (ab8898, Abcam), GAPDH (G9545, Sigma-Aldrich), α-tubulin (A01410-40, GenScript), S-Tag (A190-135A, Bethyl Laboratories), SETDB2 (M17, Abnova), or E2A (3C6, monoclonal antibody specific for E2A) (Jacobs et al., 1993), followed by peroxidase-conjugated secondary antibodies. Membranes were then incubated with ECL Western Blot Detection kits (GE Healthcare), and images were detected by exposure to X-ray film.
Luciferase Reporter Assay
The Dual Luciferase Reporter Assay system (Promega) was used according to the user’s manual. Promoter regions of NCAPD2, SETDB2, and immunoglobulin H (IgH) Eu were cloned into pGL3-basic vector, a Firefly luciferase reporter vector, using primers listed in Table S6. The reporter constructs and E2A-PBX1 expression vector, together with the pRL-SV40 vector, a Renilla luciferase control reporter vector, were transfected into 293T cells. Cells were harvested 48 hr after transfection and lysed with passive lysis buffer (Promega). Luciferase activity was measured with the Glomax 20/20 Luminometer (Promega) and normalized to Renilla luciferase activity.
Supplementary Material
Highlights.
SETDB2 is overexpressed in pre-BCR+ acute lymphoblastic leukemias
SETDB2 is a direct target gene of the E2A-PBX1 chimeric oncoprotein
SETDB2 mediates chromatin suppression of CDKN2C in E2A-PBX1+ ALL
Depletion of SETDB2 sensitizes ALL cells to kinase and epigenetic inhibitors
Acknowledgments
We thank Cita Nicolas and Maria Ambrus for technical assistance, Ziming Weng for support on ChIP sequencing, Dr. Michael C. Bassik for providing p309-mCherry vector, and members of the Cleary laboratory for helpful discussions. We also acknowledge the Stanford Pediatrics Heme/Onc Division Tissue Bank and patients for providing clinical samples. This work was supported in part by grants from the William Lawrence and Blanche Hughes Foundation (to M.L.C.), Alex’s Lemonade Stand Foundation for Childhood Cancer (to S.H.-K.W.), the Child Health Research Institute, Lucile Packard Foundation for Children’s Health, and Stanford CTSA (UL1 TR001085) (to M.L.C., C.-H.L., and J.D.-A.), Dr. Mildred Scheel Fellowship of German Cancer Aid (to C.S.), and the German Research Foundation (Deutsche Forschungsgemeinschaft, ref. DU 1287/2-1 and 1287/3-1) (to J.D.-A.).
Footnotes
DATA AND SOFTWARE AVAILABILITY
The accession number for the RNA-seq and ChIP-seq data reported in this paper is GEO: GSE102947.
SUPPLEMENTAL INFORMATION
Supplemental Information includes six figures and six tables and can be found with this article online at https://doi.org/10.1016/j.celrep.2018.03.124.
AUTHOR CONTRIBUTIONS
C.-H.L., S.H.-K.W., and M.L.C. developed the hypothesis and wrote the manuscript. C.-H.L., S.H.-K.W., and J.H.K. designed and performed experiments and analyzed data. S.H.-K.W. conducted detailed bioinformatics analyses. C.S. and J.J. provided human cord blood and bone marrow cells. M.C.W. provided human patient samples. J.D.-A. advised on experimental design and manuscript preparation. X.F. assisted with the reporter assays.
DECLARATION OF INTERESTS
The authors declare no competing interests.
References
- Armstrong SA, Look AT. Molecular genetics of acute lymphoblastic leukemia. J Clin Oncol. 2005;23:6306–6315. doi: 10.1200/JCO.2005.05.047. [DOI] [PubMed] [Google Scholar]
- Bassik MC, Kampmann M, Lebbink RJ, Wang S, Hein MY, Poser I, Weibezahn J, Horlbeck MA, Chen S, Mann M, et al. A systematic mammalian genetic interaction map reveals pathways underlying ricin susceptibility. Cell. 2013;152:909–922. doi: 10.1016/j.cell.2013.01.030. [DOI] [PMC free article] [PubMed] [Google Scholar]
- Bernt KM, Zhu N, Sinha AU, Vempati S, Faber J, Krivtsov AV, Feng Z, Punt N, Daigle A, Bullinger L, et al. MLL-rearranged leukemia is dependent on aberrant H3K79 methylation by DOT1L. Cancer Cell. 2011;20:66–78. doi: 10.1016/j.ccr.2011.06.010. [DOI] [PMC free article] [PubMed] [Google Scholar]
- Borowitz MJ, Hunger SP, Carroll AJ, Shuster JJ, Pullen DJ, Steuber CP, Cleary ML. Predictability of the t(1;19)(q23;p13) from surface antigen phenotype: implications for screening cases of childhood acute lymphoblastic leukemia for molecular analysis: a Pediatric Oncology Group study. Blood. 1993;82:1086–1091. [PubMed] [Google Scholar]
- Buechele C, Breese EH, Schneidawind D, Lin CH, Jeong J, Duque-Afonso J, Wong SH, Smith KS, Negrin RS, Porteus M, Cleary ML. MLL leukemia induction by genome editing of human CD34+ hematopoietic cells. Blood. 2015;126:1683–1694. doi: 10.1182/blood-2015-05-646398. [DOI] [PMC free article] [PubMed] [Google Scholar]
- Cai SF, Chen CW, Armstrong SA. Drugging chromatin in cancer: recent advances and novel approaches. Mol Cell. 2015;60:561–570. doi: 10.1016/j.molcel.2015.10.042. [DOI] [PMC free article] [PubMed] [Google Scholar]
- Cancer Genome Atlas Research Network et al. Genomic and epigenomic landscapes of adult de novo acute myeloid leukemia. N Engl J Med. 2013;368:2059–2074. doi: 10.1056/NEJMoa1301689. [DOI] [PMC free article] [PubMed] [Google Scholar]
- Da Costa D, Agathanggelou A, Perry T, Weston V, Petermann E, Zlatanou A, Oldreive C, Wei W, Stewart G, Longman J, et al. BET inhibition as a single or combined therapeutic approach in primary paediatric B-precursor acute lymphoblastic leukaemia. Blood Cancer J. 2013;3:e126. doi: 10.1038/bcj.2013.24. [DOI] [PMC free article] [PubMed] [Google Scholar]
- Dawson MA, Kouzarides T. Cancer epigenetics: from mechanism to therapy. Cell. 2012;150:12–27. doi: 10.1016/j.cell.2012.06.013. [DOI] [PubMed] [Google Scholar]
- Diakos C, Xiao Y, Zheng S, Kager L, Dworzak M, Wiemels JL. Direct and indirect targets of the E2A-PBX1 leukemia-specific fusion protein. PLoS ONE. 2014;9:e87602. doi: 10.1371/journal.pone.0087602. [DOI] [PMC free article] [PubMed] [Google Scholar]
- Du TT, Xu PF, Dong ZW, Fan HB, Jin Y, Dong M, Chen Y, Pan WJ, Ren RB, Liu TX, et al. Setdb2 controls convergence and extension movements during zebrafish gastrulation by transcriptional regulation of dvr1. Dev Biol. 2014;392:233–244. doi: 10.1016/j.ydbio.2014.05.022. [DOI] [PubMed] [Google Scholar]
- Duque-Afonso J, Feng J, Scherer F, Lin CH, Wong SH, Wang Z, Iwasaki M, Cleary ML. Comparative genomics reveals multistep pathogenesis of E2A-PBX1 acute lymphoblastic leukemia. J Clin Invest. 2015;125:3667–3680. doi: 10.1172/JCI81158. [DOI] [PMC free article] [PubMed] [Google Scholar]
- Duque-Afonso J, Lin CH, Han K, Wei MC, Feng J, Kurzer JH, Schneidawind C, Wong SH, Bassik MC, Cleary ML. E2A-PBX1 remodels oncogenic signaling networks in B-cell precursor acute lymphoid leukemia. Cancer Res. 2016;76:6937–6949. doi: 10.1158/0008-5472.CAN-16-1899. [DOI] [PMC free article] [PubMed] [Google Scholar]
- Falandry C, Fourel G, Galy V, Ristriani T, Horard B, Bensimon E, Salles G, Gilson E, Magdinier F. CLLD8/KMT1F is a lysine methyltransferase that is important for chromosome segregation. J Biol Chem. 2010;285:20234–20241. doi: 10.1074/jbc.M109.052399. [DOI] [PMC free article] [PubMed] [Google Scholar]
- Feldman BJ, Hampton T, Cleary ML. A carboxy-terminal deletion mutant of Notch1 accelerates lymphoid oncogenesis in E2A-PBX1 transgenic mice. Blood. 2000;96:1906–1913. [PubMed] [Google Scholar]
- Geng H, Hurtz C, Lenz KB, Chen Z, Baumjohann D, Thompson S, Goloviznina NA, Chen WY, Huan J, LaTocha D, et al. Self-enforcing feedback activation between BCL6 and pre-B cell receptor signaling defines a distinct subtype of acute lymphoblastic leukemia. Cancer Cell. 2015;27:409–425. doi: 10.1016/j.ccell.2015.02.003. [DOI] [PMC free article] [PubMed] [Google Scholar]
- Gilan O, Lam EY, Becher I, Lugo D, Cannizzaro E, Joberty G, Ward A, Wiese M, Fong CY, Ftouni S, et al. Functional interdependence of BRD4 and DOT1L in MLL leukemia. Nat Struct Mol Biol. 2016;23:673–681. doi: 10.1038/nsmb.3249. [DOI] [PubMed] [Google Scholar]
- Haferlach T, Kohlmann A, Wieczorek L, Basso G, Kronnie GT, Béné MC, De Vos J, Hernández JM, Hofmann WK, Mills KI, et al. Clinical utility of microarray-based gene expression profiling in the diagnosis and subclassification of leukemia: report from the International Microarray Innovations in Leukemia Study Group. J Clin Oncol. 2010;28:2529–2537. doi: 10.1200/JCO.2009.23.4732. [DOI] [PMC free article] [PubMed] [Google Scholar]
- Hamamoto R, Saloura V, Nakamura Y. Critical roles of non-histone protein lysine methylation in human tumorigenesis. Nat Rev Cancer. 2015;15:110–124. doi: 10.1038/nrc3884. [DOI] [PubMed] [Google Scholar]
- Heckl D, Kowalczyk MS, Yudovich D, Belizaire R, Puram RV, McConkey ME, Thielke A, Aster JC, Regev A, Ebert BL. Generation of mouse models of myeloid malignancy with combinatorial genetic lesions using CRISPR-Cas9 genome editing. Nat Biotechnol. 2014;32:941–946. doi: 10.1038/nbt.2951. [DOI] [PMC free article] [PubMed] [Google Scholar]
- Jacobs Y, Vierra C, Nelson C. E2A expression, nuclear localization, and in vivo formation of DNA- and non-DNA-binding species during B-cell development. Mol Cell Biol. 1993;13:7321–7333. doi: 10.1128/mcb.13.12.7321. [DOI] [PMC free article] [PubMed] [Google Scholar]
- Logue JS, Morrison DK. Complexity in the signaling network: insights from the use of targeted inhibitors in cancer therapy. Genes Dev. 2012;26:641–650. doi: 10.1101/gad.186965.112. [DOI] [PMC free article] [PubMed] [Google Scholar]
- Matheny CJ, Wei MC, Bassik MC, Donnelly AJ, Kampmann M, Iwasaki M, Piloto O, Solow-Cordero DE, Bouley DM, Rau R, et al. Next-generation NAMPT inhibitors identified by sequential high-throughput phenotypic chemical and functional genomic screens. Chem Biol. 2013;20:1352–1363. doi: 10.1016/j.chembiol.2013.09.014. [DOI] [PMC free article] [PubMed] [Google Scholar]
- McWhirter JR, Neuteboom ST, Wancewicz EV, Monia BP, Downing JR, Murre C. Oncogenic homeodomain transcription factor E2A-Pbx1 activates a novel WNT gene in pre-B acute lymphoblastoid leukemia. Proc Natl Acad Sci USA. 1999;96:11464–11469. doi: 10.1073/pnas.96.20.11464. [DOI] [PMC free article] [PubMed] [Google Scholar]
- Moorman AV, Harrison CJ, Buck GA, Richards SM, Secker-Walker LM, Martineau M, Vance GH, Cherry AM, Higgins RR, Fielding AK, et al. Adult Leukaemia Working Party, Medical Research Council/National Cancer Research Institute Karyotype is an independent prognostic factor in adult acute lymphoblastic leukemia (ALL): analysis of cytogenetic data from patients treated on the Medical Research Council (MRC) UKALLXII/ Eastern Cooperative Oncology Group (ECOG) 2993 trial. Blood. 2007;109:3189–3197. doi: 10.1182/blood-2006-10-051912. [DOI] [PubMed] [Google Scholar]
- Nishikawaji T, Akiyama Y, Shimada S, Kojima K, Kawano T, Eishi Y, Yuasa Y, Tanaka S. Oncogenic roles of the SETDB2 histone methyltransferase in gastric cancer. Oncotarget. 2016;7:67251–67265. doi: 10.18632/oncotarget.11625. [DOI] [PMC free article] [PubMed] [Google Scholar]
- Nourse J, Mellentin JD, Galili N, Wilkinson J, Stanbridge E, Smith SD, Cleary ML. Chromosomal translocation t(1;19) results in synthesis of a homeobox fusion mRNA that codes for a potential chimeric transcription factor. Cell. 1990;60:535–545. doi: 10.1016/0092-8674(90)90657-z. [DOI] [PubMed] [Google Scholar]
- Pui CH, Evans WE. Treatment of acute lymphoblastic leukemia. N Engl J Med. 2006;354:166–178. doi: 10.1056/NEJMra052603. [DOI] [PubMed] [Google Scholar]
- Pui CH, Sandlund JT, Pei D, Campana D, Rivera GK, Ribeiro RC, Rubnitz JE, Razzouk BI, Howard SC, Hudson MM, et al. Total Therapy Study XIIIB at St Jude Children’s Research Hospital Improved outcome for children with acute lymphoblastic leukemia: results of Total Therapy Study XIIIB at St Jude Children’s Research Hospital. Blood. 2004;104:2690–2696. doi: 10.1182/blood-2004-04-1616. [DOI] [PubMed] [Google Scholar]
- Rathert P, Dhayalan A, Murakami M, Zhang X, Tamas R, Jurkowska R, Komatsu Y, Shinkai Y, Cheng X, Jeltsch A. Protein lysine methyltransferase G9a acts on non-histone targets. Nat Chem Biol. 2008;4:344–346. doi: 10.1038/nchembio.88. [DOI] [PMC free article] [PubMed] [Google Scholar]
- Roqueta-Rivera M, Esquejo RM, Phelan PE, Sandor K, Daniel B, Foufelle F, Ding J, Li X, Khorasanizadeh S, Osborne TF. SETDB2 links glucocorticoid to lipid metabolism through Insig2a regulation. Cell Metab. 2016;24:474–484. doi: 10.1016/j.cmet.2016.07.025. [DOI] [PMC free article] [PubMed] [Google Scholar]
- Sakamoto KM, Grant S, Saleiro D, Crispino JD, Hijiya N, Giles F, Platanias L, Eklund EA. Targeting novel signaling pathways for resistant acute myeloid leukemia. Mol Genet Metab. 2015;114:397–402. doi: 10.1016/j.ymgme.2014.11.017. [DOI] [PMC free article] [PubMed] [Google Scholar]
- Schliehe C, Flynn EK, Vilagos B, Richson U, Swaminanthan S, Bosnjak B, Bauer L, Kandasamy RK, Griesshammer IM, Kosack L, et al. The methyltransferase Setdb2 mediates virus-induced susceptibility to bacterial superinfection. Nat Immunol. 2015;16:67–74. doi: 10.1038/ni.3046. [DOI] [PMC free article] [PubMed] [Google Scholar]
- Smith KS, Chanda SK, Lingbeek M, Ross DT, Botstein D, van Lohuizen M, Cleary ML. Bmi-1 regulation of INK4A-ARF is a downstream requirement for transformation of hematopoietic progenitors by E2a-Pbx1. Mol Cell. 2003;12:393–400. doi: 10.1016/s1097-2765(03)00277-6. [DOI] [PubMed] [Google Scholar]
- Ventura A, Meissner A, Dillon CP, McManus M, Sharp PA, Van Parijs L, Jaenisch R, Jacks T. Crelox-regulated conditional RNA interference from transgenes. Proc Natl Acad Sci USA. 2004;101:10380–10385. doi: 10.1073/pnas.0403954101. [DOI] [PMC free article] [PubMed] [Google Scholar]
- Wong SH, Goode DL, Iwasaki M, Wei MC, Kuo HP, Zhu L, Schneidawind D, Duque-Afonso J, Weng Z, Cleary ML. The H3K4-methyl epigenome regulates leukemia stem cell oncogenic potential. Cancer Cell. 2015;28:198–209. doi: 10.1016/j.ccell.2015.06.003. [DOI] [PMC free article] [PubMed] [Google Scholar]
- Xu PF, Zhu KY, Jin Y, Chen Y, Sun XJ, Deng M, Chen SJ, Chen Z, Liu TX. Setdb2 restricts dorsal organizer territory and regulates left-right asymmetry through suppressing fgf8 activity. Proc Natl Acad Sci USA. 2010;107:2521–2526. doi: 10.1073/pnas.0914396107. [DOI] [PMC free article] [PubMed] [Google Scholar]
- Zhu L, Li Q, Wong SH, Huang M, Klein BJ, Shen J, Ikenouye L, Onishi M, Schneidawind D, Buechele C, et al. ASH1L links histone H3 lysine 36 dimethylation to MLL leukemia. Cancer Discov. 2016;6:770–783. doi: 10.1158/2159-8290.CD-16-0058. [DOI] [PMC free article] [PubMed] [Google Scholar]
- Zuber J, Shi J, Wang E, Rappaport AR, Herrmann H, Sison EA, Magoon D, Qi J, Blatt K, Wunderlich M, et al. RNAi screen identifies Brd4 as a therapeutic target in acute myeloid leukaemia. Nature. 2011;478:524–528. doi: 10.1038/nature10334. [DOI] [PMC free article] [PubMed] [Google Scholar]
Associated Data
This section collects any data citations, data availability statements, or supplementary materials included in this article.