

Summary
This study demonstrates that endocrine-disrupting chemicals such as bisphenol A (BPA) can increase epidermal growth factor receptor (EGFR) activation and enhanced proliferative signaling in estrogen receptor-negative inflammatory breast cancer cells. BPA also attenuated the anti-growth effect of a clinically utilized EGFR inhibitor.
Abstract
Emerging evidence from epidemiological studies suggests a link between environmental chemical exposure and progression of aggressive breast cancer subtypes. Of all clinically distinct types of breast cancers, the most lethal phenotypic variant is inflammatory breast cancer (IBC). Overexpression of epidermal growth factor receptors (EGFR/HER2) along with estrogen receptor (ER) negativity is common in IBC tumor cells, which instead of a solid mass present as rapidly proliferating diffuse tumor cell clusters. Our previous studies have demonstrated a role of an adaptive response of increased antioxidants in acquired resistance to EGFR-targeting drugs in IBC. Environmental chemicals are known to induce oxidative stress resulting in perturbations in signal transduction pathways. It is therefore of interest to identify chemicals that can potentiate EGFR mitogenic effects in IBC. Herein, we assessed in ER-negative IBC cells a subset of chemicals from the EPA ToxCast set for their effect on EGFR activation and in multiple cancer phenotypic assays. We demonstrated that endocrine-disrupting chemicals such as bisphenol A (BPA) and 2,2-bis(p-hydroxyphenyl)-1,1,1-trichloroethane can increase EGFR/ERK signaling. BPA also caused a corresponding increase in expression of SOD1 and anti-apoptotic Bcl-2, key markers of antioxidant and anti-apoptotic processes. BPA potentiated clonogenic growth and tumor spheroid formation in vitro, reflecting IBC-specific pathological characteristics. Furthermore, we identified that BPA was able to attenuate the inhibitory effect of an EGFR targeted drug in a longer-term anchorage-independent growth assay. These findings provide a potential mechanistic basis for environmental chemicals such as BPA in potentiating a hyperproliferative and death-resistant phenotype in cancer cells by activating mitogenic pathways to which the tumor cells are addicted for survival.
Introduction
Inflammatory breast cancer (IBC) is the most aggressive form of breast cancer with one of the worst survival outcomes (1). IBC pathobiology is also distinct wherein local recurrence and distant metastasis are characterized by the formation of tumor cell clusters/spheroids, termed tumor emboli, which have a propensity for lymphatic invasion and dissemination (2). IBC resembles high-grade non-IBC, with IBC tumors exhibiting all receptor (EGFR, HER2, ER, PR) and molecular subtypes (e.g. luminal, basal/triple negative) detected in non-IBC. IBC is considered a health disparity as it disproportionately affects younger women, often during childbearing years, and minority populations (3). Emerging evidence in epidemiological studies, the NCI Surveillance, Epidemiology, and End Results Program (SEER), and reported geographic cancer clusters link environmental chemical exposure to the emergence and progression of aggressive cancer subtypes such as IBC (4–7). Although the data or cases studied are not robust enough to point to the identity of a single toxicant, oral contraceptives/hormone replacement therapy, pregnancy history and specific work-related environmental exposures have been postulated to contribute to the accelerated development of aggressive IBC tumors (5,6). IBC has a short latent period of rapid proliferation and dissemination (2) and therefore provides a unique model to study mechanisms of environmental chemical exposure on cancer progression. Studies from our lab and others conducting comparative evaluations using IBC and non-IBC patient tumor tissue have revealed unique gene signatures specific to IBC tumors (8–10). In particular, hyperactivation of mitogen-activated protein kinases (MAPK/ERK) is predominantly observed in IBC compared with non-IBC tumors. This correlates with high frequency of epidermal growth factor receptor (EGFR and/or ErbB2) overexpression, which potentially leads to the ER independence as well as increased activation of nuclear factor-kappaB (NF-κB) and its target genes in IBC (11,12). Therefore, drugs targeting EGFR/HER2 signaling such as lapatinib are combined with radiation and chemotherapy followed by surgery for the treatment of IBC patients. However, drug resistance is rapid and frequent with a ~50% lower 5-year survival rate relative to other advanced breast cancer subtypes (1). Therefore, we postulate that exogenous factors such as environmental chemicals can activate specific mitogenic signaling pathways, particularly those found to be important in IBC tumors (e.g. EGFR, ER and NF-κB) leading to rapid progression and drug resistance.
Through the use of multiple signaling, cell growth and phenotypic assays, we identified two endocrine-disrupting chemicals, bisphenol A (BPA) and 2,2-bis(p-hydroxyphenyl)-1,1,1-trichloroethane (HPTE), that increase proliferative signaling and promote growth of IBC cells providing a potential link to the epidemiological observations. Further, our mechanistic studies showed that the effect of BPA on proliferation was attenuated through inhibition of the EGFR/ERK signaling axis. As an extension to this observation, we identified the ability of BPA to reverse the growth inhibitory effects of a targeted EGFR inhibitor and approved anticancer agent in a long-term assay that is predictive of in vivo behavior, underscoring a role of BPA in drug resistance.
Materials and methods
Cell lines and reagents
The SUM149 (EGFR activated, triple negative) and SUM190 (HER2 overexpressing, ER/PR negative) IBC lines were obtained from Asterand, Inc. (Detroit, MI), derived from primary tumors of untreated IBC patients and cultured per manufacturer’s instructions as described previously (13). SUM149 and SUM190 cells were characterized by Asterand using short tandem repeat polymorphism analysis. The human breast cancer cell lines, MCF-7 and T47D, were purchased from the American Type Culture Collection (Rockville, MD) and cultured per their instructions. rSUM149 cells were generated in our laboratory from SUM149 cells and cultured in a manner similar to SUM149 cells with 7.5 μM GW583340 (see below) added a day after splitting for each passage as described previously (13). MCF-7, T47D and rSUM149 cells were authenticated using short tandem repeat polymorphism analysis by the Duke DNA sequencing core prior to their use for this study, banked upon receipt and all cell lines were cultured for no more than 6 months during this study. All cell lines were cultured with 1% penicillin/streptomycin (Invitrogen) supplemented in their respective media. Cells were cultured in growth medium at 37°C under an atmosphere of 5% CO2. Dr Keith Houck at the US EPA (Durham, NC) kindly provided the ToxCast Phase I set (96-well plate format as 20 mM stock concentrations in dimethyl sulfoxide), which contained all environmental chemicals studied in this work (14). EGFR inhibitor GW583340, a research-grade analog of lapatinib (13,15), was obtained from Tocris (Minneapolis, MN) and will be referred to throughout the article as an EGFR inhibitor.
Selection of environmental chemicals for study
The ToxCast I dataset (United States Environmental Protection Agency) (309 chemicals) was mined for select target activity assays (14) for pathways that generally converge on extracellular signal-regulated kinase (ERK/MAPK) signaling, found to be hyperactivated in advanced breast cancers such as IBC (10). These include ToxCast activity assay datasets (http://www.epa.gov/ncct/toxcast/data.html) related to the EGFR (BSK_hDFCGF_EGFR_up, BSK_hDFCGF_EGFR_down, NVS_ENZ_hAKT1), estrogen receptor (ER) (ATG_ERa_TRANS, ATG_ERE_CIS, NCGC_ERalpha_Agonist) and NF-κB/oxidative stress pathways (ATG_NF_kB_CIS, HUVEC_PBMC_LPS_24_TNF_alpha_down, Cellumen Phospho-H2AX_24hr) (11,13,15,16). Compounds that exhibited activity with AC50 < 10 μM in any of these assays were identified as potentially relevant candidates (as shown in Supplementary Table 1, available at Carcinogenesis Online). Further downselection occurred by excluding any duplicates with the selection of six chemicals representative of different activity pathways and real-world applications.
High-throughput cell cytotoxicity/proliferation
This was assessed by 3-(4,5-dimethylthiazol-2-yl)-2,5 diphenyl tetrazolium bromide (MTT) assay based on the conversion of MTT into formazan crystals by living cells, which determines metabolic activity and is widely used as a measure of the number of viable, proliferating cells. The high-throughput protocol in a 96-well plate format was carried out as previously described, with cells seeded (SUM149/rSUM149/MCF-7: 4000 cells/well; SUM190: 6000 cells/well), grown for 24 h, then treated as indicated and assessed for proliferation at indicated time points (17).
High-throughput multiparametric high-content assay
Cells were seeded in 96-well plates at 2000 cells/well and treated with chemicals as indicated. After 72 h incubation, 90 μl/well of treatment medium was removed from each well, followed by addition of 60 μl/well of pre-warmed dye cocktail in phosphate-buffered saline (PBS) (10 μg/ml Hoechst 33342 alone or in combination with 100 nM YOYO-1) for live-imaging combined with quantitative multiparametric analysis of cell morphology. Plates were incubated for 45 min, followed by removal of 60 μl of dye cocktail per well, and addition of 200 μl warmed PBS. Cells were fixed by removing 200 μl PBS and adding 60 μl 10% formalin for 15 min at room temperature, protected from light. Sixty microliter of formalin was then replaced with 200 μl of PBS prior to sealing the plates and imaging.
Fluorescence quantification was determined using a ThermoFisher CellInsight NXT and three-channel Cell Health Profiling protocol in HCS Screen software (ThermoFisher Scientific, Waltham, MA). Excitation wavelengths were 386 and 485 nm for Hoechst 33342 and YOYO-1, respectively. Fixed exposure times were optimized in each channel for each experiment and set so that camera pixel intensity saturation was not reached. Images were acquired using an Olympus UPlanFLN 10X/0.30 objective and 2 × 2 camera binning. A nuclear mask was established using channel 1 signaling (Hoechst 33342) and used to determine nuclear characteristics (nuclear count, size, aspect ratio and texture), as well as establishing the regions of interest for YOYO-1 (area inside nuclear mask; channel 2 mean average intensity) (18).
Immunoblot analysis
Cells were seeded into six-well plates at 75000 cells/well and harvested at indicated times (30 min or 24 h) post-treatment. Western immunoblot analysis was carried out as described previously (15). Membranes were incubated at 4°C overnight with primary antibodies ERK, pERK, EGFR, pEGFR, SOD1 (CST—1:1000 dilution), GPER/GPR30 (Santa Cruz Biotechnology, Dallas, TX—1:1000 dilution) or GAPDH (1:2000 dilution). Membranes were washed and incubated with anti-mouse or anti-rabbit HRP-conjugated antibodies (CST) for 1 h at room temperature. Chemiluminescent substrate (ThermoFisher Scientific) was applied for 5 min, and membranes were exposed to radiographic film. Densitometric analysis was performed using NIH ImageJ software. GAPDH was used as a loading control and numbers represent densitometric analysis of phospho to total protein and total protein relative to GAPDH, with all values normalized to the untreated lanes.
Colony formation assay
Cells were plated at 250 cells/well in triplicate in six-well plates, incubated overnight and then treated with indicated chemicals. After 24 h, the cells were washed with PBS, and fresh media was added. The cells were allowed to grow for 5–14 days, changing media every 4–5 days, and colonies formed were counted and assess for area using a ColCount (Oxford Optronix, Abingdon, UK) as described previously (19).
3D tumor spheroid growth assay
Cells were plated at 2500 cells/well in 24-well ultra-low attachment plates (Corning Inc., Corning, NY) using ultra-low attachment media [serum-free minimum essential medium supplemented with 20 ng/ml basic-fibroblast growth factor, 20 ng/ml epidermal growth factor and 1× B27 supplement (ThermoFisher Scientific)] with indicated treatments added at time of seeding. After 5–6 days, all spheres in each well comprised of >20 cells were counted, the total number of tumor spheroids formed in each well was plotted and representative images taken. Staurosporine, which we have previously shown to be cytotoxic to SUM149 cells (13,15), was used as a spheroid kill control (data not shown). Area of spheroids was calculated by converting images to eight-bit and employing the function Analyze Particles in ImageJ, setting the particle size between 1000-infinity pixels and circularity between 0.20 and 1.00.
Anchorage-independent growth assay
Cells were plated in six-well plates at 7.5 × 10⁴ cells/well and incubated overnight. Cells were treated for 24 h with EGFR inhibitor GW583340 (EGFRi: 1 μM), BPA (1 nM) or BPA + EGFRi, after which cells were harvested and live cells counted as described previously (19). Briefly, a base layer of agarose in growth medium was poured into wells of a 12-well plate and allowed to solidify at 4°C. Then, 1.25 × 10⁴ cells/well from each treatment were plated in triplicate in 0.45% agarose in growth medium on top of the base layer. Plates were transferred to the incubator and allowed to grow for 14–21 days, and cells were fed with ~100 μl of medium every 4–5 days. After visible colonies formed, they were counted under a microscope, and colony counts were normalized to untreated controls, with bars representing mean ± SD percent colonies formed relative to untreated. Data were considered significant (# P < 0.005) with comparisons made to untreated using the two-tailed student’s t-test.
Data and statistical analysis
Statistical analyses were performed using Graphpad Prism Version 6 and unpaired student’s two-tailed t-test. Differences were considered significant at P < 0.05.
Results
Endocrine-disrupting chemicals activate EGFR signaling
In order to address the hypothesis that environmental chemical exposure can enhance mitogenic signaling and lead to increased cancer cell proliferation in an aggressive/hyperproliferative tumor subtype such as IBC, we selected six proof of principle chemicals from the ToxCast dataset (EPA: see Materials and Methods section), which exhibited activity in pathways (EGFR, ER− and NF-κB) that have been identified to be overexpressed in IBC patient tumors. Further, these chemicals are present in food- and drug-related (BPA, niclosamide), as well as agricultural products (esfenvalerate, chlorothalonil, HPTE, methoxychlor). We first tested the effect of the six environmental chemicals (Figure 1) on EGFR and ERK activation in the patient-derived SUM149 IBC cell line (triple negative, constitutively activated EGFR and dependent on EGFR/ERK signaling for their growth). Cells treated with BPA, HPTE and methoxychlor, which are endocrine-disrupting chemicals, caused an increase in EGFR activation at low nanomolar doses. Specifically, treatment with BPA resulted in a 1.8-fold increase at 40 nM that was further increased 4.22-fold at the higher 10 μM concentration; methoxychlor caused an average 2-fold increase at both low and high doses and its active metabolite HPTE a 1.58- to 2.21-fold increase over the concentrations tested. Furthermore, a significant increase in downstream ERK activation was observed in BPA-treated cells (1.16- to 1.68-fold increase). Niclosamide- and chlorothalonil-treated cells decreased ERK and EGFR activation at all doses tested. These results reveal a potential link between environmental chemicals and mitogenic signaling.
Figure 1.

Endocrine-disrupting chemicals increase mitogenic signaling. Western immunoblot analysis of SUM149 cells treated for 30 min with indicated doses of BPA, HPTE, methoxychlor, esfenvalerate, chlorothalonil and niclosamide. Blots probed for pEGFR, EGFR, pERK and ERK expression, with GAPDH used as a loading control. Numbers represent fold change of phospho to total protein (EGFR or ERK) normalized to untreated.
Endocrine-disrupting chemical-mediated increases in EGFR activation correspond with increased cell growth characteristics
In order to evaluate the effect of chemical-mediated EGFR/ERK signaling on IBC cell viability, morphology and proliferation, we first employed a multiparametric high-content imaging assay (HCA). After chemical treatment for 24 and 72 h, cells were stained with both Hoechst 33342 (a nuclear stain) and YOYO-1 (a dye taken up by cells with compromised membranes) and automated cellular imaging undertaken using the CellInsight NXT high-content screening platform. The Cell Health Profiling protocol was used to mask nuclei and determine nuclear count as well as establish the YOYO-1 region inside the nuclear mask. The data normalized for concentration-dependent effects of these chemicals on nuclear count show that the endocrine-disrupting chemicals that caused increased EGFR activation, also promoted increased nuclear count (Figure 2A). Representative images for cells co-stained with Hoechst and YOYO-1 at doses showing significant changes are shown for each chemical as an inset in Figure 2A. BPA and methoxychlor increased nuclear count by 40–50% at low doses (1 nM for both and 10 nM for BPA only) at 24 h and by 10–20% at both low and high doses after 72 h treatment (Supplementary Figure 1A, available at Carcinogenesis Online). HPTE caused a significant increase at 24 h in nuclear count at low dose (50% at 1 and 10 nM), whereas at 72 h, HPTE only demonstrated an increase in nuclear count (15%) at the highest doses tested (5–10 μM) (*P < 0.05, # P < 0.005). The increases in nuclear count for endocrine-disrupting chemicals appeared to be attenuated at the longer 72 h time point. Chlorothalonil and niclosamide significantly decreased nuclear count (# P < 0.005), which also correlated with the decreased EGFR/ERK activation observed in Figure 1.
Figure 2.

Select ToxCast environmental compounds exhibit differential growth and health effects in SUM149 cells. SUM149 cells were treated for 24 h with the indicated ToxCast compounds and bars represent mean ± SD normalized to untreated for three independent assays carried out in triplicate for (A) % nuclear count, (B) % MTT proliferation and (C) % YOYO-1 cell viability. Statistical significance was calculated by the Student’s t-test. *P < 0.05, **P < 0.01, # P < 0.005. Inset: representative high-content imaging fields (×10; overlay of Hoechst = blue, YOYO-1 = green) for vehicle, cell kill control (1 μM staurosporine), 1 nM BPA, esfenvalerate, HPTE and methoxychlor, and 5 μM niclosamide and chlorothalonil.
The data obtained from signaling and HCA analysis were further corroborated by characterization of the six chemicals after short-term 24 h exposure using an MTT assay to measure effects on proliferation (Figure 2B). BPA increased proliferation by 10% at 1 nM (# P < 0.005) and 10000 nM doses similar to the nuclear count data. Despite the effect observed on SUM149 nuclear count, HPTE, and methoxychlor treatment for 24 h did not significantly change the proliferation rate of SUM149 cells as assessed by MTT. In both nuclear count (Figure 2A) and proliferation (Figure 2B), esfenvalerate had no significant effect at any dose tested. For niclosamide and chlorothalonil, effects on proliferation at 24 h (Figure 2B) correlated closely with the HCA cell number data showing significantly decreased proliferation at high nanomolar to low micromolar doses, with increased effects on proliferation observed at 72 h (Supplementary Figure 1B, available at Carcinogenesis Online). The proliferative effect of the endocrine-disrupting chemicals appears to be attenuated after 72 h with no statistically significant increases in proliferation observed (Supplementary Figure 1B, available at Carcinogenesis Online), similar to the attenuation of nuclear count seen after 72 h treatment. This attenuation of proliferative effect may be due to a decrease in cellular stability of the endocrine-disrupting chemicals occurring over time.
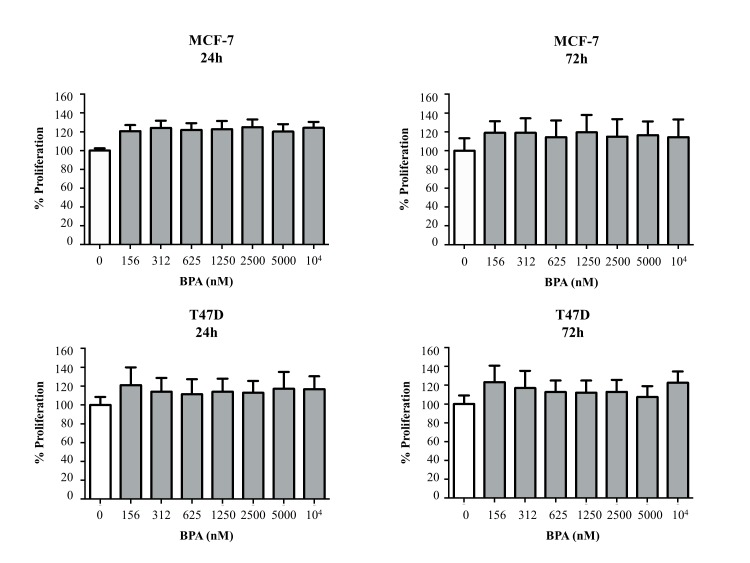
Although BPA was found to consistently increase indicators of growth (nuclear count and MTT proliferation), we also sought to determine its effect on cell health. YOYO-1 staining, which is increased when the cell membrane becomes permeable to the dye (indicative of decreased viability), was conducted at the same time as Hoechst staining in the high-content assay. The endocrine-disrupting chemicals did not significantly increase YOYO-1 staining at either 24 (Figure 2C) or 72 h (Supplementary Figure 1C, available at Carcinogenesis Online). The two chemicals that decreased proliferation, niclosamide and chlorothalonil, significantly increased YOYO-1 staining 5- to 10-fold at both time points. These data suggest that in an ER-negative IBC cell line, BPA and the other endocrine-disrupting chemicals appear to exert their proliferative effects with no significant change to cell health. As controls, we also tested the effect of BPA in ER-positive non-IBC cells (MCF-7 and T47D) and similar to previous reports (20–22), we observed increased cell proliferation (Supplementary Figure 2, available at Carcinogenesis Online) at all BPA doses tested P < 0.05 for both 24 and 72 h).
BPA exerts its proliferative effect through EGFR signaling
To further investigate whether the proliferative effect of BPA observed at 24 h in ER-negative cells was mediated by EGFR activation, we carried out a series of mechanistic studies using IBC cell lines with varying EGFR status. First, we assessed at 24 h the effect of EGFR inhibition for its ability to reverse the proliferative effect of BPA in SUM149 cells. We observed that co-treatment with BPA and an EGFR inhibitor [lapatinib analog GW583340 (EGFRi)] attenuated the proliferative effect of BPA (Figure 3A), with immunoblot analysis showing that pEGFR levels were downregulated in co-treatment conditions compared with the increase seen in the presence of BPA alone. Next, we tested the effect of BPA in rSUM149, an isogenic variant of SUM149 that we clonally selected for acquired resistance to EGFR-targeting agents, where EGFRi decreases pEGFR, but the pERK levels are sustained (uncoupling of EGFR/ERK signaling) (13,16). Indeed, in rSUM149, we observed that BPA treatment caused an increase in pEGFR levels (Figure 3B) but no increase in proliferation, presumably as this cell line is not dependent on EGFR activation for its proliferative signaling. To further confirm the role of EGFR in eliciting BPA effects, we treated another patient-derived IBC cell line, SUM190, which is both EGFR- and ER-negative but has HER2 overexpression (Figure 3C). In SUM190 lacking EGFR, BPA treatment did not increase proliferation and did not affect pHER2 levels. Taken together, these results confirm the role of EGFR activation in BPA-mediated cancer cell proliferation in estrogen-negative cells.
Figure 3.

EGFR-ERK signaling is necessary for BPA’s proliferative effect. (A) SUM149 cells treated for 24 h with either vehicle, BPA (40 nM), EGFR inhibitor GW583340 (2.5 μM), or EGFRi + BPA co-treatment and assessed for proliferation by MTT. Inset: western immunoblot analysis of SUM149 cells treated for 24 h with BPA (40 nM), EGFRi (2.5 μM) and probed for pEGFR and EGFR, with GAPDH used as a loading control. (B) rSUM149 were treated for 24 h with BPA at the indicated concentrations and assessed for proliferation by MTT. Inset: western immunoblot analysis of rSUM149 cells treated for 24 h with BPA (10 μM) and probed for pEGFR and EGFR, with GAPDH used as a loading control. (C) SUM190 cells were treated for 24 h with BPA at the indicated concentrations and assessed for proliferation by MTT. Inset: western immunoblot analysis of SUM190 cells treated for 24 h with EGFR/HER2i (GW583340; 7.5 μM), BPA (1 nM) or the combination and probed for pHER2 and HER2, with GAPDH used as a loading control. For each cell line study, proliferation data represents mean ± SD percent normalized to untreated control for a minimum of three independent assays, each carried out in triplicate. Statistical significance was calculated by the Student’s t-test. *P < 0.05, # P < 0.005, ns = not significant. For all western blots, numbers represent fold change of phospho proteins to total proteins and total proteins to GAPDH, normalized to untreated.
BPA promotes colony formation and tumor spheroid formation of IBC cells in long-term phenotypic assays
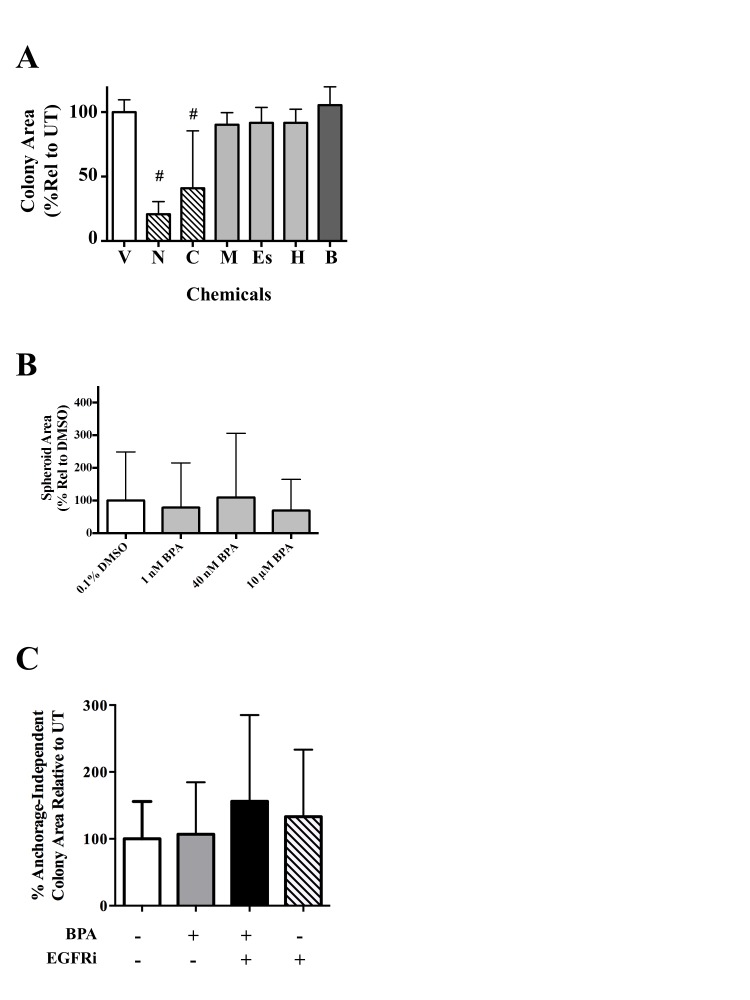
As mitogenic effects such as EGFR activation can impact cancer cell phenotype over extended time periods, we investigated the effect of BPA in long-term phenotypic assays of growth and proliferation. First, we evaluated the selected chemicals for their effects on colony formation of SUM149 cells after 4–5 days (Figure 4A). BPA (B) caused a significant increase in cell colonies formed (32% at 10 μM; # P < 0.005)] compared with the vehicle (V) control. Representative images for vehicle and BPA are shown (Figure 4A). Methoxychlor (M), HPTE (H) and esfenvalerate (Es) treatment did not statistically effect colony formation. Cytotoxic compounds niclosamide and chlorothalonil (5 μM each) drastically reduced SUM149 cell colony growth (Figure 4A), with chlorothalonil resulting in a 50% reduction in colony number and niclosamide completely inhibiting colony formation. Chlorothalonil and niclosamide were also the only chemicals to significantly alter colony area, with a 60 and 80% reduction in colony area (# P < 0.005), respectively (Supplementary Figure 3A, available at Carcinogenesis Online). Taken together, these results further demonstrate the proliferative effect of BPA in estrogen-negative IBC cells and we focus hereafter on this compound.
Figure 4.

BPA promotes clonogenic and tumor spheroid growth and attenuates EGFR inhibitory effect on anchorage-independent growth. (A) Clonogenic growth: SUM149 cells were treated for 24 h with vehicle (V), 5 μM niclosamide (N), 5 μM chlorothalonil (C), 1 μM methoxychlor (M), 100 nM esfenvalerate (Es), 1 nM HPTE (H) and 10 μM BPA (B), followed by 5 days of additional growth. Data represent mean ± SD percentage of colonies relative to vehicle/untreated for a minimum of three independent assays. Right: representative photomicrographs (×1) of vehicle and BPA (10 μM) treated SUM149 colonies. (B) Tumor spheroid: SUM149 cells were seeded in spheroid promoting media and treated with either vehicle control (0.1% dimethyl sulfoxide), low-dose (1 nM) or high-dose BPA (10 μM) or EGFR inhibitor GW583340 (7.5 μM) at the time of seeding. Cells were grown for 5–6 days and mature spheroids (>1000 pixels) counted and assessed using ImageJ. Spheroid count data represent mean ± SD percent normalized to untreated control for at least two independent experiments comprising a minimum of six replicate wells. Right: representative photomicrographs (×5) are shown for each treatment. (C) SUM149 cells were treated for 24 h with BPA (40 nM), EGFRi (2.5 μM) or BPA + EGFRi co-treatment, followed by an additional 2 weeks of anchorage independent growth. Bars represent mean ± SD percentage of anchorage-independent colony number formed relative to untreated for at least two independent experiments comprising a minimum of six replicate wells. Right: representative photomicrographs (×10) of anchorage-independent colonies are shown for each treatment.
A distinct hallmark of IBC pathobiology is formation of tumor cell clusters termed tumor spheroids/emboli. We therefore investigated in another long-term assay whether BPA’s proliferative effect would enhance tumor spheroid formation. Increasing doses of BPA led to an increase in the number of SUM149 tumor spheroids formed 6 days after treatment (Figure 4B and representative images), with 10 μM treatment (high BPA) causing a statistically significant 50% increase in spheroid formation compared with untreated. In contrast, EGFRi treatment significantly disrupts spheroid formation. Although there were increased numbers of spheroids with BPA treatment, quantifying changes in spheroid area was challenging, possibly due to the variability of spheroid size in each treatment group, and we were unable to observe any statistically significant differences in spheroid area with BPA treatment (Supplementary Figure 3B, available at Carcinogenesis Online).
BPA reverses the anchorage-independent growth inhibitory effect of targeted EGFR inhibitor
Based on our data that BPA is proliferative, particularly over long-term assays, and can activate EGFR-ERK signaling, we hypothesized that BPA exposure could lead to decreased therapeutic sensitivity to EGFR inhibitory drugs over time. To address this, we tested the effect of co-treatment of BPA along with EGFR inhibitor (GW583340) in another long-term assay, the anchorage-independent assay, a well-accepted in vitro predictive model of cancer cell tumorigenic potential. BPA (40 nM) treatment alone did result in a statistically significant increase in the number of anchorage-independent colonies observed after 2–3 weeks (Figure 4C and representative images). In contrast, the cytotoxic effect of the EGFR inhibitor is demonstrated by the significant decrease (65% colonies relative to UT, # P < 0.005) in anchorage-independent growth compared with untreated control (Figure 4C). Again, due to challenges in quantitating area, no significant changes in colony area were observed with any treatment (Supplementary Figure 3C, available at Carcinogenesis Online). Interestingly, co-treatment with the EGFR inhibitor (1 μM) and BPA (40 nM) exhibited a significant increase in the number of colonies relative to the EGFR inhibitor alone. These data suggest an ability of BPA to attenuate the inhibitory effect of EGFR inhibition on anchorage-independent growth. The same attenuation of GW583340’s effect on anchorage-independent growth by BPA was also observed at lower 1 nM BPA treatment (data not shown).
EGFR/HER2 receptor-targeting drugs are frequently used as part of neoadjuvant therapy in breast cancer patients including those with IBC, but acquired resistance is frequent and an unmet challenge (2). Previously, we have reported that an increase in antioxidants as a result of enhanced anti-apoptotic signaling is a key mechanism of acquired therapeutic resistance to EGFR tyrosine kinase inhibitors allowing for increased survival of drug tolerant cell populations including generation of the rSUM149 cells as a representative model of multidrug resistance (13,15,23). Indeed, our data (Figure 5A) showing increase in superoxide dismutase SOD1 and Bcl-2 expression in BPA-treated SUM149 cells suggests an as-yet unrecognized role of BPA in therapeutic resistance. In addition, we observed BPA caused an increase in the alternate ER, G-protein-coupled ER (GPER), consistent with recent studies reporting a decrease in the proliferative effect of BPA when ER-negative breast cancer cells are exposed to GPER antagonists (24–26). Taken together, our results show the potential of BPA to enhance growth factor receptor-mediated mitogenic signaling in an aggressive breast cancer subtype and summarized in the schematic (Figure 5B).
Figure 5.

BPA increases downstream survival proteins and GPER while attenuating the growth inhibitory effects of EGFR inhibition. (A) SUM149 cells were treated for 30 min with BPA at the indicated concentrations and western blotting carried out for Bcl-2, SOD1 and GPER expression with GAPDH used as a loading control. Numbers represent fold change of total protein relative to GAPDH normalized to untreated. (B) Schema: the effect of BPA in ER-negative, GPER-positive (29) SUM149 IBC cells. BPA activates EGFR and ERK signaling leading to an increased proliferative phenotype, increased alternate estrogen receptor GPER levels and upregulation of survival and antioxidant proteins Bcl-2 and SOD1. Antagonism of EGFR activation by GW583340 (13,15,17), respectively, reverses the proliferative effect of BPA. However, BPA can overcome the growth inhibitory effect of GW583340 in a longer-term assay of cancer growth and progression. The numbers on the schema represent references as described above.
Discussion
Identifying the impact of environment chemicals that can promote cancer cell survival is of significant interest in tumor biology and therapeutic outcomes. This study investigated environmental chemicals from the EPA’s ToxCast library for their effects on IBC, a particularly lethal form of breast cancer with a short latency period, and we identified pro-proliferative effects of the endocrine-disrupting chemical, BPA. In addition, to the best of our knowledge, this is the first report describing the ability of BPA to increase EGFR activation at the protein level and attenuate the effects of an anti-EGFR drug currently approved for the treatment of breast cancer, including IBC (27). Unlike mass-forming locally advanced breast cancers, IBC is a distinct and most lethal subtype wherein tumor cells rapidly proliferate as tightly packed cell clusters (called tumor emboli) with a propensity for lymphatic trafficking (2). Therefore, our observations that BPA-enhanced formation of tumor spheroids in culture is of significance and warrants further investigation using improved models of tumor emboli formation and migration. While many studies have identified that BPA can increase proliferation in ER-positive cell lines (such as MCF-7 and T47D, see Supplemental Figure 3, available at Carcinogenesis Online) through their estrogenic activities (20–22,28), our results identify an EGFR-dependent mechanism of BPA in increasing proliferation of ER-negative breast cancer cells. In contrast, in IBC cells that lack EGFR (SUM190), we do not see increased proliferation in the presence of BPA, with no observed activation of a related growth factor receptor (HER2). To further assess the role of EGFR activation on BPA-mediated proliferation, we used an isogenic therapy-resistant variant of SUM149 cells (rSUM149) that maintains ERK activation despite persistent EGFR inhibition, resulting in uncoupling of EGFR-ERK mitogenic signaling. The crucial role of EGFR in BPA-mediated proliferation is supported by our observation that in rSUM149 cells, BPA-induced EGFR activation did not result in enhanced proliferation. Furthermore, we observed BPA-mediated EGFR activation corresponded with an increase in the alternate ER receptor GPER, which itself is known to activate EGFR signaling (29). This is of significance as IBC patient tumors and SUM149 cells have been reported to express GPER (30), which is also known to activate EGFR (29,31).
BPA (plasticizer in food- and drug-related products) and HPTE (insecticide/pesticide), which also increased IBC cell proliferation and ERK activation in the present study, are widely studied endocrine-disrupting chemicals (22,32). Interestingly, BPA showed a non-monotonic dose-response, wherein low and high doses caused the most significant increase in proliferation. This effect has been observed in many BPA-related studies and may be due to differences in its binding affinity for multiple receptors or multiple sites on the same receptor (33–39). Humans are constantly exposed to ambient BPA in the environment, with numerous studies detecting BPA levels in various human fluids at significant concentrations (0.88–88 nM in serum and 1.75–653 nM in urine), with evidence that long-term daily intake may lead to higher levels not anticipated by current models (34,35). The current study has evaluated low nanomolar doses well within this range, as well as higher doses that may be achievable in patients undergoing dialysis and/or receiving therapy through tubing containing BPA (40).
In conclusion, this study shows a potential mechanism wherein BPA can increase IBC cell proliferation and cause resistance to an approved targeted drug through activation of the EGFR/ERK pathway and increased anti-apoptotic and antioxidant proteins. As subtle changes in proliferation rates can lead to clonal selection of cancer cells that gain adaptive survival mechanisms leading to tumor recurrence (41) and therapeutic resistance, the present study implicates a potential role of environmental chemicals in cancer progression and development of drug resistance.
Supplementary material
Supplementary data are available at Carcinogenesis online.
Funding
This work was supported by developmental and pilot research funds to G.D. from the Duke Cancer Institute (Cancer and Environment Program supported by Mr and Mrs Fred and Alice Stanback and P3917733 and P30CA014236); Department of Surgery Bolognesi award (to G.D.); Duke University School of Medicine support for the Duke Consortium for IBC (DCIBC; to G.D.), and in part from the American Cancer Society (RSG-08-290-01-CCE to G.D.); the National Cancer Institute (T32CA009111 to S.S.); and the Department of Defense award (W81WXH-13-1-0141 to K.W. and G.D.).
Supplementary Material
Acknowledgements
We thank J.Z.Sexton (North Carolina Central University) for assistance in database search and analysis, S.Ingram (North Carolina Central University) and J.B.Davis (Duke URS Independent Study) for technical support and Devi Laboratory for helpful discussions.
Conflict of Interest Statement: None declared.
Abbreviations
- BPA
bisphenol A
- EGFR
epidermal growth factor receptors
- ER
estrogen receptor
- GPER
G-protein coupled estrogen receptor
- HPTE
2,2-bis(p-hydroxyphenyl)-1,1,1-trichloroethane
- IBC
inflammatory breast cancer
- MTT
3-(4,5-dimethylthiazol-2-yl)-2,5 diphenyl tetrazolium bromide
- NF-κB
nuclear factor-kappaB
- PBS
phosphate-buffered saline
References
- 1. Woodward W.A. (2015) Inflammatory breast cancer: unique biological and therapeutic considerations. Lancet. Oncol., 16, e568–e576. [DOI] [PubMed] [Google Scholar]
- 2. Fernandez S.V., et al. (2013) Inflammatory breast cancer (IBC): clues for targeted therapies. Breast Cancer Res. Treat., 140, 23–33. [DOI] [PMC free article] [PubMed] [Google Scholar]
- 3. Wingo P.A., et al. (2004) Population-based statistics for women diagnosed with inflammatory breast cancer (United States). Cancer Causes Control, 15, 321–328. [DOI] [PubMed] [Google Scholar]
- 4. Boussen H., et al. (2008) Inflammatory breast cancer in Tunisia: reassessment of incidence and clinicopathological features. Semin. Oncol., 35, 17–24. [DOI] [PubMed] [Google Scholar]
- 5. Duke T.J., et al. (2010) A cluster of inflammatory breast cancer (IBC) in an office setting: additional evidence of the importance of environmental factors in IBC etiology. Oncol. Rep., 24, 1277–1284. [DOI] [PubMed] [Google Scholar]
- 6. Levine P.H., et al. (2014) Inflammatory breast cancer clusters: a hypothesis. World J. Clin. Oncol., 5, 539–545. [DOI] [PMC free article] [PubMed] [Google Scholar]
- 7. Thun M.J., et al. (2004) Understanding cancer clusters. CA Cancer J. Clin., 54, 273–280. [DOI] [PubMed] [Google Scholar]
- 8. Allensworth J.L., et al. (2015) Disulfiram (DSF) acts as a copper ionophore to induce copper-dependent oxidative stress and mediate anti-tumor efficacy in inflammatory breast cancer. Mol. Oncol., 9, 1155–1168. [DOI] [PMC free article] [PubMed] [Google Scholar]
- 9. Bertucci F., et al. (2014) Gene expression profiles of inflammatory breast cancer: correlation with response to neoadjuvant chemotherapy and metastasis-free survival. Ann. Oncol., 25, 358–365. [DOI] [PMC free article] [PubMed] [Google Scholar]
- 10. Van Laere S.J., et al. (2013) Uncovering the molecular secrets of inflammatory breast cancer biology: an integrated analysis of three distinct affymetrix gene expression datasets. Clin. Cancer Res., 19, 4685–4696. [DOI] [PMC free article] [PubMed] [Google Scholar]
- 11. Van Laere S.J., et al. (2006) Nuclear factor-kappaB signature of inflammatory breast cancer by cDNA microarray validated by quantitative real-time reverse transcription-PCR, immunohistochemistry, and nuclear factor-kappaB DNA-binding. Clin. Cancer Res., 12 (11 Pt 1), 3249–3256. [DOI] [PubMed] [Google Scholar]
- 12. Van Laere S.J., et al. (2007) NF-kappaB activation in inflammatory breast cancer is associated with oestrogen receptor downregulation, secondary to EGFR and/or ErbB2 overexpression and MAPK hyperactivation. Br. J. Cancer, 97, 659–669. [DOI] [PMC free article] [PubMed] [Google Scholar]
- 13. Aird K.M., et al. (2010) X-linked inhibitor of apoptosis protein inhibits apoptosis in inflammatory breast cancer cells with acquired resistance to an ErbB1/2 tyrosine kinase inhibitor. Mol. Cancer Ther., 9, 1432–1442. [DOI] [PMC free article] [PubMed] [Google Scholar]
- 14. Judson R.S., et al. (2010) In vitro screening of environmental chemicals for targeted testing prioritization: the ToxCast project. Environ. Health Perspect., 118, 485–492. [DOI] [PMC free article] [PubMed] [Google Scholar]
- 15. Aird K.M., et al. (2012) ErbB1/2 tyrosine kinase inhibitor mediates oxidative stress-induced apoptosis in inflammatory breast cancer cells. Breast Cancer Res. Treat., 132, 109–119. [DOI] [PMC free article] [PubMed] [Google Scholar]
- 16. Aird K.M., et al. (2008) Trastuzumab signaling in ErbB2-overexpressing inflammatory breast cancer correlates with X-linked inhibitor of apoptosis protein expression. Mol. Cancer Ther., 7, 38–47. [DOI] [PubMed] [Google Scholar]
- 17. Williams K.P., et al. (2013) Quantitative high-throughput efficacy profiling of approved oncology drugs in inflammatory breast cancer models of acquired drug resistance and re-sensitization. Cancer Lett., 337, 77–89. [DOI] [PMC free article] [PubMed] [Google Scholar]
- 18. Abraham V.C., et al. (2008) Application of a high-content multiparameter cytotoxicity assay to prioritize compounds based on toxicity potential in humans. J. Biomol. Screen., 13, 527–537. [DOI] [PubMed] [Google Scholar]
- 19. Allensworth J.L., et al. (2013) Smac mimetic Birinapant induces apoptosis and enhances TRAIL potency in inflammatory breast cancer cells in an IAP-dependent and TNF-α-independent mechanism. Breast Cancer Res. Treat., 137, 359–371. [DOI] [PubMed] [Google Scholar]
- 20. Lee H.R., et al. (2012) Treatment with bisphenol A and methoxychlor results in the growth of human breast cancer cells and alteration of the expression of cell cycle-related genes, cyclin D1 and p21, via an estrogen receptor-dependent signaling pathway. Int. J. Mol. Med., 29, 883–890. [DOI] [PubMed] [Google Scholar]
- 21. Matsumoto H., et al. (2005) Bisphenol A in ambient air particulates responsible for the proliferation of MCF-7 human breast cancer cells and its concentration changes over 6 months. Arch. Environ. Contam. Toxicol., 48, 459–466. [DOI] [PubMed] [Google Scholar]
- 22. Lapensee E.W., et al. (2009) Bisphenol A at low nanomolar doses confers chemoresistance in estrogen receptor-alpha-positive and -negative breast cancer cells. Environ. Health Perspect., 117, 175–180. [DOI] [PMC free article] [PubMed] [Google Scholar]
- 23. Allensworth J.L., et al. (2012) XIAP inhibition and generation of reactive oxygen species enhances TRAIL sensitivity in inflammatory breast cancer cells. Mol. Cancer Ther., 11, 1518–1527. [DOI] [PubMed] [Google Scholar]
- 24. Dong S., et al. (2011) Bisphenol A induces a rapid activation of Erk1/2 through GPR30 in human breast cancer cells. Environ. Pollut., 159, 212–218. [DOI] [PubMed] [Google Scholar]
- 25. Ohshiro K., et al. (2012) Alternate estrogen receptors promote invasion of inflammatory breast cancer cells via non-genomic signaling. PLoS One, 7, e30725. [DOI] [PMC free article] [PubMed] [Google Scholar]
- 26. Pupo M., et al. (2012) Bisphenol A induces gene expression changes and proliferative effects through GPER in breast cancer cells and cancer-associated fibroblasts. Environ. Health Perspect., 120, 1177–1182. [DOI] [PMC free article] [PubMed] [Google Scholar]
- 27. Nelson M.H., et al. (2007) A review of lapatinib ditosylate in the treatment of refractory or advanced breast cancer. Ther. Clin. Risk Manag., 3, 665–673. [PMC free article] [PubMed] [Google Scholar]
- 28. Ricupito A., et al. (2009) Effect of bisphenol A with or without enzyme treatment on the proliferation and viability of MCF-7 cells. Environ. Int., 35, 21–26. [DOI] [PubMed] [Google Scholar]
- 29. Filardo E.J., et al. (2000) Estrogen-induced activation of Erk-1 and Erk-2 requires the G protein-coupled receptor homolog, GPR30, and occurs via trans-activation of the epidermal growth factor receptor through release of HB-EGF. Mol. Endocrinol., 14, 1649–1660. [DOI] [PubMed] [Google Scholar]
- 30. Arias-Pulido H., et al. (2010) GPR30 and estrogen receptor expression: new insights into hormone dependence of inflammatory breast cancer. Breast Cancer Res. Treat., 123, 51–58. [DOI] [PMC free article] [PubMed] [Google Scholar]
- 31. Vivacqua A., et al. (2012) GPER mediates the Egr-1 expression induced by 17β-estradiol and 4-hydroxitamoxifen in breast and endometrial cancer cells. Breast Cancer Res. Treat., 133, 1025–1035. [DOI] [PubMed] [Google Scholar]
- 32. Gaido K.W., et al. (1999) Differential interaction of the methoxychlor metabolite 2,2-bis-(p-hydroxyphenyl)-1,1,1-trichloroethane with estrogen receptors alpha and beta. Endocrinology, 140, 5746–5753. [DOI] [PubMed] [Google Scholar]
- 33. Vandenberg L.N. (2014) Non-monotonic dose responses in studies of endocrine disrupting chemicals: bisphenol a as a case study. Dose Response, 12, 259–276. [DOI] [PMC free article] [PubMed] [Google Scholar]
- 34. Vandenberg L.N., et al. (2009) Bisphenol-A and the great divide: a review of controversies in the field of endocrine disruption. Endocr. Rev., 30, 75–95. [DOI] [PMC free article] [PubMed] [Google Scholar]
- 35. Welshons W.V., et al. (2006) Large effects from small exposures. III. Endocrine mechanisms mediating effects of bisphenol A at levels of human exposure. Endocrinology, 147 (Suppl. 6), S56–S69. [DOI] [PubMed] [Google Scholar]
- 36. Conolly R.B., et al. (2004) Nonmonotonic dose-response relationships: mechanistic basis, kinetic modeling, and implications for risk assessment. Toxicol. Sci., 77, 151–157. [DOI] [PubMed] [Google Scholar]
- 37. Jenkins S., et al. (2011) Chronic oral exposure to bisphenol A results in a nonmonotonic dose response in mammary carcinogenesis and metastasis in MMTV-erbB2 mice. Environ. Health Perspect., 119, 1604–1609. [DOI] [PMC free article] [PubMed] [Google Scholar]
- 38. Liang Q., et al. (2014) Cellular mechanism of the nonmonotonic dose response of bisphenol A in rat cardiac myocytes. Environ. Health Perspect., 122, 601–608. [DOI] [PMC free article] [PubMed] [Google Scholar]
- 39. vom Saal F.S., et al. (2006) Large effects from small exposures. II. The importance of positive controls in low-dose research on bisphenol A. Environ. Res., 100, 50–76. [DOI] [PubMed] [Google Scholar]
- 40. Kanno Y., et al. (2007) Effects of endocrine disrupting substance on estrogen receptor gene transcription in dialysis patients. Ther. Apher. Dial., 11, 262–265. [DOI] [PubMed] [Google Scholar]
- 41. Solimini N.L., et al. (2012) Recurrent hemizygous deletions in cancers may optimize proliferative potential. Science, 337, 104–109. [DOI] [PMC free article] [PubMed] [Google Scholar]
Associated Data
This section collects any data citations, data availability statements, or supplementary materials included in this article.