Abstract
Filariasis is a tropical disease caused by the parasitic nematodes Wuchereria bancrofti and Brugia malayi. Known inhibitors of dihydrofolate reductase (DHFR) have been previously shown to kill Brugia malayi nematodes and to inhibit Brugia malayi DHFR (BmDHFR) at nanomolar concentrations. These data suggest that BmDHFR is a potential target for the treatment of filariasis. Here, protocols for cloning, expression and purification of Wuchereria bancrofti DHFR (WbDHFR) were developed. The Uniprot entry J9F199-1 predicts a 172 amino acid protein for WbDHFR but alignment of this sequence to the previously described BmDHFR shows that this WbDHFR sequence lacks a crucial, conserved 13 amino acid loop. The presence of the loop in WbDHFR is supported by a noncanonical splicing event and the loop sequence was therefore included in the gene design. Subsequently, the KM for dihydrofolate (3.7 ± 2 μM), kcat (7.4 ± 0.6 s-1), and pH dependence of activity were determined. IC50 values of methotrexate, trimethoprim, pyrimethamine, raltitrexed, aminopterin, (-)-epicatechin gallate, (-)-epicatechin, and vitexin were measured for WbDHFR and BmDHFR. Methotrexate and structurally related aminopterin were found to be effective inhibitors of WbDHFR, with an KI of 1.2 ± 0.2 nM and 2.1 ± 0.5 nM, respectively, suggesting that repurposing of known antifolate compound may be an effective strategy to treating filariasis. Most compounds showed similar inhibition profiles toward both enzymes, suggesting that the two enzymes have important similarities in their active site environments and can be targeted with the same compound, once a successful inhibitor is identified.
Introduction
Lymphatic filariasis (elephantiasis) is a disfiguring and incapacitating disease caused by three species of mosquito borne parasitic worms, Wuchereria bancrofti, which is responsible for 90% of the cases, Brugia malayi and Brugia timori. This disease threatens the well-being of 947 million people in 54 countries. Clinical manifestations include lymphedema of the limbs (currently approximately 15 million cases worldwide) and hydrocele (swelling of the scrotum and penis, approximately 25 million cases) [1, 2]. Those infected with filariasis further suffer from stigma, disabilities, and the associated economic consequences.
Dihydrofolate reductase (DHFR) is an NADPH dependent enzyme that catalyzes the formation of tetrahydrofolate from dihydrofolate [3, 4]. With the exception of some prokaryotes[5], DHFR is a ubiquitous enzyme required for folate metabolism and DNA synthesis. As such, DHFR inhibition by “antifolates” has proven to be a successful strategy in the treatment of cancer, bacterial infections and malaria [6, 7]. A recent Brugia malayi DHFR (BmDHFR) 3-D structural modeling and docking analysis predicted several antifolate compounds to be effective inhibitors of the enzyme [8]. These predictions are potentially supported by findings reported in three recent articles that show Brugia malayi nematode mobility decreased in the presence of antifolate agents [9–11]. Moreover, folic acid reversal studies have shown that the mobility of microfilariae decreased less when the nematodes were pre-incubated with folic acid before treatment with the antifolate compounds. Hande and coworkers also predicted vitexin, a compound found in passion flower, and the green tea compounds epicatechin and (-)-epicatechin gallate to be inhibitors of BmDHFR [8].
We recently developed methods to clone, express and purify BmDHFR, and have demonstrated its inhibition by well-known antifolates [12]. DHFR from Wuchereria bancrofti (WbDHFR) is 96% identical to BmDHFR in amino acid sequence. We now report the development of methods to clone, express and purify WbDHFR and compare its kinetic parameters and inhibitor profile to those of BmDHFR. Such a comparison allows insights into whether the amino acid differences between the two sequences have impact on kinetic parameters and inhibitor binding.
Methods
Wuchereria bancrofti (Wb) gene sequence development
A nucleotide sequence encoding WbDHFR with an N-terminal His-6 tag was designed, synthesized, and codon optimized for expression in E. coli by Genewiz. The resulting DHFR gene sequence was subcloned into pET25b via NdeI and XhoI sites and transformed into the E. coli LOBSTR strain for protein expression.
Expression and purification of WbDHFR
WbDHFR was expressed at 25°C in LB media with 100 μg/mL ampicillin and induction overnight with IPTG at 0.3 mM. The enzyme was harvested by centrifuging the E. coli mixture at 5,000 rpm for 30 min at 4°C using a JA-10 rotor in a Beckman Avanti J-26S XP centrifuge. The pellet was collected and supernatant discarded. This pellet was then resuspended using equilibration buffer (10 mM imidazole, 20 mM Na2HPO4, 300 mM NaCl, 0.1 mM DTT, at pH 7.4) and soluble protein prepared by sonication of the wet cell paste followed by centrifugation of the mixture using a Sorvall ST16R centrifuge at 5,000 rpm for 30 min at 4°C. The supernatant, rich in soluble WbDHFR, was collected and pellet discarded. His-tagged WbDHFR was purified at pH 7.4 using Ni-NTA resin. The column was washed with 100 mM imidazole wash buffer (100 mM imidazole, 20 mM Na2HPO4, 300 mM NaCl, 0.1 mM DTT, at pH 7.4) before being eluted with 250 mM imidazole elution buffer (250 mM imidazole, 20 mM Na2HPO4, 300 mM NaCl, 0.1 mM DTT, at pH 7.4). Protein was concentrated, and the buffer was exchanged to 20 mM Na2HPO4, 300 mM NaCl, at pH 7.4 and the concentration was determined spectroscopically at 280 nm using the extinction coefficient 25,440 M-1cm-1.
Enzymatic activity assays
To characterize DHFR enzymatic activity, we measured absorbance at 340 nm to follow the disappearance of DHF substrate and NADPH cofactor over time [12]. The KM of WbDHFR for DHF was determined over a concentration range of 3.8 to 195 μM DHF, at 25°C, in MTEN buffer (50 mM 2-morpholinoethane sulphonic acid (MES), 25 mM Tris, 25 mM ethanolamine, 100 mM NaCl, and 1mM DTT) at pH 6.0. Initial velocity was plotted as a function of DHF concentration using KaleidaGraph and the Michaelis-Menten equation was fitted to the data. Catalytic activities of WbDHFR and BmDHFR were determined at various pH values (5.5–9.0) in MTEN buffer. The MTEN buffer used for all the reported assays has essentially a constant ionic strength at 0.15 over the pH range for which pH values were measured [13, 14]. Initial velocity was plotted as a function of pH using Excel.
Inhibition studies
Previous computational research predicted some green tea compounds to be inhibitors of BmDHFR [8]. Compounds (-)-epicatechin, (-)-epicatechin gallate, and vitexin were tested as inhibitors of WbDHFR and BmDHFR. The compounds (-)-epicatechin and (-)-epicatechin gallate were synthesized as described previously [15]. Additionally, methotrexate, trimethoprim, pyrimethamine, aminopterin, and raltitrexed were tested as inhibitors of WbDHFR and BmDHFR. Stock solutions of aminopterin and raltitrexed were prepared in water and stock solutions of the other drugs were prepared in DMSO. Control experiments were conducted to confirm that 5% DMSO (final concentration in the experimental wells) did not affect WbDHFR and BmDHFR activity (data not shown). The concentrations of methotrexate and aminopterin were determined spectroscopically in 0.1 M NaOH at 302 nm using an extinction coefficient of 22,700 M-1cm-1. Enzyme activity was measured in wells (200 μL) with 12.5 nM WbDHFR or 40 nM BmDHFR and 100 μM NADPH and 50 μM DHF in MTEN buffer at pH 6.0 at 25°C. Disappearance of DHF and NADPH was observed by measuring absorbance at 340 nm to measure the DHFR activity in a SpectraMax M3 microplate reader. For active inhibitors, IC50 curves were generated using KaleidaGraph and the IC50 values were obtained by fitting the data to the Hill equation with Hill coefficient, nH. = 1. All experiments were completed in triplicate.
To determine the mechanism of inhibition, Dixon plots were created and analyzed for the inhibitors against WbDHFR. We determined WbDHFR activity as described above at DHF concentrations of 2 μM, 4 μM, and 8 μM in 200 μL reaction volumes. WbDHFR (6 nM) and 100 μM NADPH cofactor were included in 1 X MTEN buffer at pH 6.0. The concentrations of inhibitors in the assay were: methotrexate (0, 3.125 nM, 6.25 nM, and 12.5 nM), trimethoprim (0, 10 μM, 20 μM, and 40 μM), pyrimethamine (0, 17.5 μM, 35 μM, and 70 μM), aminopterin (0, 3 nM, 6 nM, 12 nM), and raltitrexed (0, 5 μM, 10 μM, and 20 μM). The reciprocal initial velocities were plotted against inhibitor concentration for each substrate in Excel to create the Dixon plots. Substrate trend-lines were extended to calculate the intersection point,–KI. Each Dixon plot was generated in triplicate.
Results
Design and subcloning of a WbDHFR gene into a bacterial expression vector
The Uniprot entry J9F199-1 predicts a 172 amino acid DHFR protein for Wb. Alignment of this sequence to the previously described BmDHFR [12], however, shows that this WbDHFR sequence lacks a crucial 13 amino acid loop that is conserved across a number of DHFR proteins from different species (data not shown). The presence of the loop in WbDHFR can be supported by a noncanonical splicing event (data not shown) and the loop sequence was therefore included in the gene design.
Expression and purification of WbDHFR
To make in vitro studies of WbDHFR possible, a protocol was developed for expression and purification of WbDHFR using Ni-NTA resin; approximately 0.9 mg protein / 1 L of culture was obtained (Fig 1). Attempting to purify WbDHFR using the protocol previously developed for BmDHFR[12] resulted in protein with larger molecular weight impurities. To obtain WbDHFR of increased purity, the imidazole concentration in the wash buffer was changed from 25 mM to 100 mM. With this modification, we were able to successfully purify WbDHFR (Fig 1).
Fig 1. SDS-PAGE gel of WbDHFR protein after purification and concentration.
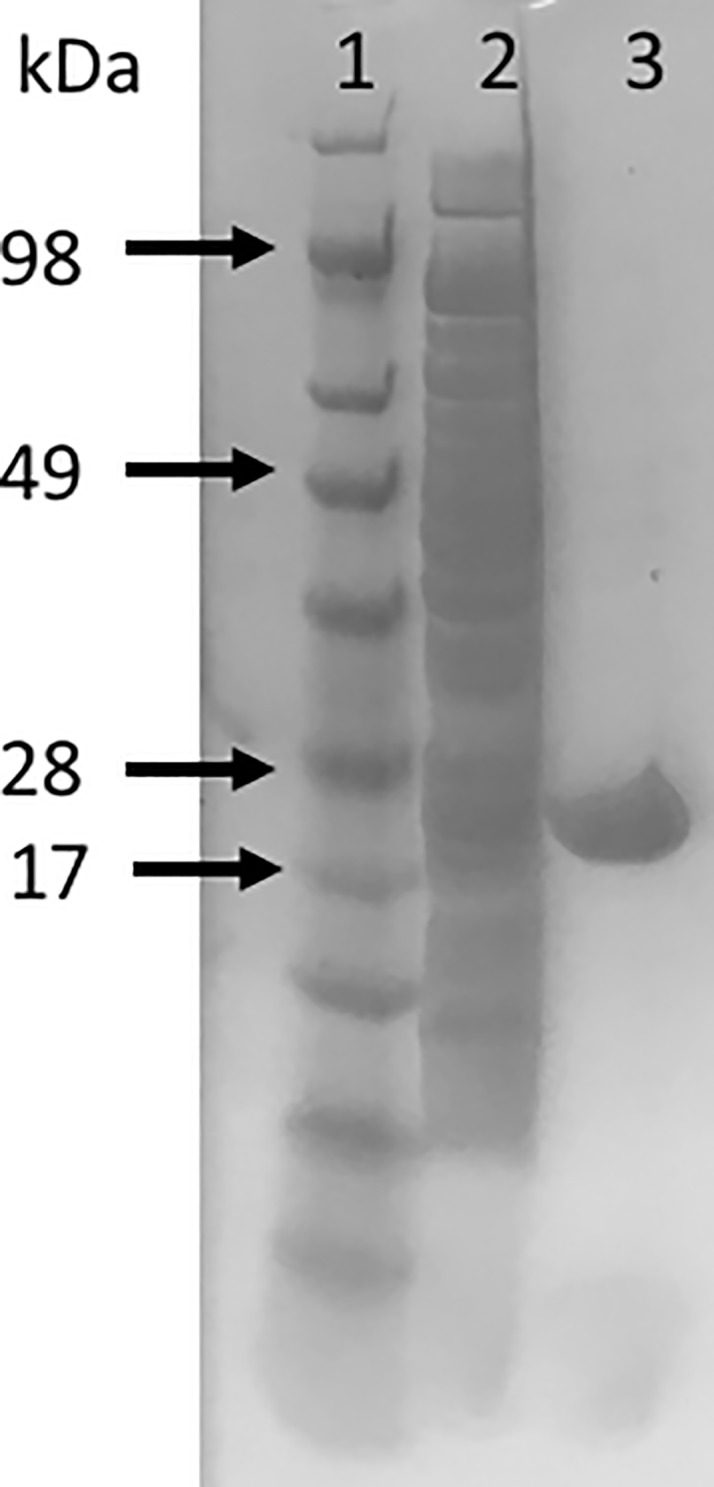
Lane 1: SeeBlue Plus2 Pre-stained Protein Standard (Novex); Lane 2: Column flow through; Lane 3: Purified WbDHFR (8.25 μg).
Kinetic characterization of WbDHFR
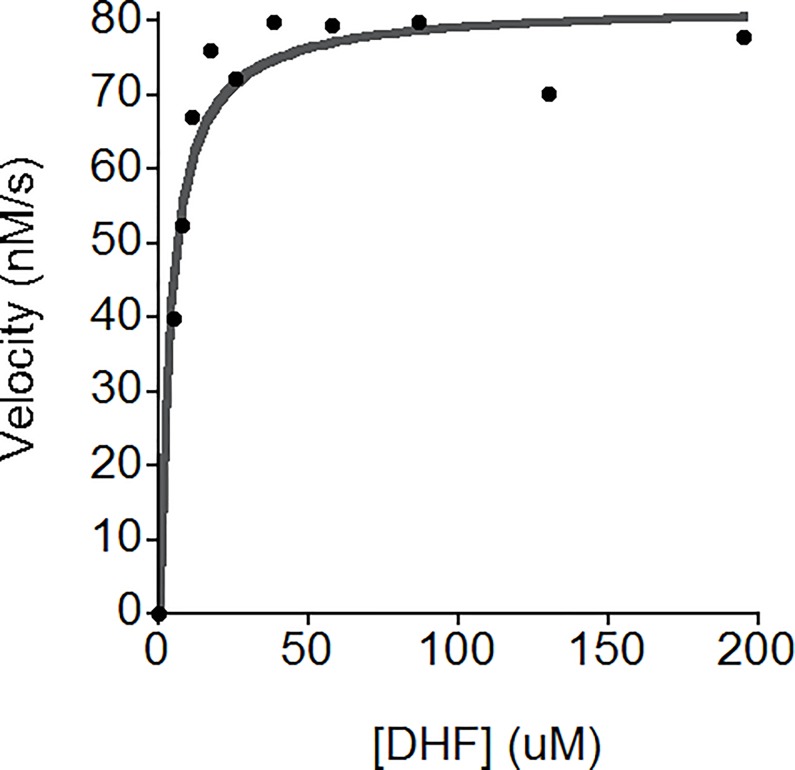
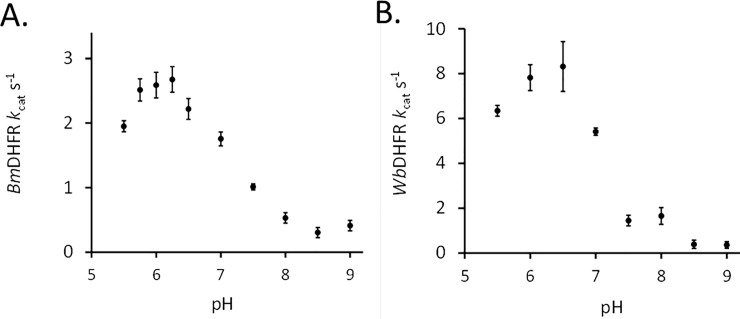
Kinetic characterization of WbDHFR revealed a catalytic activity of 7.4 ± 0.6 s-1 (S.E) at pH 6. This kcat is higher than what was found for BmDHFR, 2.2 ± 0.2 s-1 (S.E.), at the same pH value. The KM found for DHF and WbDHFR, 3.7 ± 2.0 μM (S.D., Fig 2), is lower compared to the KM value previously determined for BmDHFR (14.7 ± 3.6 μM); data for individual trials is included in S1 Table [12]. The activity versus pH profile of WbDHFR was found to be similar to that of BmDHFR (Fig 3). The different y-axis values in the two profiles indicate that WbDHFR catalyzes the reaction faster than BmDHFR at optimal pH values.
Fig 2. Representative Michaelis-Menten curve.
The conditions in the experimental wells (200 μL) were 100 μM NADPH, 12.4 nM WbDHFR in 1 X MTEN buffer at pH 6.0 with DHF concentrations ranging from 0 to 195 μM. The Michaelis-Menten equation was fitted to the data using KaleidaGraph. The Michaelis-Menten constant for DHF was determined by averaging values from fitting three separate data sets and found to be 3.7 ± 2.0 μM (S.D.).
Fig 3.
The pH based activity curve for WbDHFR (A.) and BmDHFR (B.). Enzyme concentrations in the wells were 11 nM WbDHFR and 37 nM BmDHFR. The wells also contained 100 μM NADPH, 100 μM DHF in 1 X MTEN buffer with pH values ranging from 5.5 to 9.0.
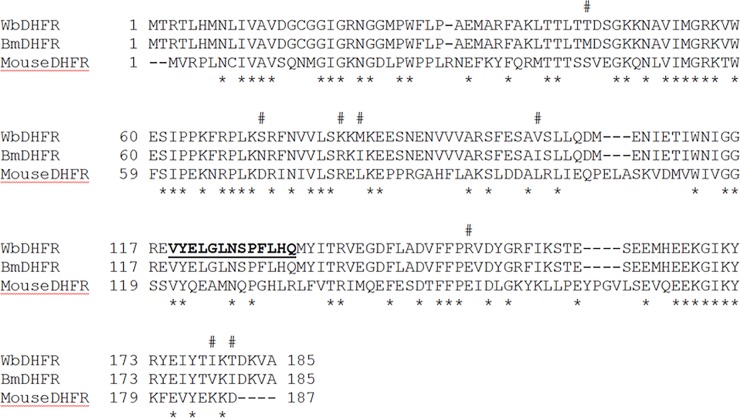
WbDHFR and BmDHFR have similar but not identical steady-state kinetic characteristics. Comparison of the WbDHFR and BmDHFR amino acid sequences shows eight residues to be different (Fig 4). There are no crystal structures available for either WbDHFR or BmDHFR and we therefore cannot directly examine the location of the residues with different sidechains. Supporting information shows the locations of the corresponding residues superimposed on a mouse DHFR structure (PDB# 1U70) (S1 Fig), which is the DHFR with the highest level of sequence identity to WbDHFR and BmDHFR and an available solved structure.
Fig 4. CLUSTAL alignment between Wb, Bm and mouse DHFRs.
The eight amino acid differences between Wb and BmDHFR are marked with #. The 13 amino acid region missing from the Uniprot entry and designed into the gene construct based on homology to the BmDHFR is shown in bold type and underlined. The *s denote identical residues conserved among the three sequences.
Inhibition profile of WbDHFR and BmDHFR
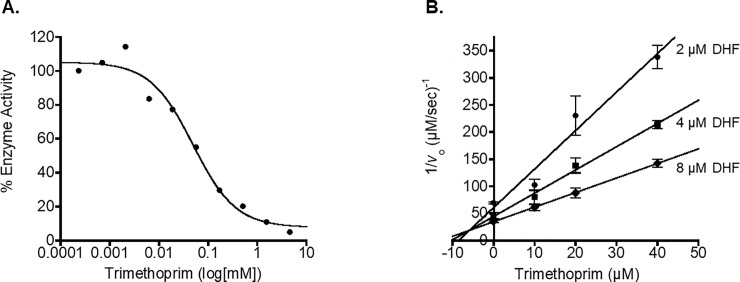
We determined IC50 values for several known antifolate and green tea compounds against BmDHFR and WbDHFR using the Hill Equation in KaleidaGraph (Table 1); data for individual values is shown in S2 Table [16]. The data show that methotrexate, trimethoprim, raltitrexed, pyrimethamine, and aminopterin inhibit WbDHFR. We did not observe inhibition for (-)-epicatechin gallate, (-)-epicatechin, or vitexin against either WbDHFR or BmDHFR. We used Dixon plots to experimentally investigate whether the five compounds that show inhibition based on IC50 values (Table 1) act as competitive inhibitors for WbDHFR. We plotted the reciprocals of the initial velocity at different substrate concentrations against inhibitor concentrations. A linear equation was fitted to the data at each substrate concentration. The resulting lines for all inhibitors tested crossed in the top left quadrant, indicating a competitive inhibition mechanism (Fig 5 and S3 Fig) [17]. The negative x-axis values of the point of intersection of the lines for all pairs of individual lines were determined and the average of these values was used to obtain the KI values listed in Table 1; each experiment was conducted in triplicate and the standard deviations are shown and values from individual trials are shown in S3 Table. The KI values for BmDHFR in Table 1 were obtained using the Cheng-Prusoff Equation [18]. For the two tight-binding inhibitors aminopterin and methotrexate against BmDHFR, a modification of the Cheng-Prusoff Equation for competitive inhibition for tightly bound inhibitors was needed and we report an upper limit for the KI values [19, 20]. Inhibitor structures are shown in supporting information (S2 Fig). Most inhibitors that were tested have similar IC50 and KI values towards both nematode homologs but pyrimethamine inhibits BmDHFR with a KI value of 3.6 ± 1.5 μM while this drug binds WbDHFR four-times less tightly with a KI of 15 ± 6 μM. These data suggest similarities but also subtle differences in the active sites of the two enzymes that have only eight different amino acids in their sequences.
Table 1. IC50 values for compounds tested against BmDHFR and WbDHFR.
| IC50 (μM) | KI (μM) | |||
|---|---|---|---|---|
| Compounds | BmDHFR | WbDHFR | BmDHFR | WbDHFR |
| Methotrexate | 0.0022 ± 0.0014 | 0.018 ± 0.003 | <0.0005 ± 0.0003 | 0.0007 ± 0.0001 |
| Trimethoprim | 65 ± 13 | 83 ± 25 | 15 ± 3 | 5.98 ± 0.06 |
| Raltitrexed | 7.3 ± 0.2 | 18 ± 10 | 1.6 ± 0.04 | 2 ± 1 |
| Pyrimethamine | 16 ± 7 | 454 ± 37 | 3.6 ± 1.5 | 15 ± 6 |
| Aminopterin | 0.0075 ± 0.0003 | 0.014 ± 0.005 | <0.0017 ± 0.0001 | 0.0021 ± 0.0005 |
| (-)-Epicatechin gallate | >1000 | >1000 | NA | NA |
| (-)-Epicatechin | >2500 | >2500 | NA | NA |
| Vitexin | >240 | >240 | NA | NA |
The values are averages from triplicates with standard deviations shown. The experiments for each compound and enzyme were conducted at pH 6.0, at room temperature, with 100 μM NADPH, 50 μM DHF, and 40 nM BmDHFR or 12.1 nM WbDHFR in a side-by-side format, using the same solutions. The IC50 values were obtained using the Hill Equation in KaleidaGraph. The KI values for WbDHFR were obtained from Dixon plots (Fig 5 and S3 Fig) by evaluating the initial velocity against varying concentrations of inhibitor and DHF. The KI values for BmDHFR were obtained using the Cheng-Prusoff Equation.
Fig 5.
Representative IC50 curve (A.) and Dixon plot (B.) for trimethoprim. The inhibition experiments were carried out at 25°C in 1 X MTEN buffer at pH 6.0. The WbDHFR activity was assessed by monitoring the disappearance of NADPH and DHF at 340 nm over time. To obtain the IC50 (Panel A.), 100 μM NADPH, 50 μM DHF, 12 nM WbDHFR, and trimethoprim ranging from 0.2 nM to 4.7 mM were mixed in a total volume of 200 μL. The experiment was conducted in triplicate and a representative plot is shown. The Hill Equation was used to determine the IC50 values for trimethoprim and the average of the three values was 83 ± 25 μM. The Dixon plot (Panel B.) was generated by evaluating the initial velocity against varying concentrations of Trimethoprim and DHF. DHF concentrations of 2 μM, 4 μM, and 8μM and trimethoprim concentrations of 0 μM, 10 μM, 20 μM, and 40 μM were used in the assays. The velocities for each DHF concentration were plotted and the KI was calculated to be 6 ± 0.06 μM (S.D.).
The IC50 value determined here for pyrimethamine for BmDHFR is different compared to the previously determined value of the same drug against the same enzyme: 15.6 ± 6.6 μM found now versus 109 ± 34 μM found previously [12]. To verify the drug stock concentration in the current study, the extinction coefficient for pyrimethamine was determined to be 6.7 ± 0.8 mM-1 cm-1 at 268 nm in 1 X MTEN at pH 6.0.
Comparison of current data to previous computational predictions
The data agrees with some of the computational predictions by Hande and coworkers [8]; for example, they authors predicted that trimethoprim would inhibit BmDHFR with a KI of 11 μM and we found the KI of trimethoprim to be 15 μM against BmDHFR. On the other hand, vitexin was predicted to be a 465 nM inhibitor of BmDHFR, but in our assays we did not observe any inhibition for vitexin against BmDHFR (Table 1). Similarly, (-)-epicatechin and (-)-epicatechin gallate were predicted to have KI values of 76 μM and 48 μM against BmDHFR[8] but neither compound showed any inhibitory activity against BmDHFR or WbDHFR, even at concentrations greater than 10 mM. We also examined other compounds that are structurally related to (-)-epicatechin and (-)-epicatechin gallate and observed similar results. As the authors state themselves, the computational predictions must be interpreted with caution due to a lack of a crystal structure for any of the filarial parasite DHFRs.
Discussion
We found that the Uniprot entry J9F199-1 for WbDHFR lacks a crucial 13 amino acid loop. WbDHFR, consisting of 185 amino acids (Fig 4), was successfully designed and subcloned into the pET25b expression vector and expressed in LOBSTR E. coli cells using a modified version of a protocol previously developed for BmDHFR. The methods that were developed to purify active WbDHFR for in vitro studies will facilitate the testing of additional antifolate compounds as potential inhibitors in the treatment of filariasis.
Well known antifolates, methotrexate and trimethoprim, were found to inhibit WbDHFR with KI values of 1.2 ± 0.2 nM and 6 ± 0.06 μM, respectively. These KI values are significantly different from those of methotrexate and trimethoprim against human DHFR (40 pM and 1.38 μM, respectively) [21], indicating that there are differences in the inhibitor binding of the human DHFR compared to the parasite homologs that will likely enable discovery of selective inhibitors. These data suggest that repurposing of known antifolate compounds can be an effective approach for the treatment of filariasis. The expression, purification and basic kinetic analysis of WbDHFR we publish here make it possible to test other synthetic molecules proven to act on DHFRs from other organisms as inhibitors of WbDHFR. BmDHFR and WbDHFR have similar kinetic and inhibition parameters; 177 of the 185 amino acid residues are conserved (Fig 4, S1 Fig). We are currently working toward obtaining an x-ray crystal structure of WbDHFR with an inhibitor and NADPH bound. Such a structure will further facilitate the development of antifolate compounds in the treatment of filariasis. Most of the antifolates that were tested, including those with lower IC50 values, inhibit the two homologs similarly, suggesting the possibility that one DHFR inhibitor could be used to treat both filarial parasites. Such an approach would be helpful in resource-poor settings where the infrastructure to determine which parasitic infection is present is not available.
Supporting information
Cofactor NADPH (left) and methotrexate (right) are shown as black lines. Methotrexate is located in the inhibitor binding site. The residue positions corresponding to those positions that have different amino acid residues present in the BmDHFR and WbDHFR sequences are indicated as black spheres (See Fig 4 of the research article). Numbering of these residues in the figure is based on mouse DHFR sequence. This figure was created using Chimera.(Pettersen E.F., et. al. 2004. UCSF Chimera—a visualization system for exploratory research and analysis. J. Comput. Chem. 13, 1605–12.)
(TIF)
Structures were drawn with ChemDraw.
(TIFF)
Dixon Plots for methotrexate (A.), raltitrexed (B.), pyrimethamine (C.), and aminopterin (D.) for WbDHFR. All reactions were performed at 25°C in 1 X MTEN buffer at pH 6.0. The concentration of WbDHFR and NADPH were kept constant at 6 nM and 100 μM, respectively. DHF concentrations of 2, 4, and 8 μM were used. All experiments were performed in triplicate. The plots were generated in Excel. The KI values are shown in S1 Table. Data for trimethoprim is shown in Fig 5.
(TIF)
(DOCX)
(DOCX)
(DOCX)
Acknowledgments
We thank the Montclair State University Science Honors Innovation Program (SHIP) and the Separately Budgeted Research Program for funding. We thank Professor John Siekierka and Tamara Kreiss for valuable discussions and technical advice and Bayan Hassan for technical assistance.
Data Availability
All relevant data are within the paper and its Supporting Information files.
Funding Statement
The authors thank the American Society of Biochemistry and Molecular Biology (ASBMB) for providing funds for lab supplies (AMT, KL). We thank the Montclair State University Science Honors Innovation Program (SHIP) for paying author Andrew Tobias a summer research stipend and for funds for lab supplies, and the Separately Budgeted Research Program for funding (AMT, KL). The funders had no role in study design, data collection and analysis, decision to publish, or preparation of the manuscript.
References
- 1.Organization WH. Lymphatic Filariasis Fact Sheet 2017, viewed July 13, 2017, http://www.who.int/mediacentre/factsheets/fs102/en/.
- 2.Ramaiah KD, Ottesen EA. Progress and impact of 13 years of the global programme to eliminate lymphatic filariasis on reducing the burden of filarial disease. PLoS Negl Trop Dis. 2015;8(11):e3319 Epub 2014/11/21. doi: 10.1371/journal.pntd.0003319 PNTD-D-14-00966 [pii]. . [DOI] [PMC free article] [PubMed] [Google Scholar]
- 3.Goodey NM, Alapa MT, Hagmann DF, Korunow SG, Mauro AK, Kwon KS, et al. Development of a fluorescently labeled thermostable DHFR for studying conformational changes associated with inhibitor binding. Biochem Biophys Res Commun. 2011;413(3):442–7. Epub 2011/09/13. doi: S0006-291X(11)01533-6 [pii] doi: 10.1016/j.bbrc.2011.08.115 . [DOI] [PubMed] [Google Scholar]
- 4.Goodey NM, Benkovic SJ. Allosteric regulation and catalysis emerge via a common route. Nat Chem Biol. 2008;4(8):474–82. Epub 2008/07/22. doi: nchembio.98 [pii] doi: 10.1038/nchembio.98 . [DOI] [PubMed] [Google Scholar]
- 5.Myllykallio H, Leduc D, Filee J, Liebl U. Life without dihydrofolate reductase FolA. Trends Microbiol. 2003;11(5):220–3. [DOI] [PubMed] [Google Scholar]
- 6.Schweitzer BI, Dicker AP, Bertino JR. Dihydrofolate reductase as a therapeutic target. FASEB J. 1990;4(8):2441–52. [DOI] [PubMed] [Google Scholar]
- 7.Lamb KM, G-Dayanandan N, Wright DL, Anderson AC. Elucidating features that drive the design of selective antifolates using crystal structures of human dihydrofolate reductase. Biochemistry. 2013;52(41):7318–26. doi: 10.1021/bi400852h [DOI] [PMC free article] [PubMed] [Google Scholar]
- 8.Hande S, Goswami K, Sharma R, Bhoj P, Jena L, Reddy MV. Targeting folate metabolism for therapeutic option: A bioinformatics approach. Indian J Exp Biol. 2015;53:762–6. [PubMed] [Google Scholar]
- 9.Sharma RD, Bag S, Tawari NR, Degani MS, Goswami K, Reddy MVR. Exploration of 2, 4-diaminopyrimidine and 2, 4-diamino-s-triazine derivatives as potential antifilarial agents. Parasitology. 2013;140(08):959–65. [DOI] [PubMed] [Google Scholar]
- 10.Sharma M, Chauhan PMS. Dihydrofolate reductase as a therapeutic target for infectious diseases: opportunities and challenges. Future MedChem. 2012;4(10):1335–65. [DOI] [PubMed] [Google Scholar]
- 11.Bag S, Tawari NR, Sharma R, Goswami K, Reddy MVR, Degani MS. In vitro biological evaluation of biguanides and dihydrotriazines against Brugia malayi and folate reversal studies. Acta Tropica. 2010;113(1):48–51. doi: 10.1016/j.actatropica.2009.09.004 [DOI] [PubMed] [Google Scholar]
- 12.Perez-Abraham R, Sanchez KG, Alfonso M, Gubler U, Siekierka JJ, Goodey NM. Expression, purification and enzymatic characterization of Brugia malayi dihydrofolate reductase. Protein Expr Purif. 2016;128:81–5. doi: 10.1016/j.pep.2016.08.012 . [DOI] [PubMed] [Google Scholar]
- 13.Ellis KJ, Morrison JF. [23] Buffers of constant ionic strength for studying pH-dependent processes. Methods in enzymology. 87: Elsevier; 1982. p. 405–26. [DOI] [PubMed] [Google Scholar]
- 14.Stone SR, Morrison JF. Catalytic mechanism of the dihydrofolate reductase reaction as determined by pH studies. Biochemistry. 1984;23(12):2753–8. [DOI] [PubMed] [Google Scholar]
- 15.Bhat R, Adam AT, Lee JJ, Gasiewicz TA, Henry EC, Rotella DP. Towards the discovery of drug-like epigallocatechin gallate analogs as Hsp90 inhibitors. Bioorg Med Chem Lett. 2014;24(10):2263–6. doi: 10.1016/j.bmcl.2014.03.088 PubMed PMID: WOS:000335517300007. [DOI] [PubMed] [Google Scholar]
- 16.Hill AV. The possible effects of the aggregation of the molecules of haemoglobin on its dissociation curves. J Physiol (Lond). 1910;40:4–7. [Google Scholar]
- 17.Butterworth PJ. The use of Dixon plots to study enzyme inhibition. Biochimica et Biophysica Acta (BBA)-Enzymology. 1972;289(2):251–3. [DOI] [PubMed] [Google Scholar]
- 18.Cheng Y-C, Prusoff WH. Relationship between the inhibition constant (Ki) and the concentration of inhibitor which causes 50 percent inhibition (IC50) of an enzymatic reaction. Biochem Pharmacol. 1973;22(23):3099–108. [DOI] [PubMed] [Google Scholar]
- 19.Cer RZ, Mudunuri U, Stephens R, Lebeda FJ. IC 50-to-K i: a web-based tool for converting IC 50 to K i values for inhibitors of enzyme activity and ligand binding. Nucleic acids research. 2009;37(suppl_2):W441–W5. [DOI] [PMC free article] [PubMed] [Google Scholar]
- 20.Copeland RA, Lombardo D, Giannaras J, Decicco CP. Estimating Ki values for tight binding inhibitors from dose-response plots. Bioorg Med Chem Lett. 1995;5(17):1947–52. [Google Scholar]
- 21.Goodey NM, Herbert KG, Hall SM, Bagley KC. Prediction of residues involved in inhibitor specificity in the dihydrofolate reductase family. Biochim Biophys Acta (BBA)-Proteins and Proteomics. 2011;1814(12):1870–9. [DOI] [PubMed] [Google Scholar]
Associated Data
This section collects any data citations, data availability statements, or supplementary materials included in this article.
Supplementary Materials
Cofactor NADPH (left) and methotrexate (right) are shown as black lines. Methotrexate is located in the inhibitor binding site. The residue positions corresponding to those positions that have different amino acid residues present in the BmDHFR and WbDHFR sequences are indicated as black spheres (See Fig 4 of the research article). Numbering of these residues in the figure is based on mouse DHFR sequence. This figure was created using Chimera.(Pettersen E.F., et. al. 2004. UCSF Chimera—a visualization system for exploratory research and analysis. J. Comput. Chem. 13, 1605–12.)
(TIF)
Structures were drawn with ChemDraw.
(TIFF)
Dixon Plots for methotrexate (A.), raltitrexed (B.), pyrimethamine (C.), and aminopterin (D.) for WbDHFR. All reactions were performed at 25°C in 1 X MTEN buffer at pH 6.0. The concentration of WbDHFR and NADPH were kept constant at 6 nM and 100 μM, respectively. DHF concentrations of 2, 4, and 8 μM were used. All experiments were performed in triplicate. The plots were generated in Excel. The KI values are shown in S1 Table. Data for trimethoprim is shown in Fig 5.
(TIF)
(DOCX)
(DOCX)
(DOCX)
Data Availability Statement
All relevant data are within the paper and its Supporting Information files.


