There are errors in Figs 1–5. There are also errors in Table 3 and Table 4. The corrected figures and tables are based on the NCEP Adult Treatment Panel III (ATPIII panel). Please see the correct Figs 1–5 and the correct Table 3 and Table 4 below.
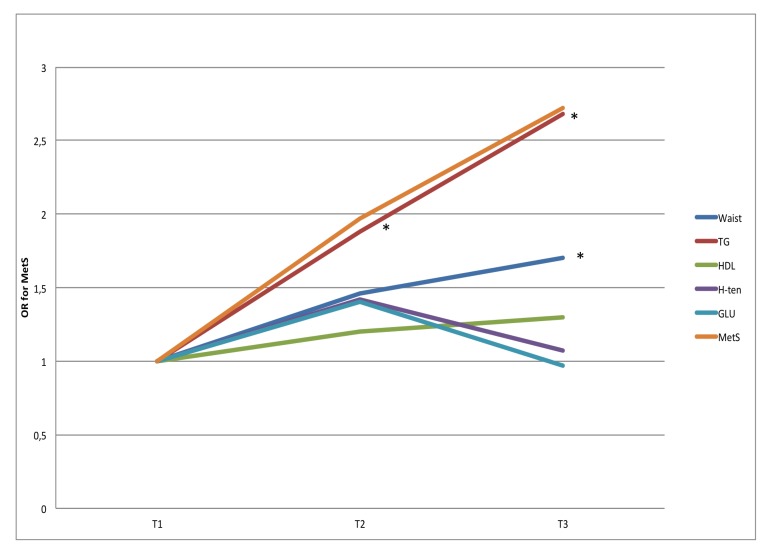
Fig 1. OR for MetS for tertiles of sedentary time.
ORs are adjusted for gender, age, education level (university degree vs. not), energy intake (kcal·d-1 in quartiles), smoking habits (regular smoker vs. not) and psycho-social stress (self-reported into four levels), estimated VO2max (ml·min-1·kg-1, in tertiles) and % of wear time spent in MVPA (in tertiles). * Denotes significant difference to reference group.
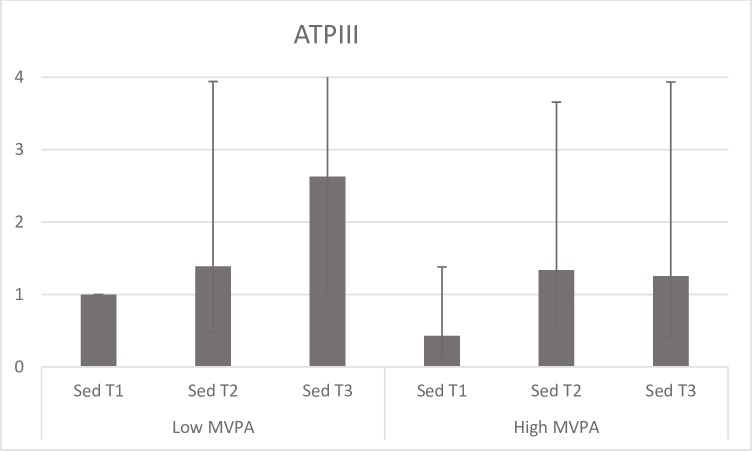
Fig 5. Stratified analysis across SED tertiles in high (above median) and low (below median) MVPA.
ORs are adjusted for gender, age (yrs.), education level (university degree vs. not), energy intake (kcal·d-1, in quartiles), smoking habits (regular vs. not), psychosocial stress (self-reported into four levels) and fitness (in tertiles).
Table 3. Analyzed using ATPIII-cutoffs for uniaxial accelerometry.
| Tertile 2 | Tertile 3 | |||
|---|---|---|---|---|
| Fitness | n | |||
| Age-gender | 784 | 0.50 (0.31–0.74) | 0.09 (0.04–0.18) | |
| +Lifestyle | 709 | 0.41 (0.26–0.67) | 0.08 (0.04–0.18) | |
| +SED | 630 | 0.46 (0.27–0.79) | 0.11 (0.05–0.29) | |
| +MVPA | 630 | 0.50 (0.29–0.86) | 0.12 (0.05–0.28) | |
| +SED and MVPA | 630 | 0.49 (0.29–0.85) | 0.12 (0.05–0.29) | |
| Accelerometry | ||||
| SED | Age-gender | 932 | 1.32 (0.85–2.07) | 1.83 (1.19–2.81) |
| +Lifestyle | 831 | 1.59 (0.97–2.61) | 2.37 (1.47–3.83) | |
| +MVPA | 831 | 1.37 (0.82–2.26) | 1.80 (1.09–2.96) | |
| +Fitness | 630 | 1.74 (0.89–3.42) | 2.45 (1.26–4.79) | |
| +MVPA and Fitness | 630 | 1.55 (0.78–3.10) | 1.90 (0.95–3.89) | |
| LIPA | Age-gender | 932 | 0.85 (0.57–1.27) | 0.72 (0.47–1.11) |
| +Lifestyle | 831 | 0.76 (0.49–1.16) | 0.56 (0.35–0.90) | |
| +MVPA | 831 | 0.81 (0.53–1.26) | 0.61 (0.38–0.98) | |
| +Fitness | 630 | 0.92 (0.53–1.61) | 0.52 (0.27–1.01) | |
| +MVPA and Fitness | 630 | 0.97 (0.55–1.71) | 0.52 (0.26–1.02) | |
| MVPA | Age-gender | 932 | 0.33 (0.21–0.50) | 0.31 (0.20–0.47) |
| +Lifestyle | 831 | 0.34 (0.22–0.54) | 0.33 (0.21–0.52) | |
| +SED | 831 | 0.36 (0.23–0.57) | 0.39 (0.24–0.63) | |
| +Fitness | 630 | 0.26 (0.14–0.50) | 0.31 (0.17–0.57) | |
| +SED and Fitness | 630 | 0.28 (0.14–0.53) | 0.36 (0.19–0.67) | |
| TPA | Age-gender | 932 | 0.36 (0.23–0.54) | 0.35 (0.23–0.54) |
| +Lifestyle | 831 | 0.34 (0.21–0.53) | 0.32 (0.22–0.55) | |
| +SED | 831 | 0.37 (0.22–0.60) | 0.40 (0.23–0.71) | |
| +MVPA | 831 | 0.46 (0.27–0.77) | 0.68 (0.32–1.44) | |
| +Fitness | 630 | 0.42 (0.23–0.76) | 0.33 (0.17–0.62) | |
| +SED, MVPA and Fitness | 630 | 0.84 (0.38–1.84) | 1.31 (0.39–4.46) | |
| SED bouts | Age-gender | 930 | 1.07 (0.68–1.70) | 1.73 (1.41–2.64) |
| +Lifestyle | 831 | 1.20 (0.74–1.95) | 2.21 (1.40–3.49) | |
| +MVPA | 831 | 1.09 (0.67–1.80) | 1.81 (1.13–2.90) | |
| +Fitness | 630 | 0.96 (0.50–1.86) | 1.97 (1.06–3.64) | |
| +MVPA and Fitness | 630 | 0.92 (0.47–1.81) | 1.67 (0.89–3.15) | |
| SED breaks | Age-gender | 932 | 0.74 (0.50–1.11) | 0.61 (0.40–0.93) |
| +Lifestyle | 831 | 0.63 (0.41–0.98) | 0.50 (0.31–0.80) | |
| +MVPA | 831 | 0.69 (0.44–1.07) | 0.56 (0.35–0.91) | |
| +Fitness | 630 | 0.61 (0.34–1.09) | 0.54 (0.28–1.03) | |
| +MVPA and Fitness | 630 | 0.68 (0.38–1.23) | 0.56 (0.29–1.09) |
Table 4. Analyzed using ATPIII-cutoffs for triaxial accelerometry.
| Tertile 2 | Tertile 3 | |||
|---|---|---|---|---|
| Fitness | n | |||
| Age-gender | 784 | 0.50 (0.31–0.74) | 0.09 (0.04–0.18) | |
| +Lifestyle | 709 | 0.41 (0.26–0.67) | 0.08 (0.04–0.18) | |
| +SED | 633 | 0.51 (0.30–0.86) | 0.11 (0.05–0.27) | |
| +MVPA | 633 | 0.49 (0.29–0.83) | 0.12 (0.05–0.27) | |
| +SED and MVPA | 633 | 0.51 (0.30–0.88) | 0.12 (0.05–0.28) | |
| Accelerometry | ||||
| SED | Age-gender | 938 | 1.28 (0.80–2.03) | 2.47 (1.60–3.83) |
| +Lifestyle | 835 | 1.40 (0.83–2.35) | 3.15 (1.95–5.10) | |
| +MVPA | 835 | 1.24 (0.73–2.11) | 2.45 (1.46–4.12) | |
| +Fitness | 633 | 2.23 (1.09–4.58) | 3.53 (1.76–7.09) | |
| +MVPA and Fitness | 633 | 1.97 (0.95–4.11) | 2.72 (1.31–5.63) | |
| LIPA | Age-gender | 938 | 0.56 (0.37–0.83) | 0.50 (0.33–0.77) |
| +Lifestyle | 835 | 0.49 (0.32–0.75) | 0.37 (0.23–0.59) | |
| +MVPA | 835 | 0.54 (0.35–0.84) | 0.42 (0.26–0.68) | |
| +Fitness | 633 | 0.63 (0.36–1.10) | 0.40 (0.21–0.77) | |
| +MVPA and Fitness | 633 | 0.71 (0.40–1.26) | 0.42 (0.22–0.81) | |
| MVPA | Age-gender | 938 | 0.43 (0.29–0.65) | 0.39 (0.26–0.59) |
| +Lifestyle | 835 | 0.44 (0.28–0.69) | 0.32 (0.24–0.60) | |
| +SED | 835 | 0.52 (0.33–0.83) | 0.55 (0.33–0.90) | |
| +Fitness | 633 | 0.43 (0.24–0.79) | 0.36 (0.19–0.66) | |
| +SED and Fitness | 633 | 0.51 (0.28–0.95) | 0.47 (0.24–0.90) | |
| TPA | Age-gender | 930 | 0.36 (0.25–0.55) | 0.35 (0.23–0.54) |
| +Lifestyle | 835 | 0.56 (0.36–0.86) | 0.33 (0.20–0.53) | |
| +SED | 835 | 0.76 (0.46–1.24) | 0.58 (0.30–1.12) | |
| +MVPA | 835 | 0.65 (0.40–1.08) | 0.44 (0.22–0.90) | |
| +Fitness | 633 | 0.58 (0.33–1.02) | 0.32 (0.16–0.62) | |
| +SED, MVPA and Fitness | 633 | 1.31 (0.57–2.99) | 1.42 (0.39–5.21) | |
| SED bouts | Age-gender | 930 | 1.06 (0.68–1.66) | 1.73 (1.14–2.63) |
| +Lifestyle | 835 | 1.16 (0.71–1.89) | 2.24 (1.42–3.53) | |
| +MVPA | 835 | 1.08 (0.66–1.76) | 1.79 (1.12–2.87) | |
| +Fitness | 633 | 1.35 (0.70–2.58) | 2.30 (1.22–4.32) | |
| +MVPA and Fitness | 633 | 1.27 (0.66–2.49) | 1.80 (0.93–3.48) | |
| SED breaks | Age-gender | 938 | 0.74 (0.50–1.10) | 0.52 (0.34–0.81) |
| +Lifestyle | 835 | 0.66 (0.43–1.02) | 0.47 (0.29–0.75) | |
| +MVPA | 835 | 0.76 (0.49–1.17) | 0.55 (0.34–0.88) | |
| +Fitness | 633 | 0.85 (0.48–1.52) | 0.54 (0.29–1.02) | |
| +MVPA and Fitness | 633 | 1.06 (0.58–1.92) | 0.65 (0.34–1.24) |
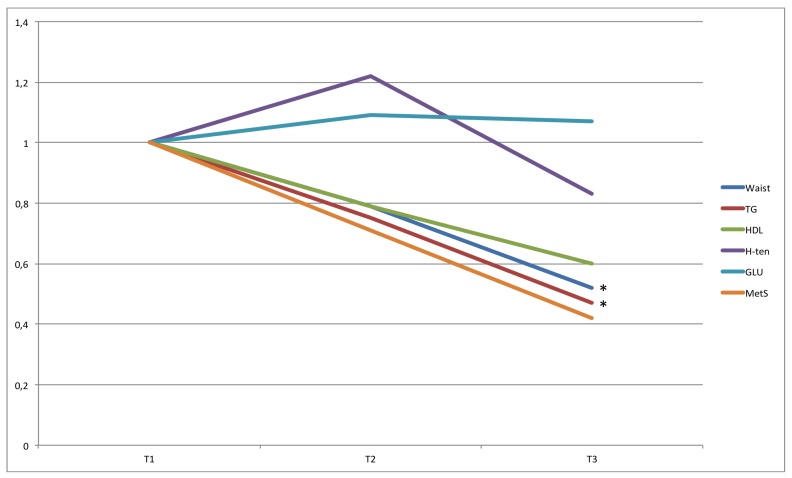
Fig 2. OR for MetS for tertiles of time in LIPA.
ORs are adjusted for gender, age, education level (university degree vs. not), energy intake (kcal·d-1 in quartiles), smoking habits (regular smoker vs. not) and psycho-social stress (self-reported into four levels), % of wear time spent in MVPA (in tertiles), and estimated VO2max (ml·min-1·kg-1, in tertiles). * Denotes significant difference to reference group.
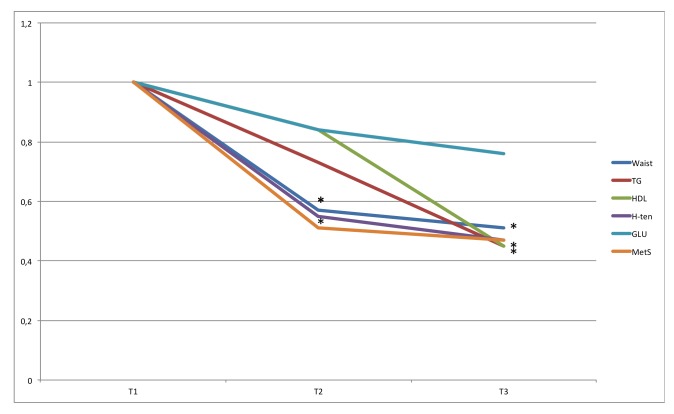
Fig 3. OR for MetS for tertiles of time in MVPA.
ORs are adjusted for gender, age, education level (university degree vs. not), energy intake (kcal·d-1 in quartiles), smoking habits (regular smoker vs. not) and psycho-social stress (self-reported into four levels), % of wear time spent in SED (in tertiles), and estimated VO2max (ml·min-1·kg-1, in tertiles). * Denotes significant difference to reference group.
Fig 4. OR for MetS for tertiles of fitness.
ORs are adjusted for gender, age, education level (university degree vs. not), energy intake (kcal·d-1 in quartiles), smoking habits (regular smoker vs. not) and psycho-social stress (self-reported into four levels), % of wear time spent in SED (in tertiles), and % of wear time spent in MVPA (in tertiles). * Denotes significant difference to reference group.
Reference
- 1.Ekblom Ö, Ekblom-Bak E, Rosengren A, Hallsten M, Bergström G, Börjesson M (2015) Cardiorespiratory Fitness, Sedentary Behaviour and Physical Activity Are Independently Associated with the Metabolic Syndrome, Results from the SCAPIS Pilot Study. PLoS ONE 10(6): e0131586 https://doi.org/10.1371/journal.pone.0131586 [DOI] [PMC free article] [PubMed] [Google Scholar]


