

Abstract
Aims
To assess neuronal depolarization evoked by autoantibodies in diabetic depression compared to depolarization evoked by autoantibodies in control patients. To determine whether a subset of severe (late-onset) diabetic complications may be mediated in part by toxic immunoglobulin light chains that may increase in diabetic nephropathy.
Methods
Protein-A eluates from plasma of 21 diabetic depression patients and 37 age-matched controls were tested for depolarization in hippocampal or immature neurons. Subsets of depolarizing or non-depolarizing autoantibodies were tested for neurite outgrowth inhibition in N2A neuroblastoma cells or the ability to modulate Ca2+ release in HL-1 atrial cardiomyocytes or in endothelial cells. The stability of depolarizing autoantibodies was investigated by heat treatment (56°C × 30 minutes) or following prolonged exposure to the pro-protein convertase, furin. Gel filtration of active depolarizing autoantibodies was performed to determine the apparent molecular mass of peak neurotoxicity associated with the autoantibodies.
Results
Diabetic depression (n = 21) autoantibodies caused significantly greater mean depolarization in neuroblastoma cells (P < 0.01) compared to autoantibodies in diabetic (n = 15) or non-diabetic (n = 11) patients without depression. Depolarizing autoantibodies caused significantly more (P=0.011) inhibition of neurite outgrowth in neuroblastoma cells than non-depolarizing autoantibodies (n = 10) and they evoked sustained, global intracellular Ca2+ release in atrial cardiomyocytes or in endothelial cells. A subset of older diabetic patients suffering with a cluster of nephropathy, non-ischemic cardiomyopathy and/or depression demonstrated the presence of stable light chain dimers having apparent MW of 46 kD and associated with peak neurotoxicity in neuroblastoma cells.
Conclusion
These data suggest that autoantibodies in older adult diabetic depression cause long-lasting depolarization in hippocampal neurons including adult dentate gyrus neural progenitor cells. The autoantibodies may impair adult dentate gyrus neurogenesis associated with treatment-refractory depression via several mechanisms including suppression of neurite outgrowth, and alteration of membrane excitability. Stable, toxic light chain autoantibody components may contribute to a cluster of severe (late-onset) complications characterized by dysfunction in highly vascularized tissues.
Keywords: Autoantibodies, Diabetes mellitus, Depression, Neural progenitor cells, Light chains, Nephropathy
Introduction
Diabetic depression can affect up to thirty percent of older adults with type 2 diabetes mellitus [1] contributing to substantial morbidity and mortality [2]. Co-morbid micro-vascular complications are common in diabetic depression [3], yet the underlying mechanism for an association between microvascular complications and diabetic depression is unclear [4]. In a recent study, circulating endothelial cell (EC) inhibitory autoantibodies were increased in type 2 diabetic depression and they inhibited neurite outgrowth and caused decreased survival in adult dentate gyrus (DG) neural progenitor cells (NPCs) [5]. Dentate gyrus neural progenitor cells are a unique population of adult progenitor cells whose proliferation and differentiation (into mature adult DG neurons) requires excitatory synaptic inputs [6]. In a prior study, cancer fatigue/depression autoantibodies evoked long-lasting depolarization and suppressed spontaneous synaptic activity in hippocampal neurons [7]. Since dentate gyrus neural progenitor cell proliferation and maturation correlated with antidepressant treatment response(s) [8], in the present study we tested a hypothesis that diabetic depression autoantibodies may contribute to treatment-refractoriness (in part) by causing long-lasting (hippocampal) neuron depolarization.
We now report that plasma IgG autoantibodies in diabetic depression caused significantly greater neuronal depolarization than autoantibodies in diabetic or non-diabetic patients without depression. In a subset of diabetes suffering with nephropathy, non-ischemic cardiomyopathy and/or depression, depolarization and neurite-inhibition were associated with highly stable light chain component (s) capable of forming soluble dimers or oligomers. These data suggest that circulating IgG autoantibodies in diabetic depression are depolarizing and that a highly stable component associated with peak neurotoxicity had properties corresponding to kappa light chain dimers.
Subjects and Methods
Diabetic depression and control patient subgroups
Informed consent was obtained from all study patients prior to blood drawing. Patients were enrolled from the diabetes and endocrinology outpatient clinics at the Veterans Affairs New Jersey Healthcare System. Autoantibodies obtained in patients having type 2 diabetes and depressive illness (n = 21), diabetic controls without depression (n = 15) diabetic nephropathy or another pathology involving dysfunction in electrically-excitable cells, i.e. (atrial fibrillation, painful neuropathy, or schizophrenia) (n = 11) or nondiabetic controls (n = 11) were tested in neuronal depolarization assays (Table 1). Autoantibodies in five additional schizophrenia patients including two adult men with autoimmune type 1 diabetes, an adult man with type 2 diabetic nephropathy, and two non-diabetic, older adult women breast cancer survivors were tested in neurite outgrowth and endothelial cell survival assays (Table 1). The baseline clinical characteristics in the patients whose autoantibodies were tested for ability to evoke neuronal depolarization are summarized in Table 2. The other pathologies subgroup included one non-diabetic patient with painful neuropathy and atrial fibrillation. Diagnostic criteria and clinical evaluation in diabetic depression patients was previously reported [5]. Painful diabetic neuropathy is defined according to previously reported criteria [7]. Diabetic nephropathy is defined as urinary albumin excretion ≥ 300 milligrams/gram creatinine or urinary protein excretion ≥ 500 milligrams/gram creatinine.
Table 1.
Summary of autoantibodies obtained in different patient groups.
| Patient Group | Number of Patients |
|---|---|
| Neuronal depolarization assays | |
| Diabetic depression | 21 |
| Specific patients and their characteristics | |
| Pt 10- recurrent major depression & family history of depression/suicide in three successive generations | |
| Pt 5, 11- CKD, non-ischemic cardiomyopathy | |
| Diabetes without depression | 15 |
| Pt 7- CKD, non-ischemic cardiomyopathy | |
| Other Pathologies | 11 |
| Diabetic nephropathy (n = 5) | |
| Pt 8- CKD/ESRD & family history of diabetic CKD | |
| Diabetic atrial fibrillation (n = 3) | |
| Schizophrenia (n = 3), co-morbidity | |
| Type 2 diabetes (n = 1) | |
| Adult autoimmune type 1 diabetes (n = 1) | |
| Autoimmune Thyrotoxicosis (n = 1) | |
| Non-diabetic without depression | 11 |
| Neurite-outgrowth/Endothelial cell survival assays | |
| Schizophrenia, co-morbidity | 5 |
| Adult autoimmune type 1 diabetes (n = 2) | |
| Type 2 diabetic nephropathy (n = 1) | |
| Adult female breast cancer survivors (n = 2) |
CKD- chronic kidney disease; ESRD-end-stage-renal disease
Table 2.
Baseline clinical characteristics and co-morbidities in study patients.
| Risk factor | Diab Depression (n = 21) |
Diabetic control (n = 15) |
Diab Neph/Other Pathology (n = 11) |
Non-diab control (n = 11) |
|---|---|---|---|---|
| Age (years) | 69.3 ± 3.9 | 69 ± 10.1 | 66.1 ± 10.4 | 60.7 ± 14.6 |
| BMI (kg/m2) | 34.8 ± 8.3* | 29.3 ± 6.1 | 36.0 ± 8.4* | 28.5 ± 4.2 |
| HbA1C (%) | 8.7 ± 1.6* | 7.7 ± 1.0 | 7.6 ± 1.7 | NT |
| Nephropathy (%) | 38ˆ | 0 | 64 | 0 |
| Atrial Fib (%) | 19 | 11 | 36 | 9 |
| Painful Neur (%) | 67ˆ | 21 | 27 | 9 |
| Insulin use (%) | 76 | 47 | 73 | 0 |
P< 0.05 from T-test,
P< 0.05 from X2 test;
comparing Diabetic Depression or Diabetic Nephropathy and Other Pathologies to Diabetic control group; HbA1c- glycosylated hemoglobin; BMI- body mass index. Atrial Fibrillation; Painful Neuropathy; NT- not tested.
Non-ischemic cardiomyopathy and kidney disease
Pt 5
A 68-year-old Caucasian male (with family history of Alzheimer’s dementia) who suffered with atrial fibrillation requiring pacemaker placement, hypertension, diabetic nephropathy (300 milligram protein/gram creatinine, estimated glomerular filtration rate (eGFR) 38 mL/min/1.73 m2), painful neuropathy, depression and multiple vague complaints including unexplained joint pain, bouts of extreme muscular weakness and unexplained dyspnea on exertion. Estimated glomerular filtration rate was stable over a two-year period of observation and the patient died of unknown causes.
Pt 7
A 64-year-old Caucasian male (with family history of Alzheimer’s dementia) who suffered with atrial fibrillation, left ventricular hypertrophy, hypertension, diastolic dysfunction and diabetic nephropathy (800 milligram protein/gram creatinine, eGFR 47 mL/min/1.73 m2). Estimated GFR declined to 40 mL/min/1.73 m2 over a four-year observation period during which time the patient suffered a cerebellar infarct. Previously, CT imaging of the brain had revealed moderate, global volume loss, basal ganglia lacunar infarcts, old ischemic changes in the right parietal lobe, and mid pons and hypo-densities suggestive of microvascular angiopathy.
Pt 11
A 55-year-old Caucasian male (with family history of Alzheimer’s dementia) who suffered with recurrent atrial fibrillation requiring implantable cardiac defibrillator, hypertension, left ventricular hypertrophy, diastolic dysfunction, diabetic nephropathy (1.3 gram albumin/gram creatinine, eGFR 65 mL/min/1.73 m2), mononeuritis multiplex, and depression. The patient developed end-stage-renal disease requiring hemodialysis and severe left ventricular systolic dysfunction over a twelve-year period of observation.
Blood drawing
Baseline plasma samples were obtained from study participants prior to the initiation of study procedures.
Protein A chromatography
Protein-A chromatography was carried out as previously described [9]. The protein-A-eluates fractions consisted of total IgG isolated from plasma upon low pH elution from the protein-A column. The active protein-A-eluate caused significant inhibitory activity in endothelial cell survival.
Endothelial cell survival assay
Bovine pulmonary artery endothelial cells (Clonetics, Inc. San Diego, CA) were grown in Medium 199 plus 10% fetal calf serum and endothelial cell growth medium (EGM, Clonetics, Inc., San Diego, CA). Endothelial cell number assays were carried out as previously reported [9]. After 48 hours’ incubation in the presence of protein-A-eluate fractions, cells were washed with PBS and processed for the colorimetric estimation of cell number, i.e. cell associated acid phosphatase activity, as previously described [9]. Growth-promoting activity is expressed as a percentage of the control cell number for cells grown in the absence of protein-A-eluate fractions.
Neural progenitor cells
The stem cells were originally isolated from the dentate gyrus of adult Fisher 344 rats and were obtained from Dr. Fred Gage at the Salk Institute. Dentate gyrus (DG) NPC was obtained as previously described [5,10]. NPCs were trypsinized with 0.05% trypsin EDTA and plated at 144,500 cells/35mm dish in Dulbecco’s Modified Eagle Medium (DMEM)/F12 medium high glucose (Omega Scientific, Tarzana, CA) containing N2 supplement (Invitrogen, Grand Island, NY), L-glutamine (2mM), penicillin/streptomycin (100 U/mL) without fibroblast growth factor 2 (FGF-2). Test protein-A-eluate fractions (5-7 μg/mL protein) were added to cells on the third day in vitro (DIV 3) in duplicate.
Mouse neuroblastoma cells
Mouse neuroblastoma N2A cells were cultured in Dulbecco’s modified Eagle’s medium (DMEM), containing 10% fetal bovine serum, (FBS) (Invitrogen, Carlsbad, CA) and penicillin/streptomycin (100 U/mL and 100 mg/mL, respectively) at 37°C and 5% CO2. Cells were plated in 96 well plates for 3 days prior to membrane depolarization experiments.
N2A cell/neurite outgrowth
Cells were plated at low density in 35 mm dishes. Next recombinant human bFGF (10 ng/mL) in the presence or absence of human IgG test fractions were added to dishes in triplicate. Groups of 50-100 cells/dish were counted 2 days after the addition of test factors. Neurite outgrowth represents the percentage of N2A cells expressing more than one neurite. A neurite is defined as a cell process that is at least 2 cell diameters in length of the cell body. Results are expressed as % N2A cells expressing neurites (which represent the mean + SD of triplicate determinations) compared to neurite expression in cells grown with 10 ng/mL human bFGF, but without added test protein-A-eluate fractions.
Developing hippocampal neurons
Embryonic day 18 (E18) rat hippocampal neurons, obtained as previously reported [11], were plated in 96 well, poly-D-lysine coated plates in (Neurobasal Media containing B27 Supplement (1 mL/50 mL), 0.5 mM Glutamine Solution, Penicillin (10,000 units/mL)/Streptomycin (10,000 μg/mL) (250 μL/50 mL), 1 mM HEPES medium at 100 cells/mm2. Hippocampal neurons were exposed to protein- A-eluates on (DIV8) (in depolarization assays) or on DIV13 (for 7 days) in survival assays.
Membrane depolarization assays
After cell attachment, growth medium was removed and cells were washed and then incubated in modified Tyrode’s solution consisting of: 150 mM NaCL, 3 mM KCL and 30 mM HEPES, 10 mM D-glucose and 2 mM CaCL2, pH 7.4. Test fractions (human IgG fractions) were added in the presence of 97 nM DiBAC4 (Molecular Probes, Eugene, OR)-a fluorescent voltage-sensitive dye useful for monitoring changes in membrane potential [12]. Fluorescence was measured after 5 min or longer at room temp using a Fluoroskan Ascent FL (VWR, Inc., Franklin, MA); Ex = 485 nm, Em = 538 nm. Results are expressed as percent of change in gross fluorescence compared to cells to which no test protein-A-eluate fractions were added.
Furin digests of diabetic protein-A eluates
Two microliters of an aqueous solution containing human recombinant furin (>2000 units/mL) was added to 40 μL of protein-A-eluates (8 μg protein) from each of four diabetic depression subjects in buffer containing 100 mmol/L Tris, pH 7.0 and 200 μM calcium. Following 300 minutes incubation at 25°C, 4 μL aliquots of furin-treated or-untreated protein-A-eluates were added (in quadruplicate to endothelial cells) for testing of biological activity. The remaining aliquot of furin-treated and–untreated paired samples was subjected to mass spectrometry.
MALDI mass spectrometry
Purified protein samples were mixed with an equal volume of a saturated solution of Sinapinic acid (Sigma, St. Louis, MO) and spotted onto MALDI target plates. Data was collected on the Bruker Daltronics Autoflex III in the size range of 0 to 30,000 Daltons according to the manufacturer’s recommendations. Data was collected and analyzed using the MALDI Biotyper IVD-CE workflow (Bruker Daltronics).
Protein sequencing
Amino acid sequencing was performed as previously described [13] on the Applied Biosystems (Foster City, CA) Procise®494 protein sequencer using standard Edman sequencing. BLAST (basic local alignment sequence tool) software was used to search for amino acid homology between observed amino acid sequence data and known human protein sequences.
HL-1 cell culture
HL-1 atrial cardiomyocytes were developed (and generously provided) by Dr. William Claycomb (Louisiana State University Medical Center, New Orleans, LA). They were maintained in 5% CO2/95% air at 37°C in Claycomb media (Sigma, St. Louis, MO) containing 10% FBS (Biocell, Rancho Dominguez, CA), 100 U/mL:100 μg/mL penicillin-streptomycin (Invitrogen, Carlsbad, CA), 0.1 mM norepinephrine (Sigma, St. Louis, MO), and 2 mM L-glutamine (Invitrogen, Carlsbad, CA).
Intracellular calcium measurement
HL-1 cells were grown in −ΔDT3 dishes (Bioptechs, Inc., Butler, PA) and loaded with 2 mM Fura-2 acetoxymethyl ester(Molecular Probes, Eugene, OR) for 30 min at 37°C in a balanced salt solution (BSS) (140 mM NaCL, 2.8 mM KCL, 2 mM CaCL2, 2 mM MgCL2, 10 mM HEPES, pH 7.2). The cells were then left for a further 10-minute period in the bathing solution at room temperature to allow ester hydrolysis to go to completion. Using a dual-wavelength spectrofluorometer with excitation wavelengths at 340 and 380 nm and emission at 510 nm fluorescence measurements were performed at room temperature on the stage of an inverted fluorescence microscope (Nikon TE200). The fluorescence spectra of a group of cells were continuously monitored with a PTI spectrofluorometer (Photon Technology International, Monmouth Junction, NJ). The release of intracellular Ca2+ was measured following exposure to 1:25 dilutions of the protein-A eluate or a highly-purified hydroxyapatite chromatography fraction from patients’ plasma.
Size exclusion (gel filtration) chromatography
G75 superfine Sephacryl (Pharmacia, Piscataway, NJ) equilibrated in 10 mM sodium phosphate, 0.15 M NaCL, pH 7.4 was packed into a 5 × 0.7 cm column (Sigma, St. Louis, MO) having a volume of 2.4 mL. An aliquot of the protein- A-eluate (0.05 mL) was added to the column and eluted in 10 mM sodium phosphate, 0.15 M NaCL, pH 7.4 at a flow rate of 0.25 mL/min, at 20°C. Each individual collected fraction (0.125 mL) was assayed for effects on N2A neurite outgrowth.
Hydroxyapatite chromatography
Hydroxyapatite (HA) chromatography was carried out as previously described [9]. The protein- A-eluate fraction was diluted 1:1 in 10 mM sodium phosphate, pH 7.4 (binding buffer) and then it was applied to the HA column and washed with 10 column volumes of binding buffer. Next the column was eluted stepwise with equal volumes of 0.05 mM, 0.1 mM, 0.25 mM and 0.4 mM sodium phosphate, pH 7.4. The fraction eluting from HA with 0.05 M sodium phosphate displayed peak endothelial cell inhibitory activity and it was tested for effect on Ca2+ release in HL-1 atrial cardiomyocytes.
Chemicals
Protein- A agarose was obtained from Pierce Chemical Co., (Rockford, IL). All other chemicals and reagents were analytical grade.
Protein determinations
Protein concentrations were determined by a bicinchoninic acid protein assay kit (Pierce Chemical Co., Rockford, IL).
Statistics
All data are the mean ±1 SD or SE as indicated. Comparisons were made by Student’s t-test for a continuous variable, or by Chi-square (χ2) test for dichotomous variables with a significance level, P = 0.05. For a multiple test, however, the p-value was adjusted by the Bonferonni correction method, dividing it by the number of comparisons.
Results
Baseline clinical characteristics in study groups
Diabetic depression patients had significantly higher mean glycosylated hemoglobin, and higher baseline prevalence(s) of nephropathy or painful neuropathy compared to age-matched diabetic patients without depression (Table 2). Diabetic depression and patients with nephropathy or a co-morbidity, (i.e. atrial fibrillation, schizophrenia, painful neuropathy) involving dysfunction in electrically-excitable cells had significantly higher mean body mass index compared to age-matched diabetic patients without depression (Table 2).
Depolarization induced by diabetic depression, diabetic nephropathy or autoantibodies in other pathologies
Autoantibodies in diabetic depression (10 μg/mL) (n = 21) (121% vs 106%; P = 0.002) caused significantly greater mean depolarization in N2A cells compared to identical concentrations of autoantibodies in diabetes patients without depression (n = 15) (Figure 1a). Autoantibodies in diabetic nephropathy (n = 5) (128% vs 106%; P < 0.002) or in patients having another disorder associated with dysfunction in electrically-excitable cells (n = 6) (141% vs 106%; P < 0.002) were significantly more depolarizing than identical concentrations of autoantibodies in diabetic patients without depression (n = 15) (Figure 1a). Mean depolarization in (DIV8) rat hippocampal neurons in autoantibodies from diabetic depression (140% vs 113%; n = 10; P = 0.01) or from patients having nephropathy or another pathology involving dysfunction in electrically-excitable cells (168% vs 113%; n = 11; P < 0.005) significantly exceeded mean depolarization in autoantibodies from diabetic patients without depression (data not shown in Figure 1a). These data suggest circulating autoantibodies in diabetic depression or in diabetic nephropathy, atrial fibrillation or co-morbid painful neuropathy cause increased neuronal depolarization.
Figure 1.
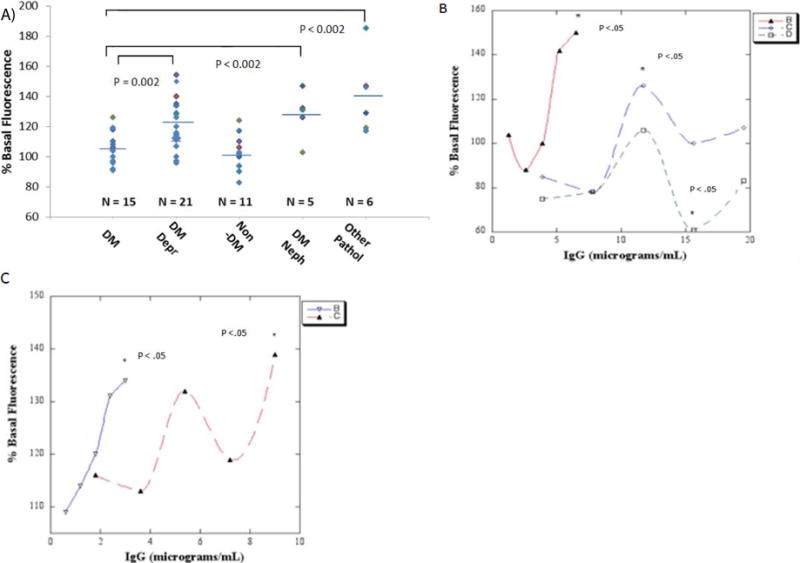
A) Diabetic depression (DM Depr), diabetic nephropathy (DM Neph) or other pathologies (Other Path) autoantibodies cause significantly increased mean depolarization in neuroblastoma (N2A) cells compared to control diabetic (DM) autoantibodies. ** P < 0.002. B) Dose-N2A cell depolarization response curves in representative autoantibodies from two diabetic depression (solid triangle- red, open diamond- blue line) and one diabetic control patient (open square, green line). C) Dose-dentate gyrus neural progenitor cell depolarization response curves in representative autoantibodies from two patients with diabetic nephropathy with (inverted open triangle-blue) or without depression (solid triangle- red line). B-C) Data are mean, SD was < 10%. * P < 0.05 compared to cells without added autoantibodies.
Autoantibodies in two representative diabetic depression patients without nephropathy caused dose-dependent depolarization in N2A cells which significantly exceeded the level in control, untreated cells at 6 or 12 μg/mL IgG concentrations (asterisks, Figure 1b). Autoantibodies in a representative diabetic patient without depression had no significant depolarizing effect at 6-12 μg/mL IgG concentrations, but caused significant N2A hyper polarization (asterisk. Figure 1b) at higher (15 μg/mL) IgG concentration. Autoantibodies in two different representative patients having diabetic nephropathy with or without depression caused significant depolarization in dentate gyrus neural progenitor cells at 3 or 9 μg/mL IgG concentrations (asterisks. Figure 1c); half-maximal depolarization occurred at 1.4 or 4.1 μg/mL concentrations of the Pt 6 or Pt 7 IgG autoantibodies, respectively (Figure 1c). The dose-depolarization curve in the Pt 7 autoantibodies was multiphasic suggesting more than one depolarizing IgG substance occurring at different concentrations (Figure 1c).
Diabetic depression or nephropathy autoantibodies induce Ca2+ release in endothelial cells or in HL-1atrial cardiomyocytes
An overview of the experiments conducted to characterize a stable low MW IgG component in depolarizing autoantibodies having peak cell toxicity is shown in Figure 2. We next tested whether depolarizing autoantibodies affect Ca2+ release in endothelial cells or in electrically-excitable atrial cardiomyocytes. Neuronal depolarizing autoantibodies (n = 3 of 3 tested at 1 μg/mL concentrations) evoked prolonged intracellular Ca2+ release in HL1 atrial cardiomyocytes (e.g. Figure 3b). Potent endothelial cell inhibitory diabetic nephropathy autoantibodies caused prolonged suppression of rhythmic spontaneous calcium oscillations in HL-1 cells (Figure 3c). A purified component (1 μg/mL) having peak apparent MW (56 kD) corresponding to IgG heavy chain [8] caused large increase(s) in intracellular Ca2+ in HL-1 cells (e.g. Figure 3c, arrow to the right). Diabetic and nondiabetic control patient autoantibodies (n = 3) had little if any significant effect on HL-1 Ca2+ release (Figure 3a, d) or on spontaneous Ca2+ oscillations (Figure 3c). Diabetic recurrent major depression autoantibodies caused a ramp-like, persistent increase in Ca2+ in endothelial cells (Figure 3e) and substantially decreased survival in hippocampal neurons (arrows, Figure 2f). Mass spectrometry of the Pt 10 recurrent major depression protein-A-eluate revealed MW peaks (11 kD, 23 kD, 56 kD, 112 kD) corresponding to half-light chain, light chain, heavy chain monomer or heavy chain dimer, respectively (Figure 3g).
Figure 2.
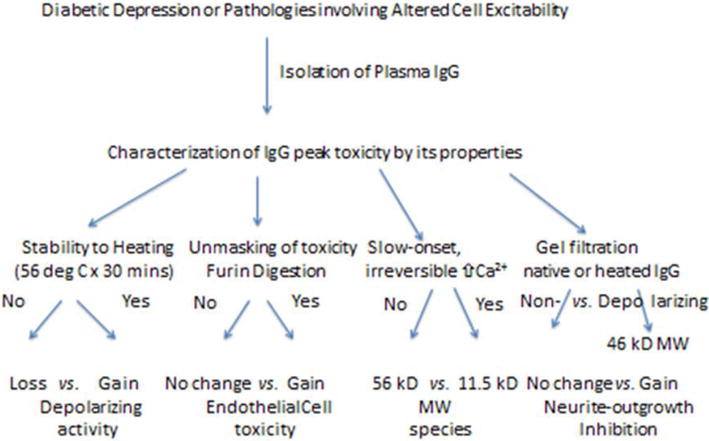
Outline and brief overview of results in experiments performed to characterize stable peak toxicity in IgG autoantibodies causing increased neuronal depolarization.
Figure 3.
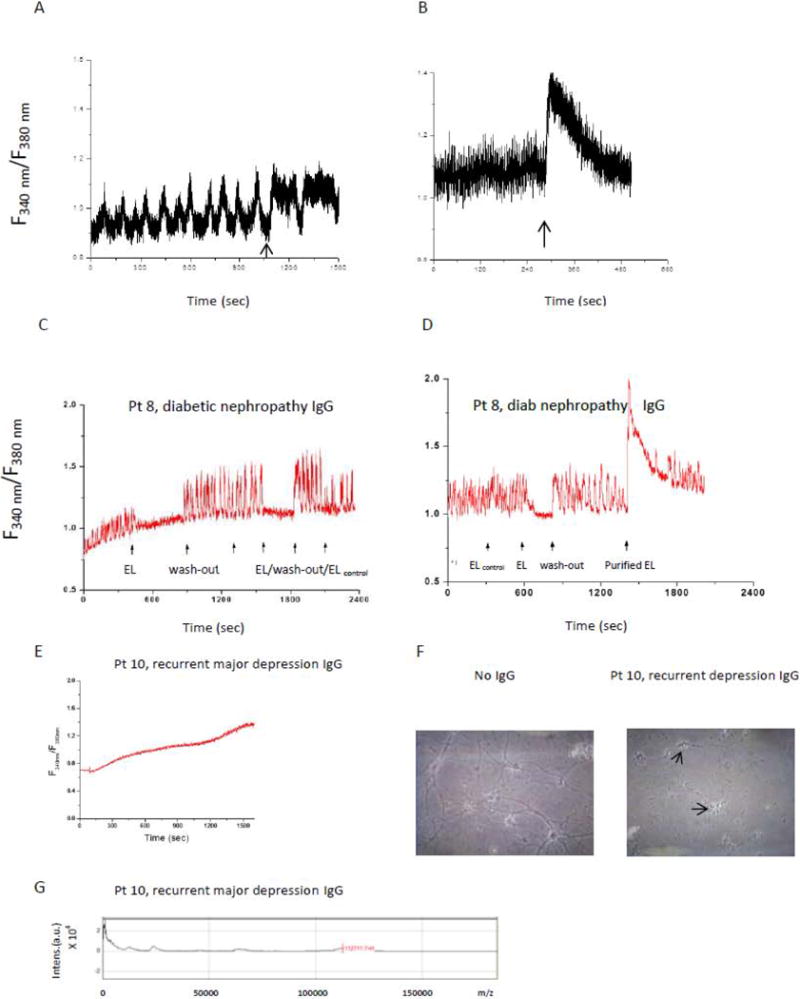
Representative non-depolarizing IgG A) had no effect on intracellular Ca2+ release; B) representative depolarizing IgG autoantibodies increased intracellular Ca2+ release in HL-1 atrial cardiomyocytes. C-D) diabetic nephropathy/left ventricular hypertrophy (Pt 8) IgG interrupted spontaneous HL-1 calcium oscillations (arrow to the left); D) a highly purified fraction (arrow to the far right) caused a large increase in intracellular calcium; middle arrow represents wash-out of Pt 8 protein A eluate E) Pt 10 recurrent major depression eluate caused ramp-like increase in Ca2+ in endothelial cells, F) Pt 10 eluate caused increased neurotoxicity after 7 days incubation with rat hippocampal neurons, arrows indicate degenerated cell bodies G) mass spectrometry in Pt 10 eluate revealed low MW 11 kD and 23 kD light chain components. A&B) similar results were obtained in five protein-A-eluates (three depolarizing IgG from diabetic nephropathy (n = 2) or a nondiabetic control patient (n = 1) with hypertension and left ventricular hypertrophy (B), and two non-depolarizing IgG, both from nondiabetic controls.
Stability of depolarizing activity in diabetic depression protein A eluates
In a prior study, long-term storage (> 6 months) of protein- A-eluates in a subset of cancer fatigue/depression patients unmasked latent EC inhibitory activity having apparent MWs corresponding to IgG light chains (23 kD) or half -light chains (11.5 kD) [8]. Heating increased EC inhibitory effects from the protein-A-eluates [8] suggesting increased toxicity resulted from light chain-induced aggregation.
Heating (56°C × 30 mins) caused substantial (80%) loss of depolarizing activity in three of three diabetic depression protein-A-eluates tested (Diab Depression Pt 1-3, Table 3) suggesting that in most cases, a complex tertiary protein structure is necessary to mediate depolarization. Following heat treatment of the eluate from Pt 5-who suffered with a triad of diabetic depression, nephropathy, and atrial fibrillation-neuronal depolarization, was increased by (613%) (Table 3), suggestive of enhanced toxicity resulting from aggregation in a subset of heat-stable immunoglobulin light chains.
Table 3.
Effect of heat on depolarizing activity in diabetic depression protein-A-eluates Depolarizing Activity (%)*.
| Patient number | Baseline | Heated (56°C × 30 minutes) | P-valueˆ |
|---|---|---|---|
| Atrial fibrillation, without nephropathy | |||
| 1-3. | 144 ± 11 | 109 ± 14 | 0.056 |
| Atrial fibrillation, with nephropathy | |||
| 5.70/M | 115 ± b | 192 ± 3 | 0.008 |
Depolarizing activity was determined as change in basal N2A cell fluorescence (after 15 minutes incubation with protein-A-eluates fractions), as described in Material and Methods.
P-value from T-test comparing depolarizing activity before and after heat treatment.
Effect of furin treatment on EC toxicity in diabetic depression protein A eluates
Furin is a ubiquitously expressed pro-protein convertase which cleaves downstream of multi-basic amino acid sequences, such as K-X-X-X-K-R ↓ [14] present at the variable-constant switch region in certain kappa light chains. In a prior study, furin treatment unmasked highly potent, latent EC inhibitory activity in diabetic glaucoma and dementia protein-A-eluates [13]. In the present study, furin selectively activated latent, highly potent EC inhibitory activity present in the Pt 5 eluate; latent activity was absent from three other diabetic depression protein- A-eluates tested (Table 4). Mass spectrometry revealed (23 kD) light chain peaks in both the Pt 5 and Pt 1 diabetes depression protein-A-eluates before furin treatment (Figure 4). Several lower MW 8-9 kD peaks were present in the Pt 5 eluate before furin treatment and they survived prolonged exposure (5 hours) to furin (Figure 4).
Table 4.
Effect of furin treatment in diabetic depression protein- An eluates on endothelial cell inhibitory activity Endothelial cell activity (%)*
| Age/sex | Before furin | After furin | P-valueˆ |
|---|---|---|---|
| Atrial fibrillation | |||
| 64/M | 117 ± 5 | 112 ± 12 | 0.70 |
| 73/M | 94 ± 10 | 117 ± 15 | 0.43 |
| 68/M | 94 ± 6 | 100 ± 5 | 0.35 |
| Pt 5, Atrial Fib, nephropathy, FH of dementia | |||
| 70/M | 104 ± 10 | 65 ± 8 | < 0.01 |
Endothelial cell survival after 2 days incubation with protein-A-eluates fractions was determined as described in Materials and Methods:
P-value from T-test comparing activity before and after furin treatment. Fibrillation, FH- family history
Figure 4.
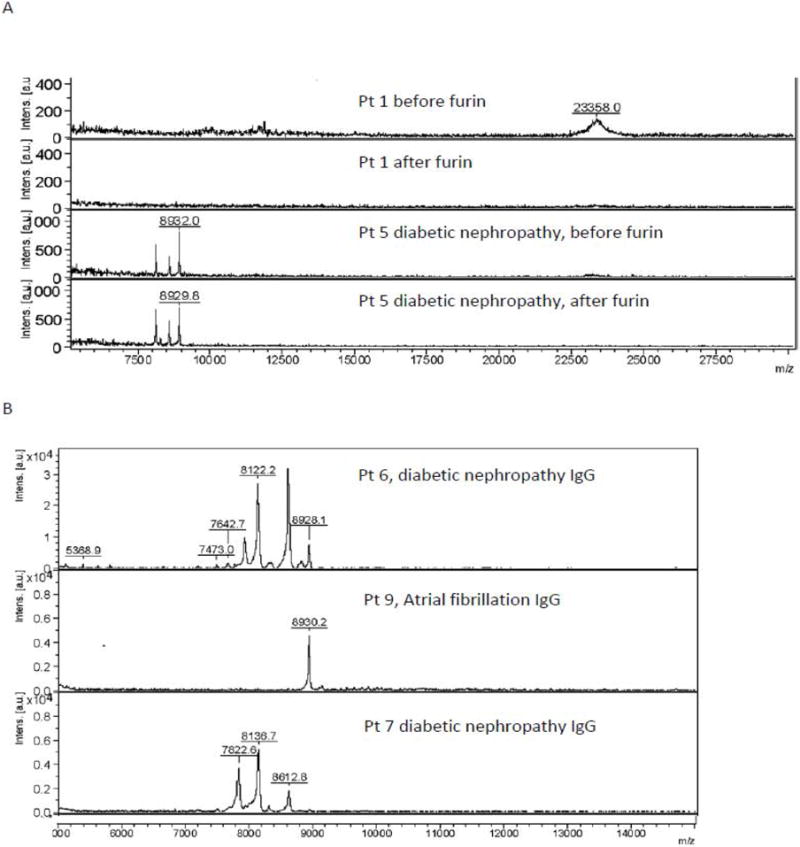
Mass spectrometry of A) diabetic depression protein- A-eluates, before or after furin treatment or in B) diabetic subsets without or with nephropathy or chronic kidney disease, as described in Table 5.
Association between diabetic CKD and low molecular weight IgG-derived peptides
We next subjected the protein-A-eluates from diabetic patients having depression and/or atrial fibrillation with or without nephropathy (n = 9) to mass spectrometry. Diabetic nephropathy patients (n = 4) had significantly lower mean estimated glomerular filtration rate (eGFR) indicative of chronic kidney disease (CKD) compared to age-matched diabetic patients without nephropathy (n = 5) (Table 5). The IgG components in diabetic nephropathy protein-A-eluates had significantly lower mean MW (8.0 kD vs 21.0 kD) compared to the IgG peaks in protein-A-eluates from diabetes without nephropathy (Table 5).
Table 5.
Association between diabetic nephropathy having reducing glomerular filtration rate and the presence of lower molecular weight peak plasma IgG light chain components
| Depression and/or Atrial fibrillation | |||
|---|---|---|---|
| Without nephropathy | With nephropathy | ||
| (N = 5) | (N = 4) | P-valueˆ | |
| Age (years) | 70.4 ± 3 | 68.3 ± 4 | 0.47 |
| Mean eGFR (mL/min/1.73 m2) | 91.8 ± 23 | 38.1 ± 21 | 0.015 |
| Average peak MW (kD)* | 21.2 ± 7.7 | 8.0 ± 0.96 | < 0.0001 |
| Amino acid sequence homology to kappa light chain** | NT | 100% (n = 1)*** | |
average peak molecular weight (MW) was determined by mass spectrometry as described in Materials and Methods.
Amino acid sequence homology to human kappa light chain variable sequence was determined as reported in Materials and Methods.
Pt 8: a 62-year-old man with diabetic nephropathy progressing to end-stage-renal-disease who had family history of diabetic chronic kidney disease. eGFR- estimated glomerular filtration rate.
Depolarizing protein A eluates inhibit neurite outgrowth
Depolarizing autoantibodies in diabetic nephropathy or diabetic depression patients inhibited neurite outgrowth (in N2a cells) to a significantly greater extent (72 ± 13% vs. 105 ± 4%, P = 0.011, n = 10) than (identical concentrations of) non-depolarizing autoantibodies from diabetic patients without depression (Figure 5a). Schizophrenia plasma autoantibodies (n = 5) including patients without diabetes (n = 2) or those having type 1 (n = 1) or type 2 diabetes (n = 2) inhibited neurite outgrowth to a significantly greater extent (42 ± 12% vs 105 ± 4%, P = 0.000015) than non-depolarizing diabetic autoantibodies from patients without depression (not shown in Figure 5a). The schizophrenia plasma autoantibodies (n = 5) also substantially decreased mean EC survival (63 ± 11%) (data not shown in Figure 5a). Heat treatment (56°C × 30 minutes) in diabetic depolarizing autoantibodies caused an increase in mean neurite-inhibitory activity (39 ± 15% vs 72 ± 13%, P = 0.046) compared to basal levels (Figure 5a). Gel filtration of three heat-treated, diabetic nephropathy/non-ischemic cardiomyopathy protein-A-eluates, (i.e. Pt 5, 7, 11) revealed that peak neurotoxicity eluted from the column with an apparent MW of 45.7 kD, corresponding to a κ light chain dimer. Additional peaks of neurotoxicity having apparent MWs of ~89 kD appeared in the Pt 7 and Pt 11 eluates, or ~11 kD in the Pt 7 eluate (Figure 5b). Gel filtration of the unheated protein-A-eluate from a type 1 diabetic patient with co-morbid schizophrenia and suffering with a seizure disorder, diabetic nephropathy, and dementia displayed peak neurotoxicity in the fractions eluting with apparent MWs of ~ 46 kD and 11 kD (not shown in Figure 4b).
Figure 5.
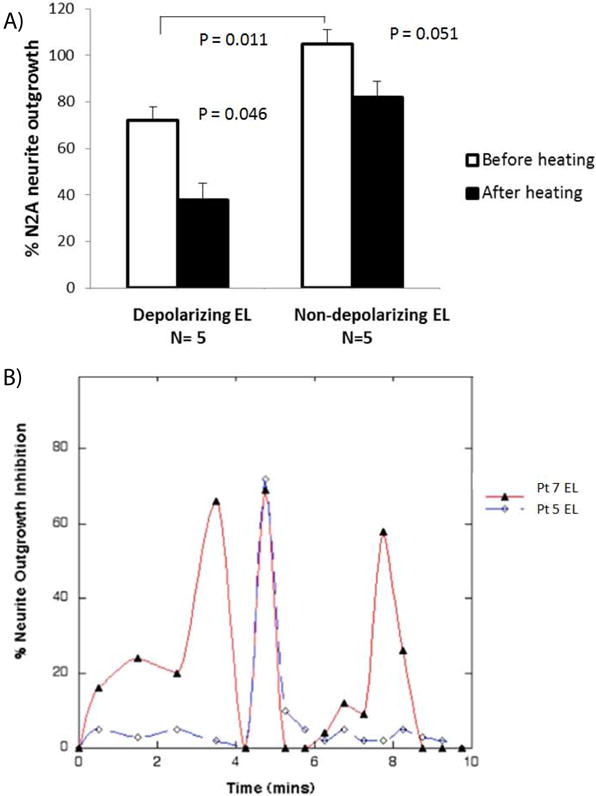
A) Heat treatment (56 × 30 mins) in depolarizing protein- A-eluates from diabetic nephropathy/nonischemic cardiomyopathy or depression caused gain in N2A neurite outgrowth inhibition;
B) elution profile of neurite-inhibitory activity in the heat-treated diabetic nephropathy/nonischemic cardiomyopathy protein- A-eluates following gel filtration on Sephadex G75 as described in Methods. A) Data are mean + SE; * P < 0.05 comparing activity in depolarizing eluates before and after heating; or comparing (depolarizing vs non-depolarizing) eluates before; or after heating. B) Similar results were obtained following gel filtration of the heat-treated Pt 11 protein-A-eluate or unheated protein-A-eluate from a diabetic schizophrenia patient with nephropathy and dementia.
Diabetic depression autoantibodies bind neural-derived HSPG
Autoantibodies in diabetic depression displayed significantly increased binding to PC12 cell-derived HSPG (195 ± 6% vs 149 ± 9%; P = 0.004) (Figure 6a) or to HSPG purified from adult DG neural progenitor cells (320 ± 9% vs 222 ± 16%; P = 0.004) (Figure 6b) compared to autoantibodies in diabetes without depression.
Figure 6.
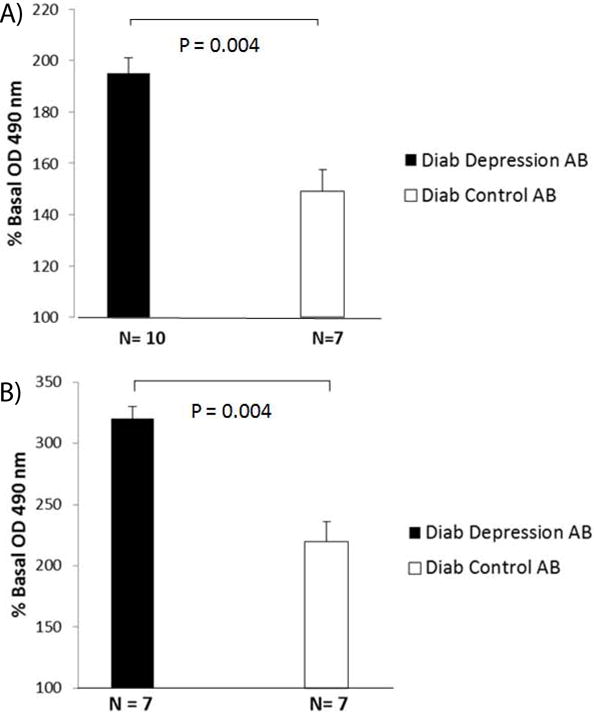
Diabetic) depression autoantibodies display increased binding to purified HSPG antigens.
A) derived from PC12 cells or B) NPC cells compared to control diabetic Diab control autoantibodies. A-B) Data are mean + SE.
Association between non-ischemic cardiomyopathy/nephropathy and family history of dementia
An unexpected observation was that patients 5,7,11 whose plasma contained (heat-inducible) neurotoxic soluble light chain dimers each had a parent who had died from (late-onset) Alzheimer’s dementia. Evidence that this association may not have occurred entirely by chance, comes from our preliminary observation that (3/4) patients having co-morbid nephropathy and atrial fibrillation had a parent who had died of Alzheimer’s dementia compared to (0/18) (informative) diabetic patients who lacked co-morbid nephropathy, and atrial fibrillation (75% vs 0%, n =22; P < 0.001, Chi-square test).
Discussion
Neural progenitor cells have a high input resistance and normally reside in a ‘vascular niche’ accessible to the general circulation [16]. The present data suggest that diabetic depression autoantibodies which were active at concentrations near the reported affinity constant (20 nM) of HSPG [17] may target cell surface or matrix-associated HSPG altering dentate gyrus neural progenitor cell membrane potential and excitability. Depolarizing autoantibodies also caused significant neurite outgrowth inhibition suggesting involvement of more than one mechanism capable of impairing dentate gyrus neural progenitor cell maturation and perhaps leading to reduced adult dentate gyrus neurogenesis which is a hallmark of treatment-refractory depression [5]·
The precise mechanism underlying autoantibody-induced depolarization is unknown. Lysophosphatidic acid is a serum depolarizing factor which caused depolarization and RhoA-mediated neurite retraction by activating a subfamily of G proteins which couple to multiple downstream signaling pathways [18]. Diabetic nephropathy/non-ischemic cardiomyopathy autoantibodies were similarly pleiotropic, causing depolarization, neurite retraction, intracellular Ca2+ release and suppression of spontaneous Ca2+ oscillations, the latter which are required for rhythmic firing of cardiac action potentials in HL-1 atrial cardiomyocytes [19]. Taken together, these data suggest possible involvement of unknown G proteins in the mechanism linking autoantibodies with neuronal depolarization, atrial arrhythmias, cardiac hypertrophy or other diverse cellular effects.
Light chain aggregation causes enhanced cell toxicity in systemic light chain amyloidosis (AL disease) [20] and in the present study may have resulted (in part) from heating diabetic nephropathy/cardiomyopathy autoantibodies. In myeloma-associated Fanconi syndrome, intact light chain variable domains having MW 11-12 kD precipitate in proximal renal tubular epithelial cells [21]. Fanconi syndrome light chains are derived from a restricted subclass of Vκ (I) germ line genes (e.g. O2/O12, O8/O18) which can resist lysosomal protease degradation (in proximal renal tubular epithelial cells) as a result of mutation(s) involving (nonpolar) amino acid residues at critical solvent-exposed position(s) in complementarity determining region, CDR1, (e.g. amino acid positions 30-32) [22,23]. These germ line genes encode variable domains having dibasic amino acid residues in the variable-constant switch region [22] which may serve as a preferred site for furin-mediated cleavage [21]· In contrast, wild-type light chains which lack such nonpolar residues at the solvent-exposed region in CDR1 undergo proteolytic attack at solvent-exposed polar residues (in CDR1). Cleavages within CDR1 (amino acid 30) and in the variable-constant switch region (amino acid 107) are predicted to generate 8-9 kD MW fragments which may represent a normal byproduct of renal tubular (kappa light chain) metabolism. Based on these observations, peak neurotoxic soluble light chain dimers having apparent MWs of 46 kD may arise (in part) through aggregation in protease-resistant (11.5kD) fragments derived from a restricted subset of κ LC germ line variable sequences. Assuming simple Mendelian inheritance of certain restricted germ line kappa variable genes, our chance observation that three patients harboring toxic soluble light chain dimers had a first-degree relative who had suffered from late-onset Alzheimer’s dementia suggests that additional forms of neurotoxicity may result from soluble toxic kappa light chain dimers.
Diabetic major recurrent depression autoantibodies which were comprised (in part) of 11.5 kD MW half-light chains caused persistent, large increase (s) in intracellular Ca2+ in endothelial cells and were highly toxic in hippocampal neurons. The kinetics of endothelial cell Ca2+ release (on-response) was slower than in autoantibodies comprised of intact IgG or heavy chain dimers and the absence of a detectable off-response suggests a mechanism involving Ca2+ overload leading to cell death. Highly potent endothelial cell inhibitory activity previously reported in diabetic nephropathy protein- A-eluates was associated with light chains having reduced affinity for heparin Sepharose columns [24]. Since HSPG is known to promote light chain oligomerization [20], endothelial cell- or neuronal-associated HSPG may play a key role in the assembly of light chain fragments into toxic oligomers (in-vivo) and may have accounted in part for the lag phase in the on-response of Ca2+ release following exposure to 11.5 kD MW, half-light chain-containing major recurrent depression autoantibodies.
The physiologic factors regulating activation of latent autoantibody-associated light chain toxicity are unknown. In a prior study, furin treatment of diabetic glaucoma and/or dementia autoantibodies unmasked latent potent endothelial cell toxicity [13] as was evidenced following furin treatment in the Pt 5 protein-A-eluate in the present study. Furin is expressed at the cell surface and in recycling endosomes in capillary endothelial cells and it plays an important role in normal cardiac development via activation of latent growth factors and proteases [25]. For example, shear stress upregulates endothelial cell expression of furin and the pro-inflammatory, fibrogenic cytokine transforming growth factor-β [26]. Another possible mechanism for increased light chain toxicity in diabetic nephropathy having reduced glomerular filtration rate is as a result of substantially increased polyclonal free κ light chains which may circulate at 30-fold higher concentrations [27] than the concentrations of pathogenic monoclonal κ light chain in systemic light chain Amyloidosis (AL) disease. A restricted subset of highly toxic κ light chains which comprises only ~1-3% of polyclonal light chain sequences might contribute to systemic pathophysiology, e.g. non-ischemic cardiomyopathy, in diabetic chronic kidney disease as a consequence of substantially increased overall free kappa light chain concentration. Organ involvement in a subset of diabetic cardiomyopathy/nephropathy patients expressing toxic immunoglobulin light chains (Pts 5, 7, 11) mimicked the distribution, (heart, kidney, peripheral nerve, lung and spleen) found in systemic light chain Amyloidosis (AL) disease. Of interest, Patient 7 suffered from non-traumatic splenic rupture which is unusual in diabetes, but not uncommon in systemic (AL) Amyloidosis. Yet amyloid deposits could not be demonstrated either on histologic examination of the affected spleen or following subsequent abdominal fat biopsy suggesting that earliest toxicity may be mediated by soluble light chain dimers which may not necessarily progress to the later stage of forming insoluble amyloid fibrils.
Schizophrenia is associated with an increased family history of autoimmune diseases including thyrotoxicosis or type 1 diabetes [28]. One hypothesis is that birth trauma in diabetic mothers or maternal passage of brain-reactive autoantibodies causes abnormalities in fetal neurodevelopment [29]. Nearly all of the adult patients in our study suffered with chronic schizophrenia, making it difficult to ascertain whether autoantibodies having both potent endothelial cell-inhibitory, and neurite outgrowth-inhibitory properties may have preceded the onset of schizophrenia or were mere bystanders. The BB rat is a genetic strain of spontaneous autoimmune diabetes in which anti-endothelial cell autoantibodies precede the development (and are thought to contribute to pathophysiology) in autoimmune diabetes [30]. It is possible that the early onset in a subset of genetically-susceptible, autoimmune diabetes-prone individuals of anti-endothelial cell autoantibodies having additional neurite-suppressive, and depolarizing properties might adversely affect hippocampal neurodevelopment leading to mood and cognitive disorders.
Our study was limited by having only a small number of adult male diabetic patients who experienced a cluster of disease complications associated with toxic immunoglobulin light chains. More study in a much larger, diverse population is needed to test for association(s) between ‘excitotoxic’ depolarizing autoantibodies and a cluster of non-ischemic cardiomyopathy/nephropathy or neurodegenerative disorders. Since the diffusion of bis-oxonol dyes (e.g. DiBac4) across the cell membrane following depolarization requires several seconds to occur, we could not assess the rapid phase of kinetics associated with IgG-induced depolarization.
In summary, depolarizing IgG autoantibodies were increased in plasma in subsets of diabetes in association with disorders in which sustained depolarization may have a role in pathophysiology, e.g. depression, nephropathy, atrial fibrillation, painful neuropathy or schizophrenia. More study is needed to determine whether immunoglobulin light chain dimers comprised of specific kappa variable sequences might provide a biomarker(s) useful in identifying subsets of diabetes at increased risk for a cluster of severe complications involving heart, kidney, lung, peripheral nerve or brain.
Acknowledgments
Supported by a grant from the Veterans Biomedical Research Institute (East Orange, New Jersey) to MBZ.
Footnotes
Conflict of Interest
The authors report no conflict of interest that would affect the objectivity of the present findings.
References
- 1.Anderson RJ, Freedland KE, Clouse RE, Lustman PJ. The prevalence of comorbid depression in adults with diabetes: a meta-analysis. Diabetes Care. 2001;24(6):1069–1078. doi: 10.2337/diacare.24.6.1069. [DOI] [PubMed] [Google Scholar]
- 2.Sullivan MD, O’Connor P, Feeney P, Hire D, Simmons DL, Raisch DW. Depression predicts all-cause mortality: epidemiological evaluation from the ACCORD HRQL substudy. Diabetes Care. 2012;35(8):1708–1715. doi: 10.2337/dc11-1791. [DOI] [PMC free article] [PubMed] [Google Scholar]
- 3.Lin EH, Rutter CM, Katon W, Heckbert SR, Ciechanowski P, Oliver MM, Ludman EJ, Young BA, Williams LH, McCulloch DK, Von Korff M. Depression and advanced complications of diabetes: a prospective cohort study. Diabetes Care. 2010;33(2):264–269. doi: 10.2337/dc09-1068. [DOI] [PMC free article] [PubMed] [Google Scholar]
- 4.Holt RIG, de Groot M, Lucki I, Hunter CM, Sartorius N, Golden SH. NIDDK International Conference Report on Diabetes and Depression: Current Understanding and Future Directions. Diabetes Care. 2014;37(8):2067–2077. doi: 10.2337/dc13-2134. [DOI] [PMC free article] [PubMed] [Google Scholar]
- 5.Zimering MB, Behnke JA, Thakker-Varia S, Alder J. Autoantibodies in human diabetic depression inhibit adult neural progenitor cells in vitro and induce depressive-like behavior in rodents. J Endocrinol Diab. 2015;2(2):11. doi: 10.15226/2374-6890/2/2/00119. [DOI] [PMC free article] [PubMed] [Google Scholar]
- 6.Tozuka Y, Fukuda S, Namba T, Seki T, Hisatsune T. GABAergic excitation promotes neuronal differentiation in adult hippocampal progenitor cells. Neuron. 2005;47(6):803–815. doi: 10.1016/j.neuron.2005.08.023. [DOI] [PubMed] [Google Scholar]
- 7.Zimering MB, Alder J, Pan Z, Donnelly RJ. Anti-endothelial and antineuronal effects from auto-antibodies in subsets of adult diabetes having a cluster of microvascular complications. Diabetes Res Clin Pract. 2011;93(1):95–105. doi: 10.1016/j.diabres.2011.03.029. [DOI] [PubMed] [Google Scholar]
- 8.Warner-Schmidt JL, Duman RS. Hippocampal neurogenesis: opposing effects of stress and antidepressant treatment. Hippocampus. 2006;16(3):239–249. doi: 10.1002/hipo.20156. [DOI] [PubMed] [Google Scholar]
- 9.Zimering MB, Thakker-Varia S. Increased fibroblast growth factor-like autoantibodies in serum from a subset of patients with cancer-associated hypercalcemia. Life Sci. 2002;71:2939–2959. doi: 10.1016/s0024-3205(02)02160-4. [DOI] [PubMed] [Google Scholar]
- 10.Song HJ, Stevens CF, Gage FH. Neural stem cells from adult hippocampus develop essential properties of functional CNS neurons. Nat Neurosci. 2002;5(5):438–445. doi: 10.1038/nn844. [DOI] [PubMed] [Google Scholar]
- 11.Thakker-Varia S, Alder J, Crozier RA, Plummer MR, Black IB. Rab3A is required for brain-derived neurotrophic factor-induced synaptic plasticity: transcriptional analysis at the population and single-cell levels. J Neurosci. 2001;21(17):6782–90. doi: 10.1523/JNEUROSCI.21-17-06782.2001. [DOI] [PMC free article] [PubMed] [Google Scholar]
- 12.Blanchard BJ, Konopka G, Russell M, Ingram VM. Mechanism and prevention of neurotoxicity caused by beta-amyloid peptides: relation to Alzheimer’s disease. Brain Res. 1997;776(1–2):40–50. doi: 10.1016/s0006-8993(97)01003-2. [DOI] [PubMed] [Google Scholar]
- 13.Zimering MB, Moritz TE, Donnelly RJ. Anti-neurotrophic effects from autoantibodies in adult diabetes having primary open angle glaucoma or dementia. Front Endocrinol (Lausanne) 2013;4:58. doi: 10.3389/fendo.2013.00058. [DOI] [PMC free article] [PubMed] [Google Scholar]
- 14.Remacle AG, Shiryaev SA, Oh ES, Cieplak P, Srinivasan A, Wei G, et al. Substrate cleavage analysis of furin and related proprotein convertases. A comparative study. J Biol Chem. 2008;283:20897–20906. doi: 10.1074/jbc.M803762200. [DOI] [PMC free article] [PubMed] [Google Scholar]
- 15.Lurie A. Inflammation, oxidative stress, and procoagulant and thrombotic activity in adults with obstructive sleep apnea. Adv Cardiol. 2011;46:43–66. doi: 10.1159/000325105. [DOI] [PubMed] [Google Scholar]
- 16.Palmer TD, Willhoite AR, Gage FH. Vascular niche for adult hippocampal neurogenesis. J Comp Neurol. 2000;425(4):479–494. doi: 10.1002/1096-9861(20001002)425:4<479::aid-cne2>3.0.co;2-3. [DOI] [PubMed] [Google Scholar]
- 17.Castillo GM, Ngo C, Cummings J, Wight TN, Snow AD. Perlecan binds to the beta-amyloid proteins (A beta) of Alzheimer’s disease, accelerates A beta fibril formation, and maintains A beta fibril stability. J Neurochem. 1997;69(6):2452–2465. doi: 10.1046/j.1471-4159.1997.69062452.x. [DOI] [PubMed] [Google Scholar]
- 18.Postma FR, Jalink K, Hengeveld T, Offermanns S, Moolenaar WH. Galpha(13) mediates activation of a depolarizing chloride current that accompanies RhoA activation in both neuronal and nonneuronal cells. Curr Biol. 2001;11(2):121–124. doi: 10.1016/s0960-9822(01)00030-6. [DOI] [PubMed] [Google Scholar]
- 19.Sartiani L, Bochet P, Cerbai E, Mugelli A, Fischmeister R. Functional expression of the hyperpolarization-activated, non-selective cation current I(f) in immortalized HL-1 cardiomyocytes. J Physiol. 2002;545(Pt 1):81–92. doi: 10.1113/jphysiol.2002.021535. [DOI] [PMC free article] [PubMed] [Google Scholar]
- 20.Ren R, Hong Z, Gong H, Laporte K, Skinner M, Seldin DC, et al. Role of glycosaminoglycan sulfation in the formation of immunoglobulin light chain amyloid oligomers and fibrils. J Biol Chem. 2010;285(48):37672–37682. doi: 10.1074/jbc.M110.149575. [DOI] [PMC free article] [PubMed] [Google Scholar]
- 21.Aucouturier P, Bauwens M, Khamlichi AA, Denoroy L, Spinelli S, Touchard G, et al. Monoclonal Ig L chain and L chain V domain fragment crystallization in myeloma-associated Fanconi’s syndrome. J Immunol. 1993;150(8 Pt 1):3561–3568. [PubMed] [Google Scholar]
- 22.Rocca A, Khamlichi AA, Touchard G, Mougenot B, Ronco P, Denoroy L, et al. Sequences of V kappa L subgroup light chains in Fanconi’s syndrome. Light chain V region gene usage restriction and peculiarities in myeloma-associated Fanconi’s syndrome. J Immunol. 1995;155(6):3245–3252. [PubMed] [Google Scholar]
- 23.Comenzo RL, Zhang Y, Martinez C, Osman K, Herrera GA. The tropism of organ involvement in primary systemic amyloidosis: contributions of Ig V(L) germ line gene use and clonal plasma cell burden. Blood. 2001;98(3):714–720. doi: 10.1182/blood.v98.3.714. [DOI] [PubMed] [Google Scholar]
- 24.Zimering MB, Anderson RJ, Moritz TE, Ge L, Investigators for the VADT Low plasma basic fibroblast growth factor is associated with laser photocoagulation treatment in adult type 2 diabetes mellitus from the Veterans Affairs Diabetes Trial. Metabolism. 2009;58(3):393–400. doi: 10.1016/j.metabol.2008.10.014. [DOI] [PubMed] [Google Scholar]
- 25.Kim W, Essalmani R, Szumska D, Creemers JW, Roebroek AJ, D’Orleans-Juste P, et al. Loss of endothelial furin leads to cardiac malformation and early postnatal death. Mol Cell Biol. 2012;32(17):3382–3391. doi: 10.1128/MCB.06331-11. [DOI] [PMC free article] [PubMed] [Google Scholar]
- 26.Negishi M, Lu D, Zhang YQ, Sawada Y, Sasaki T, Kayo T, et al. Upregulatory expression of furin and transforming growth factor-beta by fluid shear stress in vascular endothelial cells. Arterioscler Thromb Vasc Biol. 2001;21(5):785–790. doi: 10.1161/01.atv.21.5.785. [DOI] [PubMed] [Google Scholar]
- 27.Hutchison CA, Harding S, Hewins P, Mead GP, Townsend J, Bradwell AR, et al. Quantitative assessment of serum and urinary polyclonal free light chains in patients with chronic kidney disease. Clin J Am Soc Nephrol. 2008;3(6):1684–1690. doi: 10.2215/CJN.02290508. [DOI] [PMC free article] [PubMed] [Google Scholar]
- 28.Gilvarry CM, Sham PC, Jones PB, Cannon M, Wright P, Lewis SW, et al. Family history of autoimmune diseases in psychosis. Schizophr Res. 1996;19:33–40. doi: 10.1016/0920-9964(95)00045-3. [DOI] [PubMed] [Google Scholar]
- 29.Chengappa KN, Nimgaonkar VL, Bachert C, Yang ZW, Rabin BS, Ganguli R. Obstetric complications and autoantibodies in schizophrenia. Acta Psychiatr Scand. 1995;92:270–273. doi: 10.1111/j.1600-0447.1995.tb09582.x. [DOI] [PubMed] [Google Scholar]
- 30.Doukas J, Majno G, Mordes JP. Anti-endothelial cell autoantibodies in BB rats with spontaneous and induced IDDM. Diabetes. 1996;45(9):1209–1216. doi: 10.2337/diab.45.9.1209. [DOI] [PubMed] [Google Scholar]