Abstract
Cell fusion technology has been exploited in a wide variety of biomedical applications, and physical, chemical, and biological approaches can all be used to fuse two different types of cells; however, no current technique is adept at inducing both cell pairing and fusion at high efficiencies and yields. Hence, we developed a new method featuring the use of optically induced dielectrophoresis (ODEP) in conjunction with an optically induced, locally enhanced electric field for accurate and automatic cell pairing and fusion on a microfluidic device. After pairing cells via ODEP, a locally enhanced electric field generated by “virtual electrodes” by projecting light patterns was enacted to induce a proper transmembrane potential at the cell contact area such that cell fusion could be triggered by white light exposure. As a fusion yield of 9.67% was achieved between Pan1 and A549 cells, we believe that this may be a promising technique for automatically fusing different cell types.
NOMENCLATURE
- a-Si:H
Hydrogenated amorphous silicon
- AC
Alternating current
- ATCC
American Type Culture Collection
- A549
Adenocarcinomic human alveolar basal epithelial cells
- Cmembr
Capacitance of the cell membrane
- CCD
Charge-coupled device
- DC
Direct current
- DEP
Dielectrophoresis
- DMEM
Dulbecco's modified Eagle's medium
- E
Electric field
- f
Frequency (in Hz)
- fCM (ω)
Clausius-Mossotti factor
- FDEP
Time-averaged dielectrophoretic force
- GFP
Green fluorescent protein
- HEPES
Hydroxyethyl piperazineethanesulfonic acid
- ITO
Indium tin oxide
- ODEP
Optically induced dielectrophoresis
- OICF
Optically induced cell fusion
- OILEF
Optically induced, locally enhanced electric field
- Pan1
Pancreatic cancer cell with endogenously expressed GFP
- PBS
Phosphate buffered saline
- PDMS
Polydimethylsiloxane
- PEG
Polyethylene glycol
- PI
Propidium iodide
- rms
Root mean square
- SSR
Solid-state relay
- UV
Ultraviolet
- v
Velocity
- V
Voltage
- Vpp
Peak-to-peak voltage
- Vtrans
Transmembrane potential of cell membrane
- εm
Relative permittivity of medium
- εp
Relative permittivity of particle
- η
Viscosity of the fluid
- σ
Electric conductivity
- ω
Angular frequency (in radians per second)
I. INTRODUCTION
Cell fusion, whereby different cell types are merged into a hybrid cell, has been exploited in a wide variety of biomedical applications, including induced stem cells, monoclonal antibody production, cancer immunotherapy, gene mapping, tissue regeneration, and many others.1–3 There are three major means of achieving cell fusion: physical (typically electroporation), chemical [via polyethylene glycol (PEG)], and biological (via viruses).4–10 Before fusion, the target cell types must be paired, and this cell pairing process is not trivial; when using traditional approaches, cell pairing and contact issues (e.g., random cell pairing) have both limited the efficiency of cell fusion.8,9 To circumvent some such issues, microfluidic devices have been designed for cell pairing.11,12 For instance, one published method featured a microdevice that was shown to trap two different kinds of cells within a fluid stream by using microstructures.11 In this system, thousands of microstructures composed of two micro-cavities were fabricated in microchannels for cell trapping; this allowed two cells to be paired at a rate of 60%–70%. Then, PEG treatment or electric pulses were applied to enact cell fusion.
Optically induced dielectrophoresis (ODEP) is a promising technique that features the use of light-induced dielectrophoretic (DEP) forces for manipulating micro-particles and cells (oftentimes for biomedical applications).12 It requires only milliwatts (mW) of power to manipulate thousands of micro-particles or cells in an area of only a few mm2. ODEP devices are typically composed of a sandwich structure consisting of two pieces of indium tin oxide (ITO) glass and a spacer.13 One of the ITO glass slides is coated with hydrogenated amorphous silicon (a-Si:H) to serve as a photoconductive layer. The time-averaged DEP force, FDEP, which is induced by illuminating optical patterns for a particle or cell with a radius (r) when loaded in a medium with a relative permittivity of εm, can be expressed as follows:14
where Erms is the root mean square of the alternating-current (AC) electric field and fCM (ω) is the Clausius-Mossotti factor, which is defined by the following equation:14
where fCM (ω) may determine the repelling or attractive force applied on the particles or cells while taking the electric field gradient into consideration, ω is the angular frequency, σ is the conductivity of the medium, and εp is the permittivity of the particle. Note that the repelling or attractive force could be determined by the electric field gradient and Clausius-Mossotti factor. If the force is attractive, the particles or cells could be attracted to the electrodes. Otherwise, they could be repelled away from the electrodes.
The traditional way of generating DEP forces requires complex micro-fabricated electrodes. Alternatively, “virtual electrodes” have also been described by projecting light patterns on the photoconductive layer on the ITO glass.12 Furthermore, such virtual electrodes could also generate a transmembrane potential from a locally enhanced electric field while projecting light patterns on cells, as defined by this equation15
where Vtrans, r, E, and θ are the transmembrane potential, cell radius, magnitude of the applied electric field, and the angle between the electric field and membrane position, respectively. Detailed information about transmembrane potential can be found in Fig. S1. It was reported previously that electrofusion was most successful at a transmembrane potential of 0.5–1 V, at which point membranes become highly porous/leaky;15,16 this permitted the formation of a channel for cytoplasm exchange, which is critical for subsequent cell fusion.
Optically induced cell fusion (OICF) with reasonably high efficiency and yield has been carried out on a microfluidic chip that integrated cell-pairing structures and an OICF module.17 However, it was difficult to retrieve the hybrid cells from the microstructures with this system, a limitation that has thwarted its widespread adoption. To address this issue, we report herein a new method capable of pairing cells and fusing them without the need for the cells to be trapped by microstructures; only light was required to drive cell pairing and fusion. This represents the first time that cell fusion has been achieved by an optically induced, locally enhanced field (OILEF) created within a microfluidic platform.
II. MATERIALS AND METHODS
A. Chip operation and design
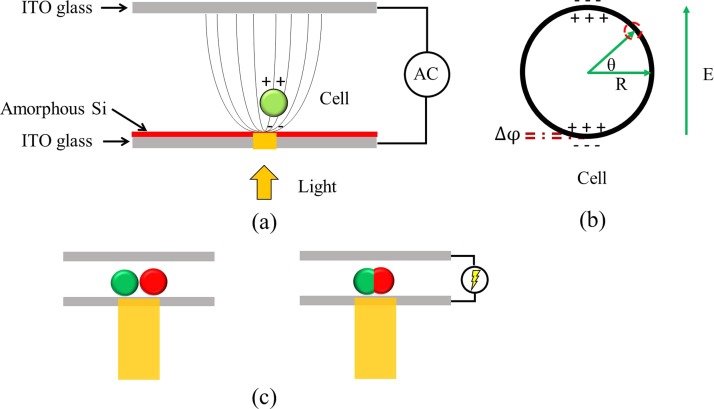
In the developed system, an ODEP force was induced when a light pattern was illuminated on a cell at the same time at which an external electric field was applied across two ITO glass layers [Fig. 1(a)]. Similarly, a transmembrane potential was induced by the locally enhanced electric field when the cell was illuminated [Fig. 1(b)], and this potential was used to fuse two cells brought into contact [Fig. 1(c)].
FIG. 1.
(a) A schematic illustration of the optically induced dielectrophoresis (ODEP) and optically induced cell fusion (OICF) system. (b) When an external electric field was applied to a cell (green circle), a transmembrane potential was generated from the polarizing charges of the inner and outer membranes. (c) The induced transmembrane potential was used to fuse cells (green and red circles) when they were brought into contact.
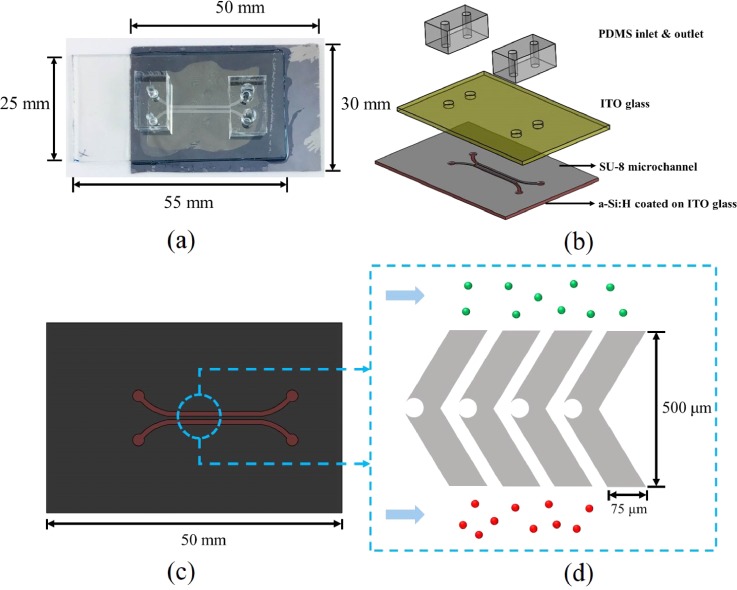
The 65 × 30 × 7 mm3 (length × width × height) ODEP/OICF chip [Fig. 2(a)] was composed of four layers [Fig. 2(b)]. The first polydimethylsiloxane (PDMS) layer contained the liquid channel inlets and outlets. The outlet was larger than the inlet to permit the diffusive flow of the introduced culture media via hydraulic pressure differences. The second layer was ITO glass (Ruilong Inc., Taiwan), which acted as the top electrode. The third layer was a thick, negative photoresist (SU-8, MicroChem Corp., USA) liquid channel, which was patterned with microstructures. It should be noted that these microstructures, which are described in more detail below, only served as temporary reservoirs for cells and did not trap them permanently; this allowed for easier cell retrieval after cell fusion. The final, bottom layer was ITO glass coated with a-Si:H. This material's photoconductivity allowed it to function as a virtual electrode upon illumination.
FIG. 2.
(a) A photograph and (b) an exposed view of the optically induced dielectrophoresis and cell fusion (ODEP/OICF) chip, which was composed of (1) a PDMS inlet and outlet layer, (2) an upper, ITO glass layer, (3) an SU-8 microstructure layer, and (4) a lower, a-Si:H-coated ITO glass layer. (c) A top view of the SU-8 microstructures. There were two parallel liquid channels (upper and lower) divided by a microstructure array. (d) The SU-8 microstructure array was designed to allow cells to flow from each inlet to the cell reservoirs (“notches” in the middle of the structures) such that cells could be paired by using ODEP force and optically fused in the OICF module. The green and red cells correspond to Pan1 and A549 cells, respectively.
The SU-8 layer comprised two parallel liquid channels and microstructure arrays [Figs. 2(c) and 2(d)]. The dimensions of the SU-8 liquid channel were 27 mm × 2 mm × 30 μm (length × width × height). This design allowed for the loading of two different kinds of cells (one to the upper channel and one type to the lower) without inadvertently mixing them prior to fusion. The SU-8 microstructures were chevron-shaped, with notches in the middle (acting as cell reservoirs) to prevent cells from entering the reservoirs randomly. With this design, cells could be sorted into reservoirs by light-driven ODEP forces [Fig. 2(d)]. Afterwards, paired cells within the cell reservoirs could be optically fused by inducing a transmembrane potential on them.
B. Microfabrication
To create the microfluidic device for ODEP and OICF, a-Si:H was first deposited on an ITO substrate with a plasma-enhanced chemical vapor deposition process; this composite unit served as the photoconductive layer. Then, the SU-8 microstructures, which served as the liquid channel for cell inlets/outlets and reservoirs for the cell pairs, were fabricated on the ITO glass coated with an a-Si:H film through a standard photolithography process. Briefly, the ITO glass was first cleaned with deionized (DI) water and sonicated in acetone for 5 min. Then, it was washed again with DI water, dried, and then placed on a hot plate (HP-40D, Shin Kwang Inc., Taiwan) at 95 °C for 5 min. After cleaning, the ITO glass was cooled to room temperature and spin-coated with a 30–μm thick SU-8 layer using a YI-12 spin-coater (ELS System Technology Co., Ltd, Taiwan). Then, it was softbaked at 95 °C for 12 min. The lithography process was performed under an ultraviolet (UV) exposure of 183.3 mJ/cm2. Then, the SU-8 was treated by a two-step post-exposure-bake process, including 65 °C for 1 min followed by 95 °C for 4 min. After SU-8 development, the chip was rinsed with acetone, isopropyl alcohol, and DI water sequentially. Finally, the SU-8 was hardbaked at 130 °C for 1 h. The distance between any two of the resulting microstructures was 20 μm (Fig. 3), a sufficient gap for allowing the entry of two cells.
FIG. 3.
(a) Microscopic image of the SU-8 microstructures, which were constructed on an a-Si:H layer. (b) Scanning electron micrograph of the SU-8 microstructures. The distance between two microstructures was 20 μm (designed to accommodate two cells), and the notches in the center were used as cell reservoirs for the cell pairing and cell fusion processes.
The ITO glass with the SU-8 microstructures was then bonded with the upper ITO glass layer by “Slink 80113” UV glue (Dongguan KaPont Chemical Industrial Corp., China). The detailed assembly process is shown in supplementary material Fig. S2. First, the PDMS layer and the upper ITO glass layer were mechanically drilled to create inlet and outlet holes. Then, the top ITO glass and bottom ITO glass layers were aligned and bonded with UV glue. Finally, the PDMS and upper ITO glass layer were bonded via oxygen plasma treatment.15
C. Preparation of cells
Pancreatic cancer cells expressing the green fluorescent protein (GFP; Pan1)18 and adenocarcinomic human alveolar basal epithelial cells (A549; American Type Culture Collection, ATCC CCL185™, USA) were cultured as recommended by the manufacturers. After cells were trypsinized and washed twice with phosphate-buffered saline (PBS), cells were washed twice with 0.2 M sucrose (Sigma-Aldrich, USA) and re-suspended in 0.2 M sucrose at a final concentration of 104 cells/ml.19 In order to visualize the experimental process, A549 cells were stained with Cell Mask™ Deep Red plasma membrane stain (Life Technologies, USA) as recommended by the manufacturer. Pan1 cells were instead observed by tracking their GFP fluorescence.
D. Preparation of the ODEP/OICF chip
The liquid channels of the ODEP/OICF chip were washed by loading 200 μl of 2.5% (wt) polyethylene glycol-block-poly (propylene glycol)-block-poly (ethylene glycol; P123, Sigma-Aldrich) to prevent bubble formation. After rinsing with 50 μl of 0.2 M sucrose, the liquid channel was injected with 200 μl of 0.1 M bovine serum albumin (BSA, Sigma-Aldrich) to prevent cell adhesion. Finally, 50 μl of 0.2 M sucrose solution was injected into the liquid channel to serve as the media for experiments with live cells for the subsequent ODEP/OICF operation. It is noted that 0.2 M sucrose solution is suitable for generation of ODEP force and OICF while maintaining reasonable cell viability.13
E. Cell manipulation by ODEP
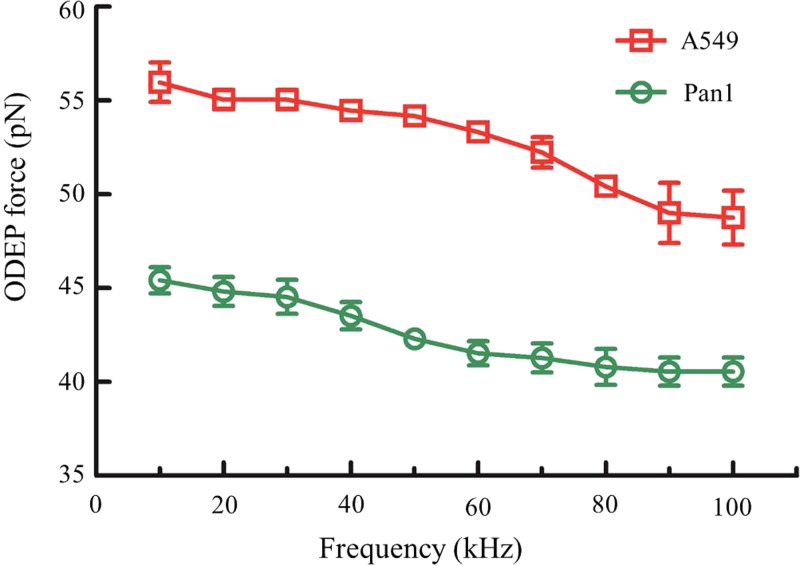
Cells were manipulated with virtual electrodes generated by illuminated light patterns.13 The concentration and the volume of two cells were 104 cells/ml and 1 ml, respectively. The operating voltage for inducing cell movement (for the purpose of cell pairing) was 10 Vpp (peak-to-peak voltage) at 100 kHz. Briefly, this value was chosen because the experimental cells experienced attractive ODEP forces (about 40 pN for Pan1 and 49 pN for A549; discussed in detail later). The white light (1.86 W/cm2) used to generate the ODEP force was provided by a digital projector (PLC-XU106, SANYO, Taiwan). Note that moving light patterns (with a diameter of 30 μm) were used to move cells one by one into the aforementioned cell reservoirs, at which they were optically fused. Operating conditions required for cell pairing are listed in Table I.
TABLE I.
Operating parameters of the optically induced dielectrophoresis and optically induced cell fusion (ODEP/OICF) system. Cells were manipulated under either the cell pairing (AC voltage) or the cell fusion (DC voltage) mode.
| Cell pairing mode | Cell fusion mode | |
|---|---|---|
| Voltage (Vpp) | 10 | 15 |
| Frequency (kHz) | 100 | NA |
| Duration (μs) | NA | 100 (×5 times ) |
| Electric field strength (kV/cm) | 3.3 | 5.0 |
F. Cell fusion by OICF
After cells were brought into contact by ODEP, they were optically fused by the optically induced electroporation generated by the OICF module.16 The operating conditions for cell fusion are listed in Table I. In order to verify the efficacy of optically induced electroporation, a cell electroporation test was performed by using the cell-impermeable nucleic acid stain propidium iodide (PI; 1 mg/ml solution in water, Invitrogen). First, 1 μl of 0.15 mM PI was added to 1 ml of a A549 cell suspension (104 cells/ml) in sucrose buffer (0.2 M) and loaded into the ODEP/OICF chip. After operating the device under the cell pairing mode (Table I), the cell fusion mode (Table I) was enacted to permeabilize them and permit PI entry. The PI electroporated into cells was monitored under a fluorescence charge-coupled device (CCD) camera (DP73, Olympus, Japan). Please note that the DC pulses for cell fusion and electroporation were generated with an AFG-2125 function generator (Good Will Instrument Co., Ltd., Taiwan) connected to (1) an Arduino panel (UNO R3, Arduino, Italy) and (2) solid-state relays (SSR; G3MB-202P 1565E, OMRON, Taiwan).
G. Experimental procedures
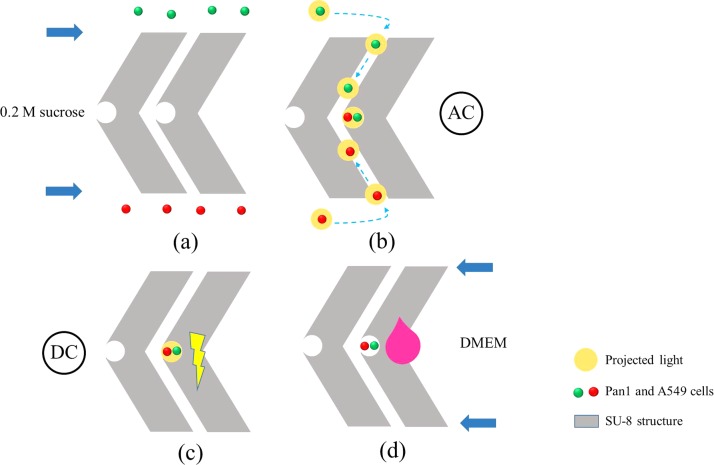
The entire experimental procedure is schematically illustrated in Fig. 4. First, A549 and Pan1 cells were loaded into the respective inlets and pulled through the upper and lower micorchannels via the difference in the hydraulic pressure between the inlet and outlet [Fig. 4(a)]; this also prevents cell diffusion into the SU-8 chevron-shaped microstructures before the cell pairing. Then, the cells were moved to the cell reservoirs between microstructures by ODEP force as described above and in Table I. After cell pairing, DC pulses were used to fuse cells as in Table I. Then, 200 μl of Dulbecco's modified Eagle's medium (DMEM, Sigma-Aldrich) with 20 mM hydroxyethyl piperazineethanesulfonic acid (HEPES, Sigma-Aldrich) were added to each outlet chamber and then sealed with clean coverslip glass for subsequent cell culture. Note that a thermoelectric cooler (TEC1–241.10, Tande, Taiwan) powered by a DC power supply (DP-30032, HILA, Taiwan) was placed underneath the microfluidic chip to keep the temperature at 37 °C (supplementary material Fig. S3), and cells were cultured for 1.5 h. This cell culture step reduced the likelihood of disrupting cell pairs during fusion and hence increased the yield.
FIG. 4.
Schematic illustration of the optically induced dielectrophoresis and optically induced cell fusion (ODEP/OICF) process. (a) Cells in 0.2 M sucrose were gently loaded into the inlets and gradually pulled into the upper and lower SU-8 microchannels by hydraulic pressure differences. (b) Cells were manipulated and paired with white light in the cell reservoirs. (c) Electric pulses were then applied to trigger cell fusion. (d) After fusion, 200 μl of culture media were added to each outlet chamber for on-chip cell culture.
H. Experimental setup
1. ODEP/OICF system
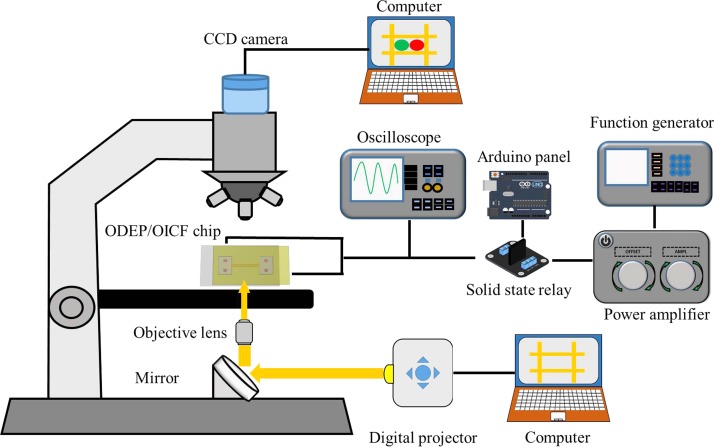
The experimental setup for the ODEP/OICF system was schematically shown in Fig. 5. The ODEP/OICF chip was placed on a stage under an optical microscope (Fig. 5), and a digital CCD camera was used to acquire real-time fluorescence images. The aforementioned digital projector was connected to a computer and used to illuminate the white light onto the a-Si:H layer such that the virtual electrodes were created. Simultaneously, electric signals were provided to the bottom and top ITO glass substrates. The aforementioned function generator connected to an Arduino panel and a SSR was used to supply the required AC and DC signals for ODEP and OICF, respectively, in conjunction with a power amplifier (HA-405, PINTEK, Taiwan). Moreover, an oscilloscope (GDS-1102-U, Good Will Instrument Co., Ltd.) was used to monitor the input electric signals.
FIG. 5.
Experimental setup of the optically induced dielectrophoresis and optically induced cell fusion (ODEP/OICF) system. A power amplifier and a function generator were used to generate the required electrical signals for ODEP and OICF, and an oscilloscope was used for monitoring the electrical output. An Arduino panel connected with solid-state relays was used to control DC signals and produce the electrofusion pulses that triggered cell fusion. A digital projector was used to project the white light onto the ODEP/OICF chip through a mirror. The cell manipulation and fusion processes were recorded with a fluorescent CCD camera.
III. RESULTS AND DISCUSSION
A. Characterization of ODEP force
We first investigated the relationship between the ODEP force and the driving frequency (f), which ranged from 10 Hz to 100 kHz at 10 Vpp, (Fig. 6). Stokes' law was used to calculate the ODEP force in 0.2 M sucrose assuming that the balance between the hydrodynamic drag force on a spherical cell while achieving a terminal velocity and the ODEP force was achieved14
where r, η, and v are the radius of the cell, the viscosity of the fluid, and the terminal velocity of the cell, respectively. The ODEP module could generate a positive (attractive) force towards A549 and Pan1 cells at driving frequencies ranging from 10 kHz to 100 kHz. The ODEP forces for A549 and Pan1 cells reached 56 and 46 pN, respectively, at a driving frequency of 10 kHz, and the corresponding forces at 100 kHz were 49 pN for A549 and 40 pN for Pan1, respectively. The resultant ODEP force could be used to move cells in a buffer with a terminal velocity of over 150 μm/s at a driving voltage of only 10 Vpp. This was a sufficient velocity to move cells throughout the device.
FIG. 6.
Optically induced dielectrophoresis (ODEP) force (attractive) measurements of A549 and Pan1 cells at different driving frequencies (all at 10 Vpp). Error bars represent standard deviation (n = 3).
B. Cell pairing in SU-8 microstructures
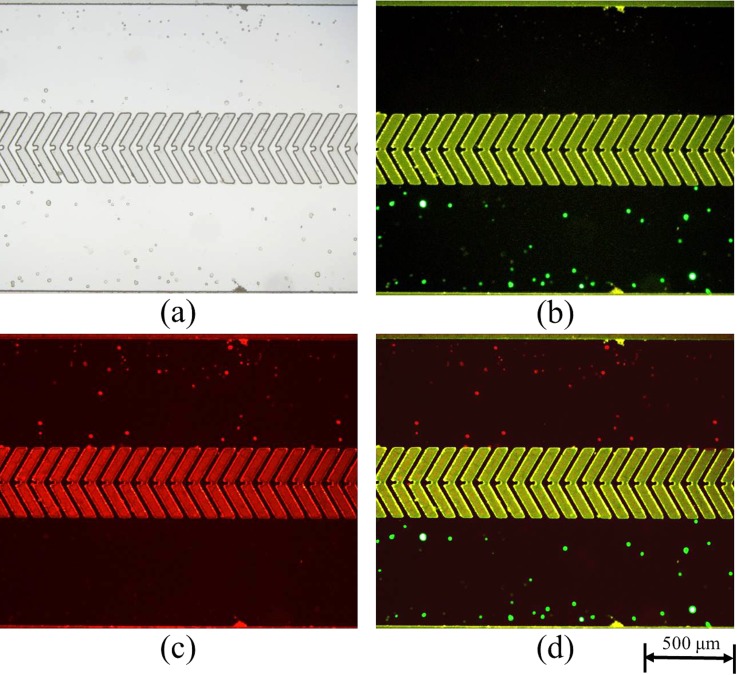
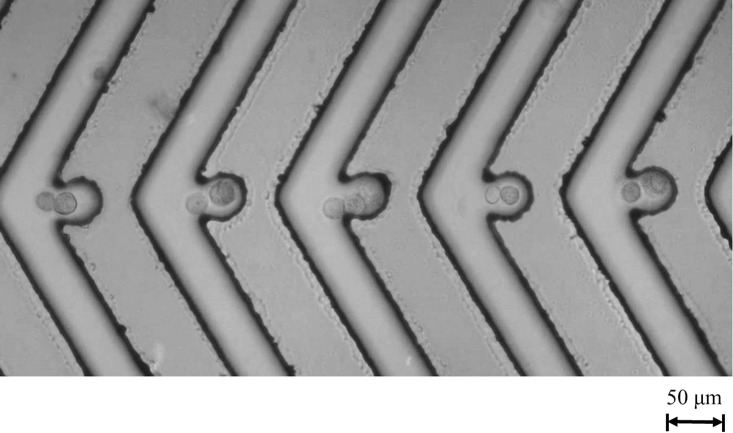
In order to increase the efficiency of cell pairing, both types of cells were injected slowly into their respective inlets to prevent cells from entering the chevron-shaped SU-8 microstructures by hydraulic pressure towards the outlets (Fig. 7). Pan1 [Fig. 7(b)] and A549 cells [Fig. 7(c)] were distributed evenly throughout the channels. After cell loading, both types of cells were moved into the chevron-shaped SU-8 microstructures by ODEP forces. It should be noted that 100 kHz was chosen to avoid cell lysis at low frequencies.13,16 Cells from the upper and lower liquid channels were transported gradually into the cell containers prior to cell fusion (as shown in supplementary material Fig. S4). Multiple cell pairs were successfully moved to the cell reservoirs (Fig. 8), and 9 s were typically required for each cell pairing.
FIG. 7.
Cell distribution upon loading into the SU-8 microstructures. (a) Bright-field view. Fluorescent images of (b) Pan1 (green) and (c) A549 (red) cells. (d) Merged fluorescent image.
FIG. 8.
A CCD image revealing cell pairing on our optically induced dielectrophoresis and optically induced cell fusion (ODEP/OICF) chip after exposure to white moving light patterns.
C. Electroporation
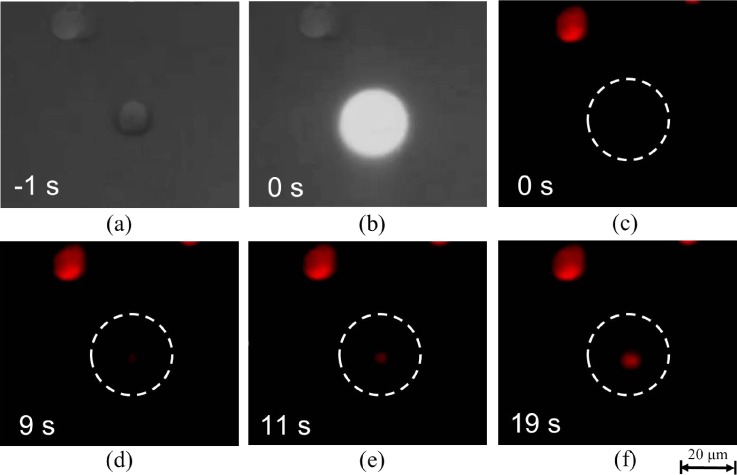
To ensure that DC pulses could induce electroporation for electrofusion, a single A549 cell was first moved to the cell reservoir by ODEP force and applied with DC pulses in the PI-containing 0.2 M sucrose buffer, and PI was observed to stain cytoplasmic RNA (Fig. 9). Experimental results showed that successful electroporation could be optically induced by the developed OICF module.
FIG. 9.
A series of CCD images depicting effective cellular uptake of propidium iodide (PI) via electroporation in the optically induced dielectrophoresis and optically induced cell fusion (ODEP/OICF) chip under the OCIF operating mode. For the representative cell shown (bracketed in white in certain panels), 19 s of electroporation were required to visualize cytoplasmic RNA staining by PI.
D. Cell fusion in the ODEP/OICF chip
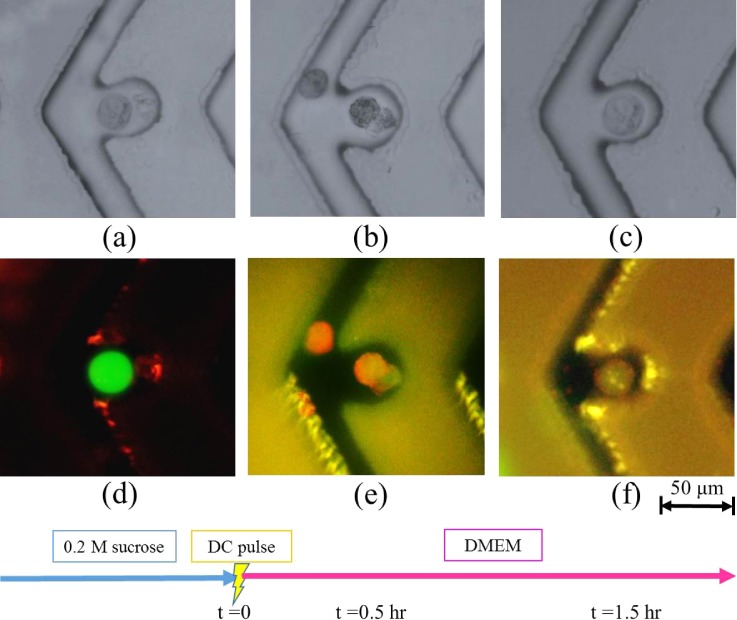
After cell pairing, the operating conditions were switched to the OICF mode to initiate cell fusion in the cell reservoir [Fig. 10(a)]. After the application of DC pulses, cells were observed over a 1.5-h period [Fig. 10(b)]. Cells began to fuse after 30 min, and, by 1.5-h, hybrid cells were evident [Fig. 10(f)]. Bright field microscopy yielded similar results (supplementary material Fig. S5). A fusion percentage of 9.67 ± 4.50% (n = 3) was obtained across 106 cell pairs. This value is lower than that obtained when using structure-assisted OICF (50%),17 PEG-based benchtop methods,21 and electrofusion.20 This may be due to the fact that the structure-assisted OICF achieved cell fusion through cell-trapping microstructures and a specific virtual electrode design. A previous work revealed that these microstructures play a vital role in cell fusion because that keep cells within close proximity of each other.11 Moreover, the switching between AC and DC signals herein might have reduced cell pair contact, thereby decreasing the likelihood of fusion. In addition, the nature of the electricity source, AC or DC, was shown to affect cell fusion in our preliminary experiments. Future works should attempt to optimize the system developed herein such that higher cell fusion efficiencies may be obtained. Nevertheless, the developed method reported here allows one to retrieve fused cells easily after the cell fusion process when compared with previous works.17
FIG. 10.
Optically induced cell fusion (OICF). Phase-contrast and fluorescent images indicated that the cell membranes of the two cells initiated contact after 30 min, transforming into a hybrid cell after 1.5 h.
IV. CONCLUSIONS
A microfluidic device that performed optically induced cell pairing and optically induced cell fusion was demonstrated herein. This chip also featured a cell culture module such that cell fusion could be continuously monitored. Two different cell types could be transported into a cell reservoir, and a proper transmembrane potential could be generated such that cell fusion would occur. Approximately 10% of the Pan1 and A549 cells fused within 2 h using light only; unlike in our prior work,17 cells could be retrieved easily. We therefore believe that this chip-based device has great potential for biomedical applications, such as the production of a specific monoclonal antibody from two cell types.
V. SUPPLEMENTARY MATERIAL
See supplementary material for the schematic illustration of transmembrane potential induced by a local electric field, ODEP/OICF chip assembly process, on-chip cell culture module, cell manipulation, and cell fusion process by using light patterns.
ACKNOWLEDGMENTS
The authors would like to thank Dr. K. H. Cheng of the Institute of Biomedical Science of National Sun Yat-sen University for providing the Pan1 cells. The authors also thank the Ministry of Science and Technology (MOST) of Taiwan for funding this work (MOST 105-2119-M-007-009, MOST 106-2221-E-007-029-MY3, and MOST 106-2221-E-007-001 to G.B.L.). Partial financial support from the “Towards a World-Class University Project” from Taiwan's Ministry of Education is also greatly appreciated.
Note: Preliminary results of the paper have been presented in IEEE NEMS 2017, Los Angeles, USA.
References
- 1. Tada M., Tada T., Lefebvre L., Barton S. C., and Surani M. A., EMBO J. 16(21), 6510–6520 (1997). 10.1093/emboj/16.21.6510 [DOI] [PMC free article] [PubMed] [Google Scholar]
- 2. Sukhorukov V. L., Reuss R., Endter J. M., Fehrmann S., Globa A. K., Geßner P., Steinbach A., Müller K. J., Karpas A., Zimmermann U., and Zimmermann H., Biochem. Biophys. Res. Commun. 346(3), 829–839 (2006). 10.1016/j.bbrc.2006.05.193 [DOI] [PubMed] [Google Scholar]
- 3. Vassilopoulos G., Wang P. R., and Russell D. W., Nature 422(6934), 901–904 (2003). 10.1038/nature01539 [DOI] [PubMed] [Google Scholar]
- 4. Zimmermann U., Pilwat G., and Riemann F., ( Springer–Berlin, Heidelberg, 1974) pp.146–153. [Google Scholar]
- 5. Schwan H. P., ( Springer, New York, 1983) pp. 213–231. [Google Scholar]
- 6. Lentz B. R., Chem. Phys. Lipids 73(1), 91–106 (1994). 10.1016/0009-3084(94)90176-7 [DOI] [PubMed] [Google Scholar]
- 7. Lentz B. R., Eur. Biophys. J. 36(4), 315–326 (2007). 10.1007/s00249-006-0097-z [DOI] [PubMed] [Google Scholar]
- 8. Knutton S., J. Cell Sci. 36(1), 61–72 (1979). [DOI] [PubMed] [Google Scholar]
- 9. Okada Y., Exp. Cell Res. 26(1), 98–107 (1962). 10.1016/0014-4827(62)90205-7 [DOI] [PubMed] [Google Scholar]
- 10. Knutton S., Micron 9(3), 133–154 (1978). [Google Scholar]
- 11. Skelley A. M., Kirak O., Suh H., Jaenisch R., and Voldman J., Nat. Methods 6(2), 147–152 (2009). 10.1038/nmeth.1290 [DOI] [PMC free article] [PubMed] [Google Scholar]
- 12. Chiou P. Y., Ohta A. T., and Wu M. C., Nature 436(7049), 370–372 (2005). 10.1038/nature03831 [DOI] [PubMed] [Google Scholar]
- 13. Lin Y. H. and Lee G. B., Appl. Phys. Lett. 94, 033901 (2009). 10.1063/1.3072593 [DOI] [Google Scholar]
- 14. Huang S. B., Wu M. H., Lin Y. H., Hsieh C. H., Yang C. L., Lin H. C., Tseng C. P., and Lee G. B., Lab Chip 13, 1371–1383 (2013). 10.1039/c3lc41256c [DOI] [PubMed] [Google Scholar]
- 15. Sugar I. P., Forster W., and Neumann E., Biophys. Chem. 26(2-3), 321–335 (1987). 10.1016/0301-4622(87)80033-9 [DOI] [PubMed] [Google Scholar]
- 16. Wang C. H., Lee Y. H., Kuo H. T., Liang W. F., Li W. J., and Lee G. B., Lab Chip 14(3), 592–601 (2014). 10.1039/C3LC51102B [DOI] [PubMed] [Google Scholar]
- 17. Yang P. F., Wang C. H., and Lee G. B., Sci. Rep. 6, 22036 (2016). 10.1038/srep22036 [DOI] [PMC free article] [PubMed] [Google Scholar]
- 18. Zhao S., Ammanamanchi S., Brattain M., Cao L., Thangasamy A., Wang J., and Freeman J. W., J. Biol. Chem. 283(17), 11293–11301 (2008). 10.1074/jbc.M800154200 [DOI] [PMC free article] [PubMed] [Google Scholar]
- 19. Lin Y. H. and Lee G. B., Sens. Actuators, B 145(2), 854–860 (2010). 10.1016/j.snb.2010.01.019 [DOI] [PMC free article] [PubMed] [Google Scholar]
- 20. Zimmermann U., Trends Biotechnol. 1(5), 149–155 (1983). 10.1016/0167-7799(83)90006-9 [DOI] [Google Scholar]
- 21. Zhao Y., Zhao X. T., Chen D. Y., Luo Y. N., Jiang M., Wei C., Long R., Yue W. T., Wang J. B., and Chen J., Biosens. Bioelectron. 57, 245–253 (2014). 10.1016/j.bios.2014.02.026 [DOI] [PubMed] [Google Scholar]
Associated Data
This section collects any data citations, data availability statements, or supplementary materials included in this article.
Supplementary Materials
See supplementary material for the schematic illustration of transmembrane potential induced by a local electric field, ODEP/OICF chip assembly process, on-chip cell culture module, cell manipulation, and cell fusion process by using light patterns.


