

Abstract
Background
Real-time detection of drinking could improve timely delivery of interventions aimed at reducing alcohol consumption and alcohol-related injury, but existing detection methods are burdensome or impractical.
Objective
To evaluate whether phone sensor data and machine learning models are useful to detect alcohol use events, and to discuss implications of these results for just-in-time mobile interventions.
Methods
38 non-treatment seeking young adult heavy drinkers downloaded AWARE app (which continuously collected mobile phone sensor data), and reported alcohol consumption (number of drinks, start/end time of prior day’s drinking) for 28 days. We tested various machine learning models using the 20 most informative sensor features to classify time periods as non-drinking, low-risk (1 to 3/4 drinks per occasion for women/men), and high-risk drinking (≥4/5 drinks per occasion for women/men).
Results
Among 30 participants in the analyses, 207 non-drinking, 41 low-risk, and 45 high-risk drinking episodes were reported. A Random Forest model using 30-minute windows with 1 day of historical data performed best for detecting high-risk drinking, correctly classifying high-risk drinking windows 90.9% of the time. The most informative sensor features were related to time (i.e., day of week, time of day), movement (e.g., change in activities), device usage (e.g., screen duration), and communication (e.g., call duration, typing speed).
Conclusions
Preliminary evidence suggests that sensor data captured from mobile phones of young adults is useful in building accurate models to detect periods of high-risk drinking. Interventions using mobile phone sensor features could trigger delivery of a range of interventions to potentially improve effectiveness.
Keywords: alcohol, smartphone sensors, machine learning, AWARE app
1. INTRODUCTION
Binge drinking, defined as consuming ≥4/5 drinks (women/men) per occasion, is a serious but preventable public health problem, with young adults disproportionately affected [1]. Digital interventions are a promising strategy to reduce excessive alcohol consumption, with most evidence for effectiveness in young adults [2, 3]. Still, effects of digital interventions are typically small [4, 5], suggesting that designs are not optimized.
To improve longitudinal engagement and effects of digital interventions, the right support material should be delivered to the right person at the right time [6]. Therefore, a digital intervention aimed at reducing binge drinking should deliver support “in the moment”, that is, in the context of a drinking episode to enhance motivation for setting and keeping drinking limits, and to reduce the likelihood of negative alcohol-related consequences (i.e., reinforce explicit intentions). To accomplish these goals, it is critical that a digital intervention be able to detect when the person is drinking.
Recent developments in sensor miniaturization provide the ability to collect multimodal data continuously from mobile phones with minimal participant burden. Continuous smartphone sensing can capture time-stamped data elements that can be used to track a person’s daily routine in line with a computer science-based “context aware” theoretical framework [7]. Phone sensor data has been shown to be useful in inferring other states such as mood [8]. Still, it remains unknown whether phone sensors could be useful in detecting periods of drinking.
In previous work [9], we described the computer engineering methods involved in using phone sensors for detection of drinking periods. In this study, we expand upon this work by describing how sensor features differ between periods of high-risk (e.g., binge) drinking, low-risk drinking, and non-drinking. We hypothesized that phone sensor features related to time [10], movement patterns [11, 12], communication [13, 14], and psychomotor impairment [15–17] would contribute to detection models. We also examined the time it takes for machine learning models to reach stability in accuracy, and differences in model performance on weekends versus weekdays. We discuss implications of our findings for delivery of just-in-time mobile interventions.
2. METHODS
This prospective study recruited a convenience sample of young adults with hazardous drinking to provide phone sensor and self-reported measures of alcohol consumption for 28 consecutive days. All participants provided informed consent and were offered resources for alcohol treatment. This study was approved by the Institutional Review Boards at the University of Pittsburgh and Carnegie Mellon University.
2.1 Participants
Recruitment occurred through an Emergency Department (ED) and college campus, using similar methods. From the ED, 51 medically stable patients who were not seeking treatment for substance use, not intoxicated, and who were going to be discharged to home were screened for eligibility. At the college campus, 17 students who responded to study flyers or a Craigslist posting were screened for eligibility. At both sites, individuals who were between the ages of 21–28 years of age, reported recent hazardous alcohol consumption based on Alcohol Use Disorder Identification Test for Consumption (AUDIT-C) score of ≥3 for women or ≥4 for men [18] and at least one high risk drinking occasion (≥4/5 drinks for women/men) on any day in the prior month were eligible for participation. We excluded those who did not own an iOS or Android phone. A total of 38 participants (21 ED patients, 17 students; see Table 1) met enrollment criteria and completed informed consent.
Table 1.
Sample Characteristics
| Characteristics | ED Patients (n=21) |
College students (n=17) |
|
|---|---|---|---|
| Age, mean (SD) | 23.1 (1.7) | 23.9 (1.9) | |
| Female sex, n (%) | 7 (33.3) | 8 (47.1) | |
| Race | White | 8 (38.1) | 4 (23.5) |
| Black | 11 (52.3) | 1 (5.9) | |
| Asian | 1 (4.8) | 12 (70.6) | |
| Other | 1 (4.8) | 0 | |
| Highest education | < High school | 2 (9.5) | 0 |
| High school grad. | 5 (23.8) | 1 (5.9) | |
| Some college | 11 (52.4) | 3 (17.7) | |
| College grad. | 3 (14.3) | 13 (76.4) | |
| AUDIT-C score | 6.0 (2.2) | 6.2 (3.4) | |
| Other drug use, last month | Daily or almost daily tobacco | 2 (9.5) | 2 (11.8) |
| Any cannabis | 12 (57.2) | 6 (35.2) |
2.2 Procedures
Enrolled ED patients completed a brief questionnaire and downloaded the AWARE app [19] to their phone in the ED. Enrolled college students presented to an on-campus office to complete the same questionnaire and download the AWARE app. All participants were instructed to keep the AWARE app open on their phone and to refrain from any non-drinking substance use (excluding cigarette use) during the study period. During enrollment, participants were provided with the definition of a standard drink (e.g., 12 oz. can of beer or 5 oz. glass of wine or 1.5 oz. 80-proof liquor) as well as an illustration of a typical standard drink for common beverage types: beer, wine, liquor. From the day after enrollment through 28 days, participants were sent a text-message (EMA) at 10am: “Did you drink alcohol yesterday?” If they reported drinking, they received the following text queries: ““Approximately what time did you start drinking?”, “Approximately what time did you stop drinking?”, and “How many standard drinks did you have during this period?” If there were multiple drinking episodes in a day, participants were instructed to report the episode when the largest number of drinks was consumed. All other potential drinking periods that day were coded as non-drinking. Participants received $20 for completing the baseline survey and $2 for each day they completed EMA.
2.3 AWARE App
When downloaded, AWARE app [19], for iOS and Android, places an icon on the phone screen which, when opened, automatically begins recording sensor data without requiring further participant interaction. When AWARE is opened for the first time, a unique IDwas randomly generated for research purposes. AWARE temporarily stored the sensor data on a participant’s device and then synchronized this information to a university server over a secure connection via Wi-Fi every 30 minutes, when available. We configured AWARE to collect 56 sensor features related to time (e.g., day of week, time of day), movement patterns (e.g., accelerometry, rotation), communication (e.g., phone calls, texts), and psychomotor impairment (e.g., keystroke speed; available for Android phones only)).
2.4 Measures
2.4.1 Baseline Questionnaire
Demographics. Participants reported age, sex, race, ethnicity, and education. Drug use. NM-ASSIST [20] assessed frequency of past month drug use (e.g., tobacco, cannabis, opiates). Alcohol Consumption. AUDIT-C [18], includes 3 items on drinking quantity and frequency in the past 3 months. AUDIT-C score ≥4 for men, and ≥3 for women is considered positive [21].
2.4.2 Event-Level Alcohol Use
We used daily text message reports of alcohol use to label time periods (i.e. windows) as non-drinking, low-risk (1 to 3/4 drinks per episode for women/men), and high-risk (≥4/5 drinks per episode for women/men).For example, if a female reported consuming 5 drinks on the prior day, starting at 5pm and ending at 8pm, the time between 5pm-8pm was labeled “high-risk drinking”, whereas all other times that day were labeled “non-drinking” (Supplemental Figure 1). We labeled the time after drinking offset as “non-drinking” although blood alcohol concentration may still be elevated, given that activities likely differ between active drinking and end of drinking.
2.5 Analyses
2.5.1 Protocol Adherence and Data Preparation
We measured two main components of protocol adherence: 1) completion of daily text queries, and 2) time running the AWARE app on their phone. We excluded individuals who did not provide ≥1 report of a day with no drinking and ≥1 report of a day on which alcohol was consumed over the 28 days (n=2); or manually disabled sensor plug-ins, closed the AWARE app, or turned off the smartphone for >80% of days (n=6). If there were brief time periods (<1 hour) when sensor data was not captured, we interpolated average values based on neighboring data. The non-drinking, low-risk drinking, and high-risk drinking episodes with sensor data were first divided into non-overlapping 5 minutesegments which were used to extract sensor features. The analyses examined 30-minute, 1-hour, and 2-hour “windows”, which aggregated (e.g., averaged for numerical values) sensor data over the relevant 5-minute segments. As an example outcome of interest, using the 30-minute window, there were 12,442 total segments across participants, which were labeled “non-drinking” (n=11,798), “low-risk drinking” (n=243), or “high-risk drinking” (n=401).
We created three non-overlapping datasets using all of the coded segments across participants (e.g., N=12,442 coded segments using 30-minute window size). The “training” dataset (60% of coded segments) was used to select features and build the initial model, “cross-validation” dataset (20%) optimized the initial model (e.g., modified feature weighting to optimize performance), and “test” data (20%) evaluated the optimized model’s performance. To reduce imbalances that can bias model building due to under-represented events (i.e., low- and high-risk drinking), in the training dataset, we used Synthetic Minority Over-Sampling Technique (SMOTE) [22]. For example, prior to SMOTE, the training dataset (30-minute window) included 7078 non-drinking, 145 low-risk drinking, and 240 high-risk drinking segments. After SMOTE, non-drinking segments did not change (n=7078), whereas low-risk increased to 1160, and high-risk segments increased to 960, reducing imbalance.
2.5.2 Model Building
For both raw sensor data (e.g., number of calls) and processed sensor data (e.g., min/max, standard deviation), we ran correlation and Information Gain [23] analyses to identify the 20 most informative features in the “training” dataset. We used the “cross-validation” dataset to select the top 20 features and to optimize the model built with the training dataset. Using only the top-20 features identified in training and cross-validation datasets, we evaluated the following machine learning classifiers on the “test” dataset: C4.5 decision tree, Bayesian Network (BN) and Random Forest (RF) for each window size (30-minutes, 1-hour, 2-hours). Multiple methods evaluated model performance [24]: accuracy, Kappa, F-score, and Receiver Operating Characteristic (ROC) [9]. We report Kappa and ROC as they provide good representation of results across methods.
Using the “test” dataset, we also determined whether phone sensor data collected before drinking onset (1-, 2-, 3-days; “historical sensor data”; Supplemental Figure 1) improved model performance, hypothesizing that there may be changes in patterns of activity that routinely precede alcohol use. We then evaluated model performance for detecting drinking on weekends (Friday to Sunday) versus weekdays (Monday to Thursday), based on research showing that drinking on these days involve different processes [25]. Finally, we compared model performance using (1) only time of day and day of week, and (2) all top-20 sensor features against a naïve model (ZeroR) that predicts the most frequent (largest N) class. We also explored the amount of time in days for the best performing model to stabilize (i.e., accuracy does not change beyond a small threshold, by adding more additional training data). This is a measure of how many days of data must be collected to build a detection model for a new individual. We also examined whether single sensor features (e.g., number of calls), in addition to time of day and day of week, improved accuracy of the best performing model.
3. RESULTS
3.1 Protocol Adherence: Daily Query and Sensor Data
3.1.1 Adherence rates
To the 38 enrolled, we sent out a total of 1064 daily surveys, among which 764 (71.8%) were completed. Completion rates decreased from 87.9% on day 1 to 53.9% by day 28, with the greatest decline in the last week (Figure 1). Sensor data was captured on 57% of the 28 days. Across the 30 participants in the analyzed sample, who did not differ significantly in baseline attributes from the 38 enrolled, there were 207 days on which no drinking was reported, 41 days on which a low-risk drinking episode was reported and 45 days on which a high-risk drinking episode was reported where both sensor and drinking data were available. Participants reported an average of 6.9 (SD=6.7) non-drinking, 1.4 (SD=1.9) low-risk drinking, and 1.5 (SD=1.6) high-risk drinking episodes. 22 participants provided at least 1-week of data, 20 provided at least 2-weeks of data, and 10 provided at least 3 weeks of data.
Figure 1.
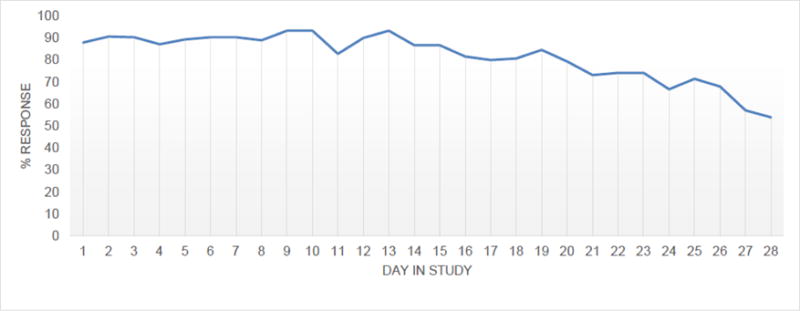
Daily Query Response Rates Over 28 Study Days
3.1.2 Drinking episode characteristics
Mean number of drinks consumed during an entire low-risk drinking episode was 2.2 (SD=1.0), and during a high-risk drinking episode was 7.6 (SD=2.7), with a maximum of 15 drinks. Low- and high-risk drinking episodes were distributed across participants (Supplementary Figure 2). Regarding drinking onset, 41.2% of drinking episodes commenced between 8–9 pm and 40.7% stopped after midnight. Almost half (47%) of low-risk drinking episodes occurred on weekends whereas 69.7% of high-risk drinking occurred on weekends (Figure 2).
Figure 2.
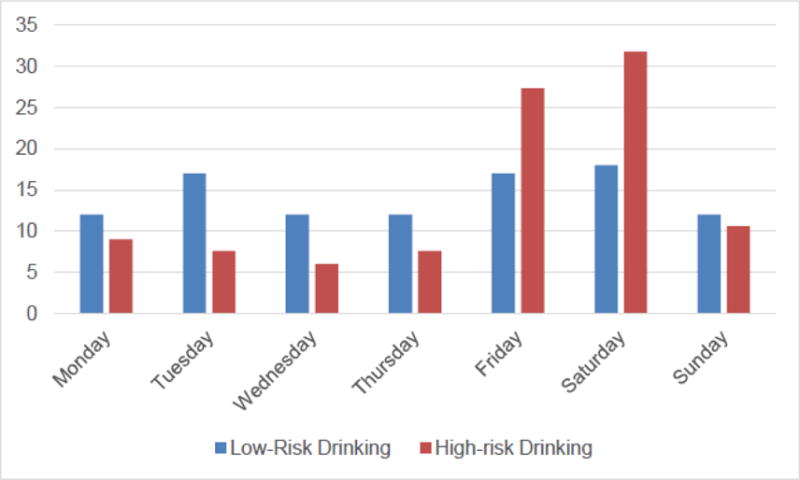
Drinking Episodes by Day of Week
3.2 Correlation of Sensor Features with Drinking
Using 1-hour windows, drinking categories were significantly correlated with time of day (r=0.11) and day of week (r=0.06), in addition to 9 other sensor-based features measuring phone usage (e.g., screen interaction, r=0.07) and movement features (e.g., transitions between walking and in vehicle; r= 0.03). Many of these correlations increased when adding historical data of 23-, 47- and 71-hours prior to that categorized hour.
3.3 Information Gain and Descriptive Statistics for Select Sensor Features
Information Gain, using 1-hour windows, applied to the “training” dataset identified the top 20 sensor features associated with drinking cateogires [9]. During high-risk drinking windows, there were higher activity levels, and higher change in activity levels, yet lower distance travelled compared to low-risk and non-drinking (Table 2). There were also longer average periods of screen duration and lower frequency of phone unlocking during high-risk drinking windows compared to low-risk and non-drinking windows. Regarding communication features, there were longer and more missed calls during high-risk drinking windows, compared to low-risk drinking windows. For typing features, there was greater time between keypresses, more text deletions and insertions, and greater use of happy emoticons during high-versus low-risk drinking, and non-drinking windows.
Table 2.
Mean Values per 1-Hour Window of Select Sensor Features by Drinking Classification
| Features | Non-drinking | Low-Risk Drinking | High-Risk Drinking |
|---|---|---|---|
|
| |||
| Movement Features | |||
|
| |||
| Activity level | 4.98 | 3.67 | 5.75 |
| Count of changes in activities | 5.71 | 5.72 | 8.24 |
| Distance traveled (meters) | 43.3 | 56.27 | 28.35 |
| Phone Usage Features | |||
|
| |||
| Screen duration (secs) | 23.19 | 16.32 | 57.27 |
|
| |||
| Phone screen unlocks (per min) | 13.41 | 3.24 | 1.48 |
|
| |||
| Communication Features | |||
|
| |||
| Duration of outgoing calls (secs) | 29.02 | 5.13 | 11.93 |
| Time between keypress (msec) | 513.63 | 502.16 | 743.35 |
| Letter deletions | 14.75 | 11.58 | 16.30 |
Note: Information Gain Analyses using 1-hour window
3.4 Machine Learning Model Performance
3.4.1 Best performing model and inclusion of “historical” sensor data
Among the machine learning models tested, Random Forest (RF) generally performed best. The following results are for RF applied to “test” dataset. The best performing model to detect drinking overall used RF, 30-minute windows and 3-days of historical data, which had a Kappa of 0.804 and ROC of 0.961, correctly classifying non-drinking 98.5% of the time, low-risk drinking 70.2% of the time, and high-risk drinking 84.4% of the time.
The best performing model to detect high-risk drinking, however, used RF, 30-minute windows and 1-day of historical data. In this model, the “1-day” (including the current 30-minute window being classified) corresponds to 23.5 hours of historical data in 30-minute windows, for a total of 47 windows, plus the 30 minute window being evaluated. The total number of features in this model was 48 windows * 20 top-features = 960 total features. In this model, Kappa increased to 0.842 and ROC to 0.976 (relative to RF using 30-minute windows and 3-days of historical data), correctly classifying non-drinking 97.9% of the time, low-risk drinking 68.3% of the time, and high-risk drinking 90.9% of the time. In this optimal model to detect high-risk drinking, the 9.09% of actual high-risk drinking segments that were misclassified (n=7), and the 31.7% of actual low-risk drinking segments that were misclassified (n=13), were all incorrectly classified as non-drinking (Supplemental Table).
3.4.2 RF model performance in detecting weekday versus weekend drinking
Using RF to detect both weekend and weekday drinking using 30 minute windows and 3-days of historical data in the “test” dataset, performance was slightly lower for detecting weekday (Kappa=0.728, ROC=0.951) compared to weekend drinking (Kappa=0.832, ROC=0.991). Based on this RF model, high-risk drinking was correctly classified 81.8% of weekdays versus 80.4% of weekends, whereas low-risk drinking was correctly classified 35.3% of weekdays versus 87.1% of weekends.
3.4.3 RF models using time of day/day of week and single sensor feature to detect drinking
Comparing the performance of RF models (30-minute window, 3-day historical data) in the “test” dataset using only time of day and day of week, and all top-20 sensor features against a naïve model (ZeroR), the RF model using all top-20 features showed a relative improvement in accuracy of around 6% compared to a RF model using only time of day and day of week (Figure 3). It took approximately 10 days for the RF model (30-minute window, 3-day historical data) to reach a stable accuracy (around 96%) regardless of what subset we chose for training. Finally, when examining whether individual sensor features, in addition to time of day and day of week, improved model performance, for the RF model, 30-minute window without any historical data, only time between keypress improved performance, albeit slightly. The two sensor features that independently improved performance in a RF model, 30-minute window with 1-day of historical data, were number of incoming calls and screen interaction duration.
Figure 3. Cumulative Accuracy of Random Forest Models (30-minute window, 3-day historical data) Over 28 Days.
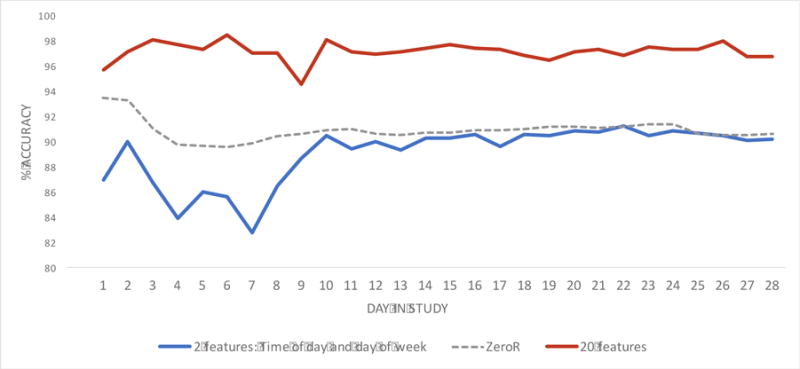
X-axis represents number of days (maximum 28 days), Y-axis represents accuracy of classifying non-drinking, low-risk, and high-risk drinking. The Red and Blue lines represent results from Random Forest (30-minute window, 3-days of historical data) model, since it had the best overall performance in classifying non-drinking, low-risk, and high-risk drinking. Red line: only top-20 features were used for classification. Blue line: only 2 features, time of day and day of week, were used for classification. ZeroR model (dashed line) is a naïve model that just predicts the most frequent ‘N’ class. The graph depicts cumulative accuracy up to a given day, and not accuracy per day. Cumulative accuracy was determined by incrementally training models on successively larger sets of data. The figure shows higher classification accuracy (i.e., non-drinking, low-risk drinking, high-risk drinking) when using the top-20 features (red line) compared to the model using only time of day and day of week (blue line).
4. DISCUSSION
Preliminary evidence suggests that sensor data captured from mobile phones of young adults are useful in building accurate models to detect periods of high-risk drinking. Our study design has several noteworthy strengths. First, we recruited a diverse sample of young adults from two different settings that are both key points of contact for providing brief alcohol interventions [2, 5]. We longitudinally captured onset and offset of prior day’s drinking using daily recall, minimizing potential reporting biases [26]. Our outcomes classified high- and low-risk drinking windows separately, since type of behavioral support provided for these events differ. We tested several machine learning models, varying time windows for detection and amounts of historical data to detect low- and high-risk drinking. Finally, we examined differences in accuracy of models for detecting weekend versus weekday drinking.
We found that time of day and day of week alone resulted in accuracy of 90% in detecting low- and high-risk drinking, which is consistent with research examining timing of young adult drinking [10]. Adding other phone sensor features (e.g., change in activity) resulted in a 6% increase in accuracy, which represents 1 out of 16 (on average) times when we improve classification. In this regard, important phone sensor features to detect drinking included movement (activity change), device usage (e.g., screen duration), communication (e.g., call duration) and typing (speed/errors). There seemed to be more change in activities (e.g., walking, in a vehicle) associated with high-risk drinking. Also, prior to high-risk drinking, there were more incoming calls and longer screen interactions, which fit with the social-ecological model of alcohol use [11, 12], in which drinking and making plans to drink are social activities.
Within high-risk drinking windows, we found increased time between keystrokes, which is in line with a pharmacological model of the effects of alcohol on psychomotor functioning [15, 16]. Alternatively, these sensor-based features could simply reflect, for example, distractions in social settings, or some combination of the acute effects of alcohol on psychomotor functioning and environmental context [27].
Based on the accuracy of our optimized model, we can detect high-risk drinking periods with 90% accuracy, within 30 minutes after drinking onset, using data collected over a relatively short time (~10 days). Thus, for 9 out of 10 high-risk drinking periods, we theoretically have the potential to intervene early during a drinking episode (e.g., within 30-minutes after drinking onset) to enhance motivation toward setting drinking limits and/or intervene later to reduce the likelihood of negative alcohol-related consequences. Example interventions include delivering supportive messaging, or contacting supportive friends or family.
Despite high accuracy, the model also generated false classifications. As one day is composed of forty-eight 30-minute windows, a 2.1% false positive rate means around one “30-minute window” where an individual was not drinking was estimated as drinking per day. A 9.1% false negative rate means that around four “30-minute windows” per day when an individual is in a high-risk drinking episode would be misclassified as non-drinking. To minimize intervening during non-drinking windows, without missing any potential drinking occasion, a program could send an electronic (e.g. text message) query to individuals to verify at that moment whether or not they are drinking. Missing high-risk drinking events completely is unlikely given that consecutive misclassification over two 30-minute windows is probabilistically rare.
This pilot study is limited by the small sample size and by the amount of missing sensor data. Although we did not systematically record reasons for missing sensor data, feedback from participants who stopped the AWARE app involved concerns about privacy, data usage, or perception of battery drain. Generalizability of results may be limited, since participants who did not provide adequate data for analysis were excluded, and these excluded individuals would not be eligible for interventions that rely on the detection model. In addition, we used self-report of alcohol use, which has demonstrated reliability and validity [28], but may be subject to bias. We only coded the episode of heaviest drinking on a given day if there were multiple drinking episodes, which could affect model accuracy (i.e., result in more false negatives). Future work could use some form of alcohol sensor (e.g., WrisTAS) to validate findings, and to examine number and pacing of drinks consumed. Machine learning models, which are data-driven, do not provide explanations regarding why a feature is related to an outcome, but may have potential to inform more dynamic theories of behavior [29]. Finally, although we used training, cross-validation, and testing data sets, we did not externally validate our model.
5. Conclusions
Phone sensors can provide useful data for use in machine learning models to accurately detect high-risk drinking in young adults. Although these results need to be replicated in a larger sample, next generation mobile interventions could consider using phone sensor features analyzed in real-time by machine learning algorithms to trigger just-in-time behavioral support.
Highlights.
Mobile phone sensor data is useful in building accurate models to detect periods of drinking.
Useful sensor features relate to activity/movement, phone use/calls, and keystrokes.
Interventions could use phone sensor features to trigger remote support when it is most needed.
Acknowledgments
Role of Funding Sources
There was no direct funding for this project. BS and TC both receive funding from NIAAA for related work: Grant K23 AA023284 (to BS) and R01 AA023650 (to BS&TC).
Footnotes
Publisher's Disclaimer: This is a PDF file of an unedited manuscript that has been accepted for publication. As a service to our customers we are providing this early version of the manuscript. The manuscript will undergo copyediting, typesetting, and review of the resulting proof before it is published in its final citable form. Please note that during the production process errors may be discovered which could affect the content, and all legal disclaimers that apply to the journal pertain.
Contributors
Authors BS, TC, and AD designed the study and wrote the protocol. Authors DF and SB conducted literature searches for background and discussion and provided summaries of previous research studies. Authors BS and SB conducted the statistical analysis. Author BS wrote the first draft of the manuscript and all authors contributed to and have approved the final manuscript.
Conflict of Interest
The authors have no conflicts of interest to disclose.
References
- 1.Center for Behavioral Health Statistics and Quality. Key substance use and mental health indicators in the United States: Results from the 2015 National Survey on Drug Use and Health (HHS Publication No. SMA 16-4984 NSDUH Series H-51) 2016 Available from: http://www.samhsa.gov/data/
- 2.Carey KB, Scott-Sheldon LA, Elliott JC, Garey L, Carey MP. Face-to-face versus computer-delivered alcohol interventions for college drinkers: a meta-analytic review, 1998 to 2010. Clinical Psychology Review. 2012;32:690–703. doi: 10.1016/j.cpr.2012.08.001. [DOI] [PMC free article] [PubMed] [Google Scholar]
- 3.Fowler LA, Holt SL, Joshi D. Mobile technology-based interventions for adult users of alcohol: A systematic review of the literature. Addictive Behaviors. 2016;62:25–34. doi: 10.1016/j.addbeh.2016.06.008. [DOI] [PubMed] [Google Scholar]
- 4.Berman AH, Gajecki M, Sinadinovic K, Andersson C. Mobile Interventions Targeting Risky Drinking Among University Students: A Review. Current Addiction Reports. 2016;3:166–174. doi: 10.1007/s40429-016-0099-6. [DOI] [PMC free article] [PubMed] [Google Scholar]
- 5.Suffoletto B, Kristan J, Chung T, Jeong K, Fabio A, Monti P, Clark DB. An Interactive Text Message Intervention to Reduce Binge Drinking in Young Adults: A Randomized Controlled Trial with 9-Month Outcomes. PLoS One. 2015;10:e0142877. doi: 10.1371/journal.pone.0142877. [DOI] [PMC free article] [PubMed] [Google Scholar]
- 6.Nahum-Shani I, Smith SN, Spring BJ, Collins LM, Witkiewitz K, Tewari A, Murphy SA. Just-in-Time Adaptive Interventions (JITAIs) in Mobile Health: Key Components and Design Principles for Ongoing Health Behavior Support. Annals of Behavioral Medicine. 2016 doi: 10.1007/s12160-016-9830-8. [DOI] [PMC free article] [PubMed] [Google Scholar]
- 7.Abowd GD, AK D, PJ B, N D, M S, P S. Towards a Better Understanding of Context and Context-Awareness. In: Gellersen HW, editor. Handheld and Ubiquitous Computing. Springer-Berlin: Heidelberg; 1999. [Google Scholar]
- 8.Mohr DC, Zhang M, Schueller SM. Personal Sensing: Understanding Mental Health Using Ubiquitous Sensors and Machine Learning. Annual Review of Clinical Psychology. 2017;13:23–47. doi: 10.1146/annurev-clinpsy-032816-044949. [DOI] [PMC free article] [PubMed] [Google Scholar]
- 9.Bae S, Ferreira D, Suffoletto B, Puyana JC, Kurtz R, Chung T, Dey AK. Detecting drinking episodes in young adults using smartphone-based sensors. PACM Interactive Mobile Wearable Ubiquitous Technology (IMWUT) 2017;1 doi: 10.1145/3090051. [DOI] [PMC free article] [PubMed] [Google Scholar]
- 10.Del Boca FK, Darkes J, Greenbaum PE, Goldman MS. Up close and personal: temporal variability in the drinking of individual college students during their first year. Journal of Consulting and Clinical Psychology. 2004;72:155–64. doi: 10.1037/0022-006X.72.2.155. [DOI] [PubMed] [Google Scholar]
- 11.Gruenewald PJ, Remer LG, LaScala EA. Testing a social ecological model of alcohol use: the California 50-city study. Addiction. 2014;109:736–45. doi: 10.1111/add.12438. [DOI] [PMC free article] [PubMed] [Google Scholar]
- 12.Freisthler B, Lipperman-Kreda S, Bersamin M, Gruenewald PJ. Tracking the When, Where, and With Whom of Alcohol Use: Integrating Ecological Momentary Assessment and Geospatial Data to Examine Risk for Alcohol-Related Problems. Alcohol Research: Current Reviews. 2014;36:29–38. doi: 10.35946/arcr.v36.1.04. [DOI] [PMC free article] [PubMed] [Google Scholar]
- 13.Cavazos-Rehg PA, Krauss MJ, Sowles SJ, Bierut LJ. Hey Everyone, I’m Drunk.” An Evaluation of Drinking-Related Twitter Chatter. Journal of Studies on Alcohol and Drugs. 2015;76:635–43. doi: 10.15288/jsad.2015.76.635. [DOI] [PMC free article] [PubMed] [Google Scholar]
- 14.Moewaka Barnes H, McCreanor T, Goodwin I, Lyons A, Griffin C, Hutton F. Alcohol and social media: drinking and drunkenness while online. Critical Public Health. 2016;26:62–76. [Google Scholar]
- 15.Scholey AB, Benson S, Neale C, Owen L, Tiplady B. Neurocognitive and mood effects of alcohol in a naturalistic setting. Human Psychopharmacology. 2012;27:514–6. doi: 10.1002/hup.2245. [DOI] [PubMed] [Google Scholar]
- 16.Suffoletto B, Goyal A, Puyana JC, Chung T. Feasibility and Acceptability of Using an App Help Identify Psychomotor Function Impairments during Drinking Occasions. Substance Abuse. doi: 10.1080/08897077.2017.1356797. (in press) [DOI] [PMC free article] [PubMed] [Google Scholar]
- 17.Suffoletto B, Gharani P, Chung T, Karimi H. Using Phone Sensors and an Artificial Neural Network to Detect Gait Changes During Natural Drinking Episodes. Gait and Posture. doi: 10.1016/j.gaitpost.2017.11.019. (in press) [DOI] [PMC free article] [PubMed] [Google Scholar]
- 18.Bradley KA, DeBenedetti AF, Volk RJ, Williams EC, Frank D, Kivlahan DR. AUDIT-C as a brief screen for alcohol misuse in primary care. Alcoholism: Clinical and Experimental Research. 2007;31:1208–17. doi: 10.1111/j.1530-0277.2007.00403.x. [DOI] [PubMed] [Google Scholar]
- 19.Ferreira D, Kostakos V, Dey AK. AWARE: Mobile Context Instrumentation Framework. Frontiers in ICT. 2015;2 [Google Scholar]
- 20.Humeniuk R, Ali R, Babor TF, Farrell M, Formigoni ML, Jittiwutikarn J, de Lacerda RB, Ling W, Marsden J, Monteiro M, Nhiwatiwa S, Pal H, Poznyak V, Simon S. Validation of the Alcohol, Smoking And Substance Involvement Screening Test (ASSIST) Addiction. 2008;103:1039–47. doi: 10.1111/j.1360-0443.2007.02114.x. [DOI] [PubMed] [Google Scholar]
- 21.Rubinsky AD, Dawson DA, Williams EC, Kivlahan DR, Bradley KA. AUDIT-C scores as a scaled marker of mean daily drinking, alcohol use disorder severity, and probability of alcohol dependence in a U.S. general population sample of drinkers. Alcoholism: Clinical and Experimental Research. 2013;37:1380–90. doi: 10.1111/acer.12092. [DOI] [PubMed] [Google Scholar]
- 22.Chawla NV, Bowyer KW, Hal LO, Kegelmeyer WP. SMOTE: synthetic minority over-sampling technique. Journal of artificial intelligence research. 2002;16:321–357. [Google Scholar]
- 23.Xu Y, Chen L. Term-frequency based feature Selection methods for Text Categorization. IEEE Genetic and Evolutionary Computing (ICGEC), 2010 Fourth International Conference. 2010:280–283. [Google Scholar]
- 24.Powers DMW. Evaluation: from precision, recall and F-measure to ROC, informedness, markedness and correlation. International Journal of Machine Learning Technology. 2011;2:37–63. [Google Scholar]
- 25.Lau-Barraco C, Braitman AL, Linden-Carmichael AN, Stamates AL. Differences in weekday versus weekend drinking among nonstudent emerging adults. Experimental and Clinical Psychopharmacology. 2016;24:100–9. doi: 10.1037/pha0000068. [DOI] [PMC free article] [PubMed] [Google Scholar]
- 26.Shiffman S. Ecological momentary assessment (EMA) in studies of substance use. Psychological Assessment. 2009;21:486–97. doi: 10.1037/a0017074. [DOI] [PMC free article] [PubMed] [Google Scholar]
- 27.Tiplady B, Oshinowo B, Thomson J, Drummond GB. Alcohol and cognitive function: assessment in everyday life and laboratory settings using mobile phones. Alcoholism: Clinical and Experimental Research. 2009;33:2094–102. doi: 10.1111/j.1530-0277.2009.01049.x. [DOI] [PubMed] [Google Scholar]
- 28.Simons JS, Wills TA, Emery NN, Marks RM. Quantifying alcohol consumption: Self-report, transdermal assessment, and prediction of dependence symptoms. Addictive Behaviors. 2015;50:205–12. doi: 10.1016/j.addbeh.2015.06.042. [DOI] [PMC free article] [PubMed] [Google Scholar]
- 29.Riley WT, Rivera DE, Atienza AA, Nilsen W, Allison SM, Mermelstein R. Health behavior models in the age of mobile interventions: are our theories up to the task? Translational Behavioral Medicine. 2011;1:53–71. doi: 10.1007/s13142-011-0021-7. [DOI] [PMC free article] [PubMed] [Google Scholar]