

Abstract
This study examined the number of days of global positioning system (GPS) monitoring needed to measure attributes of an individual’s routine activity space. Multiple alternative activity space representations (cumulative, mean daily), measures (kernel density, route buffer, convex hull), and attributes (area size, supermarkets, fast food restaurants, parks) were examined. Results suggested wide variability in required GPS days to obtain valid estimates of activity space attributes (1-23 days). In general, fewer days were needed for mean daily activity space representations, kernel density measures, and densities of environmental exposures (vs. counts). While kernel density measures reliably estimated between-person differences in attributes after just a few days, most variability in environmental attributes for convex hull and route buffer measures was within-person. Based on these results, a minimum of 14 days of valid GPS data is recommended to measure activity spaces.
Keywords: Activity Space, Environmental Exposure, GPS, Neighborhood, Reliability, Validity
Introduction
Environmental influences on health behaviors and outcomes are the focus of considerable research attention. This research is almost exclusively based on environmental exposures in neighborhoods where people live (Chaix, Merlo et al. 2009, Leal, Chaix 2011, Perchoux, Chaix et al. 2013), defined in various ways ranging from administrative units such as census tracts to Euclidean or street-network buffers. Results from this research are often inconsistent, with some studies finding associations in hypothesized directions and others not. Activity spaces offer a promising complement to residential neighborhoods for measuring people’s environments to avoid the “local trap” and better understand how the environment affects health behaviors and outcomes (Kwan 1999, Cummins 2007).
While conceptualizations vary across disciplines, activity spaces include locations where activities are carried out such as work, school, and shopping, as well as the travel routes between these locations (Golledge, Stimson 1997, Chaix, Kestens et al. 2012). Daily mobility as well as the home location determine activity spaces (Rainham, McDowell et al. 2010). Activity spaces also include locations that are seen during travel but not necessarily visited (Schönfelder, Axhausen 2004) (e.g., liquor stores or parks passed during travel or near activity locations). Some conceptualizations emphasize that activity spaces refer to locations of and movement between regular activities, although “regular” (e.g., daily, weekly, monthly) is rarely defined (Sherman, Spencer et al. 2005). Similarly, regular or routine activity spaces are sometimes distinguished from activity spaces more generally over a given time period (Chaix, Kestens et al. 2012, Sherman, Spencer et al. 2005). Definitions rooted in time geography extend the conceptualization to stress the accessible area given time-location constraints (Kwan 1999, Hägerstraand 1970). Here we conceptualize an activity space as the area in which an individual moves or travels during activities over a given time period (Gesler, Albert 2000, Golledge, Stimson 1997). We view both routine activity spaces, which reflect the subset of locations regularly visited and corresponding travel routes, and daily deviations from these routine activity spaces as potentially important for health and health behaviors, differentially capturing chronic and acute environmental exposures, respectively.
While activity spaces are of growing interest in health research (Perchoux, Kestens et al. 2015, van Heeswijck, Paquet et al. 2015, Shareck, Kestens et al. 2014, Zenk, Schulz et al. 2011, Kestens, Lebel et al. 2012, Lebel, Kestens et al. 2012, Shareck, Kestens et al. 2016, Malpede, Greene et al. 2007, Browning, Soller 2014, Mason, Mennis et al. 2015, Shareck, Kestens et al. 2013), there is little agreement on how to measure them. Activity logs and travel diaries in which participants record all activity locations they visit were traditionally used to assess hubs for activity space measurement, but have high participant burden and thus are impractical for use for more than a couple of days. Questionnaires have emerged in which participants are asked about a limited set of non-residential activity locations, sometimes as few as 5 (Inagami, Cohen et al. 2007) or 9 (Shareck, Kestens et al. 2014, Shareck, Kestens et al. 2013), but also up to 20 in one questionnaire (Chaix, Kestens et al. 2012). However, with these types of measures, actual travel routes are ignored and relevant activities that serve as main hubs within one’s activity space are likely to vary across subgroups (e.g., by age, gender, employment status, socioeconomic status), potentially resulting in systematic measurement error or bias to the extent that the measured activity space differentially omits relevant activity locations for different subgroups.
Global positioning system (GPS) tracking has tremendous potential for measuring activity spaces because of the high spatial and temporal resolution, within-person longitudinal data it can yield on where an individual travels and spends time, how frequently and for how long, and in what sequence with low participant burden (Chaix, Meline et al. 2013). GPS tracking also facilitates research on not only associations between routine activity space environmental exposures and health behaviors and outcomes (Perchoux, Kestens et al. 2015), but also contributions of daily deviations in the activity space to daily variations in health behaviors and psychosocial factors (e.g., stress, emotions) (Freisthler, Lipperman-Kreda et al. 2014, Kirchner, Cantrell et al. 2013, Lipperman-Kreda, Morrison et al. 2015). While it has technical limitations (e.g., signal loss, poor compliance) and other methodological issues (e.g., selective mobility bias) that require careful attention (Chaix, Meline et al. 2013, Kestens, Thierry et al. 2016, Hurvitz, Moudon et al. 2014, Rainham, Bates et al. 2012), GPS monitoring is becoming increasingly common for activity space research. This emerging research has most frequently used one week or less of monitoring (Krenn, Titze et al. 2011, Sadler, Gilliland 2015, Byrnes, Miller et al. 2015, Gustafson, Christian et al. 2013, Chambers, Pearson et al. 2017, Browning, Soller 2014, Burgoine, Jones et al. 2015, Lipperman-Kreda, Morrison et al. 2015, Tamura, Elbel et al. 2017, Zenk, Schulz et al. 2011, Kestens, Thierry et al. 2016, Zenk, Schulz et al. 2012, Duncan, Regan et al. 2014), with little known about the extent to which the derived activity spaces reflect routine activity spaces. In fact, the number of days of GPS tracking needed for reliable and valid measurement of routine activity space environments is largely unknown. This lack of knowledge on an appropriate temporal window for GPS data collection is a major barrier to advancement of next generation studies on the environment and health using an activity space framework.
As one of the first studies to address this barrier, we sought to determine the number of days of GPS tracking needed to obtain reliable and valid estimates of the size of and environmental exposures in one’s routine activity space over one month. A one-month activity space captures not only routine daily activities (e.g., commuting) but also routine activities that have different temporal frequencies yet may serve as important activity space hubs (e.g., trips to a gym three times per week, weekly visits to a place of worship or supermarket, bi-weekly or monthly trips to the mall or a relative’s home). We operationalized an individual’s routine activity space as their cumulative 28-day activity space, which follows the usual approach (though often based on 7 days total data). While less commonly employed (Kwan 1999), we also used a mean value of an individual’s daily activity spaces over 28 days as an alternative routine activity space measure, which essentially weights the activity space according to the individual’s daily exposures and thus dampens the effect by unusual activity locations and travel routes. In keeping with commonly used activity space measures in the literature, we used three alternative measures: convex hull (minimal polygon that encompasses all activity locations and has no internal angles greater than 180 degrees), route buffer (area around all activity locations including routes that an individual travels between activity locations), and kernel density surface (intensity surface for raster grid based on the calculation of a value within each grid cell of a count of activity locations within the local neighborhood, defined by a search radius) (Lee, Davis et al. 2015, Sherman, Spencer et al. 2005). This latter measure weights the activity space based on cumulative duration of time within each grid cell. We measured activity space size/area and three environmental exposures common in obesity research: supermarkets, fast food restaurants, and parks. Data are from the Activity Space and Contextual Measures of Environmental Exposures (ASCMEE) study.
Methods
Setting and Sample
The setting for this study was four contiguous community areas of Chicago’s west side: Austin, Humboldt Park, Logan Square, and West Town. These contiguous communities were selected to facilitate recruitment of a racially/ethnically and socioeconomically diverse sample living in the same general area, roughly equidistant from the central business district. Overall, in 2011–2015, these communities were 36% African American, 31% Latino, and 29% non-Hispanic white, with 36% of residents with a college degree and 24% of residents with household incomes below the federal poverty level (Patrick 2009). These four communities in aggregate were 15.2 square miles and had 25 supermarkets (1.6 per mi2), 119 fast food restaurants (7.8 per mi2), and 16 parks (comprising 5.0% of total land area). We recruited a non-probability sample of working age (18-64) adults from these four community areas.
Data Collection Procedure
Data collection consisted of two phases; data from the first phase are used in this study. In the first phase (September 2015-April 2016), we asked participants to complete 30 days of data collection that included three visits to a public university located approximately 2-6 miles from the study area: baseline, midpoint (~day 15), and final (~day 30) visit. During the baseline visit, participants provided informed consent, completed a questionnaire, and learned how to use study equipment. During the data collection/field period, participants were asked to wear a GPS data logger (Qstarz BT-Q1000XT) and accelerometer (ActiGraph GT1M) while awake on an elastic waist band for 30 consecutive days. Staff contacted participants twice weekly by telephone or email during the field period. They returned at the approximate midpoint (day 15) for data downloading from the equipment. This visit also served as an in-person check-in with participants to answer questions and discuss compliance issues. During the final visit, participants completed an additional questionnaire. Participants received either a public transit card or paid parking at each visit. Some participants were delayed in completing their final visit and of their own volition continued wearing their equipment; these participants had more than a 30-day field period. Participants were compensated per study visit and per day of GPS/accelerometer data up to a maximum of $165. This study was approved by the University of Illinois at Chicago Institutional Review Board (protocol number 2015-0164).
Measures
Activity space measures
The GPS data logger recorded location on a one-minute epoch. GPS data were pre-processed using multiple steps. First, we uploaded the files for each participant into the Physical Activity Location Measurement System (PALMS) (Patrick 2009). PALMS is a web-accessible service that facilitates the merging and processing of raw time-stamped data from multiple separate devices such as accelerometers and GPS loggers. Among its features, PALMS pre-processes the GPS data to detect and filter implausible data points (Center for Wireless and Population Health Systems 2011). Second, we created one file of all merged post-PALMS data for each participant. Third, we created an adjusted date variable for analysis spanning from 4:00 am on the corresponding date to 3:59 am the following day to account for participant travel that continued past 12:00 am (Klepeis, Nelson et al. 2001, Goodchild, Janelle 1984). Fourth, we removed the days of the midpoint and final visits (day 1 began at 4:00 am the day following the baseline visit) in order to avoid biasing participants’ activity spaces by trips to the university, as well as any days of valid GPS data beyond day 30. Fifth, we eliminated days that did not meet wear criteria of at least one GPS point and 6 hours ActiGraph wear time. [ActiGraph data were pre-processed using MeterPlus (Santech, Inc., San Diego, CA, 2011). A minimum of 60 consecutive minutes of zero activity intensity counts identified non-wear.] This step—combining a low GPS wear threshold with ActiGraph wear criteria—allowed us to include days on which participants were compliant with wearing equipment but with low GPS points due to signal loss in their homes. Sixth, we removed GPS points that were more than 50 miles outside the study area and their associated trips in order to minimize bias from occasional travel (e.g., vacation, business trips) not representative of participants’ routine activity space. Overall, 73 trips across 21 participants were removed, resulting in the complete exclusion of 25 days (in which the participant spent the whole day outside the study area) across 14 participants. Finally, remaining days were indexed such that days of valid data were treated as consecutive days for analysis, even if the time period was interrupted by invalid days (e.g., days not meeting wear criteria based on the ActiGraph, trip outside study area).
We then constructed three different activity space measures based on the post-processed GPS data. For each participant, we constructed two conventional measures of activity space: convex hull (using the minimum bounding geometry tool) and route buffer (using both the points to line and buffer tools) using ArcGIS 10.2.1. The route buffer measure was constructed at both 240 meters (m) and 500 m. We present results for 500 m only in this paper as the substantive interpretation of our results are similar for the smaller buffer size. Of these two conventional activity space measures, we prefer the route buffer measure because it explicitly measures where people traveled. In order to take into account time spent at locations and thus exposure duration, we also derived kernel density surfaces (using the kernel density tool in the ArcGIS 10.3 Spatial Analyst toolbox). For the reasons made clear in the analysis section, we constructed single day measures (i.e., day 1; day 2; day 3…day 28), mean daily measures (i.e., mean days 1 and 2; mean days 1, 2, 3; …mean days 1, 2…28), and cumulative day measures (i.e., days 1-2; days 1-3;…days 1-28) for each participant.
We measured not only the geographic size (in square miles) of the convex hull and route buffer but also a selection of environmental exposures for each participant’s single and cumulative 28-day activity spaces: supermarkets, fast food restaurants, and parks. We selected these environmental attributes because they are commonly used in obesity research, potentially contributing to different sides of the energy balance equation, and because of differences in their spatial distribution within the urban environment (e.g., fast food restaurants are more common than supermarkets). Supermarkets were defined as standard industrial classification (SIC) codes 541101-541109 (excluding 541103) and >$2M annual sales (InfoUSA 2014 quarter 4). Fast food restaurants were defined as SIC code 58120601 or 581203 (Dun & Bradstreet 2014 quarter 4). Parks were measured based on 2014 data merged from NAVTEQ and TeleAtlas, and then deduplicated. Specifically, we measured counts and densities (number per mi2) of supermarkets and fast food restaurants. For parks, we measured counts of unique parks and the percentage of the activity space that was park land. The density measures and percent park land measure adjust for differences in the variable size of activity space. Kernel density measures for supermarkets, fast food restaurants, and parks were created using 30 m by 30 m cells and a fixed 500 m bandwidth (matching the route buffer diameter).
Participant characteristics
We described the sample using a number of demographic characteristics: age, gender, race/ethnicity (African American or non-Hispanic black, Hispanic or Latino, non-Hispanic white), age in years, education (no high school diploma/GED; high school diploma/GED only; trade/vocational school, associate’s degree, or some college; bachelor’s degree or higher), employment (currently employed, retired, disabled, student, unemployed, other), annual household income (<$15,000, $15,000-29,999, ≥$30,000), home ownership (owned, rented, other), auto ownership (leased or owned, neither), marital status (single or never married, married/living with partner, separated/divorced, widowed), and length of residence in the neighborhood in years.
Statistical Analysis
Our main analytic strategy was modeled after studies testing how many days of monitoring with an accelerometer or pedometer are needed to measure typical physical activity (Matthews, Ainsworth et al. 2002, Kang, Bassett et al. 2009). Reliability of GPS data to measure activity space attributes over incrementally longer measurement periods up to 28 days was assessed using intraclass correlation coefficients (ICC). An ICC is an estimate of the proportion of the variation in the activity space attribute (e.g., supermarket density) that is between-person versus within-person day-to-day variability. To derive the ICCs, we used restricted maximum likelihood mixed regression models, with days nested within participants and mean daily activity space environmental attributes (e.g., mean daily supermarket density in the daily activity space over 7 days) as the dependent variables. We did not calculate ICCs for the cumulative activity space attributes (e.g., supermarket density over a cumulative 7-day activity space) due to concerns about non-independence of observations when each subsequent cumulative measure is composed of the previous measure plus any daily change. Regression models were repeated, increasing the number of days on which the outcome was based in each successive model (e.g. mean days 1, 2; mean days 1, 2, 3; mean days 1, 2, 3, 4) until all days (i.e. days 1…28) were included. ICC values were then calculated for each model from estimated variance components to determine how many days must be included in the model to reach an acceptable level of reliability. We considered an ICC >0.80 to be acceptable reliability to differentiate people with different typical activity space attributes (e.g., people with high and low supermarket densities in their route buffer) (Matthews, Ainsworth et al. 2002, Kang, Bassett et al. 2009, Tudor-Locke, Burkett et al. 2005), although 0.70 is sometimes used as well (Trost, Pate et al. 2000).
Validity was assessed using two approaches: mean absolute percentage error (MAPE) and explained variance (R2) from regression models (Kang, Bassett et al. 2009). MAPE is based on absolute percentage error (APE), and is calculated using the following formula
with x representing the attribute value, i representing the measurement period (e.g., 7 days), and n is the total number of participants. We calculated APE for both the mean daily values over 28 days and the cumulative 28-day values. APE values were calculated for each combination of days (e.g., day 1, mean days 1 and 2, mean days 1, 2, 3…mean days 1…28 for mean daily measures; day 1, days 1-2, days 1-3…days 1-28 for cumulative measures) for each participant. The MAPE was then calculated as the mean of all participants’ APE scores for the mean daily measures and the cumulative measures. Estimates of <20% indicate acceptable validity, as smaller MAPE values indicate the activity space attribute for the measurement period is closer to participants’ true 28-day activity space attribute (Kang, Bassett et al. 2009). Related to the MAPE for activity space size/area, we also present descriptive statistics on the proportion of the 28-day cumulative activity space surface that is covered after 7 (days 1-7), 14 (days 1-14), and 21 (days 1-21) days.
Second, we used regression analysis to estimate how many valid GPS days were needed to predict the 28-day activity space attribute, for both the mean daily measures and the cumulative measures (Tudor-Locke, Burkett et al. 2005). Specifically, for the mean daily outcome measures, we conducted a series of hierarchical regression models. Specifically, we regressed the mean daily 28-day activity space measure (i.e., mean of daily values for days 1-28) on the day 1 activity space measure and then included an additional consecutive single day measure to each regression model (e.g., Model 1: day 1; Model 2: day 1, day 2; Model 3: day 1, day 2, day 3…; Model 28: day 1, day 2, day 3,…day 28). For the cumulative outcome measures, we conducted a series of bivariate regression models. Specifically, we regressed the cumulative 28-day measure on lower level cumulative day measures, with the independent variable in each subsequent model incorporating an additional day (e.g., Model 1: day 1; Model 2: cumulative days 1-2, Model 3: cumulative days 1-3…; Model 27: cumulative days 1-27). The adjusted R2 value for each model indicates the percentage of variance in the 28-day activity space measure that was explained by the model. We considered an adjusted R2>0.80 to indicate the number of valid GPS days required to adequately predict the 28-day activity space attribute. All analyses were completed using SPSS 24 (Chicago, IL).
Results
We enrolled (i.e., consented) 101 participants, 97 of whom participated in at least one day of data collection. On average, these 97 participants were in the field for 29.4 days (SD 10.3) and had 23.7 valid days of GPS data (SD 7.4). Half of these participants had 4 or fewer invalid GPS days (mean 2.4, SD 4.7). This analysis is based on those 34 participants who had at least 28 valid days of GPS data. Half of these had no or one invalid GPS days (mean 2.4, SD 1.7).
Table 1 shows demographic characteristics of the analytic sample (n=34). Most (over 80%) were Hispanic/Latino or non-Hispanic black/African American, and one-third were employed and 38% owned a car. Among the largest differences when comparing 34 participants in the analytic sample to the 67 participants who began data collection but did not have 28 valid days worth of GPS data, the analytic sample was less likely to be non-Hispanic white, have a bachelor’s degree, and be currently working; more likely to own a home; and have longer duration of residency in their current neighborhood. They were similar on other characteristics (e.g., age, gender, income, auto ownership). (See Supplemental Table 1.)
Table 1.
Sample characteristics
| Analytic sample
|
|
|---|---|
| N | 34
|
| M (SD) | |
|
|
|
| Age (in years) | 45.0 (13.3) |
| Residency (in years) in current neighborhood | 15.9 (13.6)
|
| %
|
|
| Women | 55.9 |
| Race/ethnicity | |
| Non-Hispanic white | 17.6 |
| Hispanic/Latino | 20.6 |
| Non-Hispanic Black/African American | 61.8 |
| Highest level of education completed | |
| No high school diploma or GED | 8.8 |
| High school diploma or GED only | 29.4 |
| Trade/vocational school, associate’s degree, or some college | 38.2 |
| Bachelor’s degree or higher | 23.5 |
| Employment statusa | |
| Working now | 32.4 |
| Retired | 11.8 |
| Disabled | 8.8 |
| Student | 14.7 |
| Unemployed | 17.6 |
| Other | 14.7 |
| Annual household income | |
| Less than $15,000 | 33.3 |
| $15,000 - $29,999 | 36.4 |
| $30,000 or more | 30.3 |
| Receive government assistance (e.g., WIC, SNAP) | 52.9 |
| Own home | 35.3 |
| Own or lease a car | 38.2 |
| Marital status | |
| Single or never married | 58.8 |
| Married/living with partner | 23.5 |
| Separated | 5.9 |
| Divorced | 11.8 |
| Widowed | 0.0 |
M = mean SD = standard deviation GED = general equivalency diploma WIC = Supplemental Program for Women, Infants, and Children SNAP = Supplemental Nutrition Assistance Program
Participants had the option to indicate more than one employment status. Responses were categorized hierarchically in the order listed (e.g., a participant who indicated they are both currently working and a student is classified here as currently working
Table 2 shows descriptive statistics for attributes of participants’ 28-day activity spaces, specifically size/area and the three environmental exposures: supermarkets, fast food restaurants, and parks. The top panel shows results for the cumulative 28-day measures, while the bottom panel shows results for the mean daily measures over 28 days. These descriptives indicate, for example, that participants’ activity spaces vary tremendously in size and environmental exposures. Supplemental Table 2 shows corresponding descriptives for 7-, 14-, and 21-day activity spaces.
Table 2.
Descriptive statistics for 28-day activity space measures
| Cumulative 28-Day Measures | Mean Daily Measures, 28 Days | |||||||||||
|---|---|---|---|---|---|---|---|---|---|---|---|---|
|
|
||||||||||||
| M (SD) | Min | Q1 | Med | Q3 | Max | M (SD) | Min | Q1 | Med | Q3 | Max | |
| Convex Hull | ||||||||||||
| Area (mi2) | 147.12 (146.33) | 19.83 | 43.45 | 75.27 | 200.14 | 537.87 | 10.89 (8.11) | 0.35 | 4.95 | 9.07 | 15.24 | 30.46 |
| Supermarkets | ||||||||||||
| Count | 133.71 (87.45) | 20 | 75 | 106 | 178 | 368 | 14.35 (13.23) | 0.64 | 5.57 | 11.93 | 18.61 | 71.18 |
| Density | 1.29 (0.58) | 0.42 | 0.79 | 1.17 | 1.73 | 2.79 | 1.86 (1.5) | 0.25 | 0.97 | 1.46 | 2.23 | 8.15 |
| Fast food restaurants | ||||||||||||
| Count | 1059.5 (681.3) | 118 | 578 | 895.5 | 1361 | 2849 | 113.21 (109.59) | 5.14 | 38.57 | 102.21 | 127.39 | 579.93 |
| Density | 10.36 (5.43) | 3.41 | 5.93 | 9.17 | 14.37 | 25.97 | 12.32 (5.63) | 2.75 | 6.87 | 12.90 | 15.29 | 22.01 |
| Parks | ||||||||||||
| Count | 187.74 (176.26) | 25 | 64 | 105 | 258 | 653 | 15.67 (11.26) | 0.68 | 7.04 | 14.05 | 20.21 | 47.07 |
| Landa | 0.06 (0.02) | 0.03 | 0.04 | 0.05 | 0.06 | 0.12 | 0.03 (0.02) | 0.01 | 0.02 | 0.03 | 0.04 | 0.08 |
|
| ||||||||||||
| 500m Route Buffer | ||||||||||||
| Area (mi2) | 46.25 (24.31) | 13.09 | 28.40 | 38.48 | 66.34 | 97.10 | 6.62 (3.17) | 1.22 | 4.40 | 6.73 | 8.88 | 13.33 |
| Supermarkets | ||||||||||||
| Count | 64.06 (30.49) | 17 | 42 | 62 | 83 | 150 | 10.3 (6.29) | 1.54 | 5.21 | 10.20 | 13.18 | 29.96 |
| Density | 1.51 (0.57) | 0.55 | 1.11 | 1.47 | 1.87 | 2.99 | 1.63 (0.71) | 0.26 | 1.09 | 1.53 | 2.12 | 3.37 |
| Fast food restaurants | ||||||||||||
| Count | 554.82 (255.68) | 113 | 419 | 570 | 719 | 1097 | 84.01 (60.57) | 12.00 | 37.32 | 73.18 | 107.25 | 276.00 |
| Density | 13.29 (6.12) | 4.04 | 9.74 | 11.82 | 17.69 | 30.30 | 12.85 (7.17) | 3.34 | 7.03 | 12.17 | 17.34 | 36.89 |
| Parks | ||||||||||||
| Count | 72.47 (36.29) | 17 | 44 | 62.5 | 103 | 154 | 11.37 (5.84) | 1.07 | 7.00 | 11.54 | 15.32 | 25.64 |
| Landa | 0.06 (0.02) | 0.03 | 0.04 | 0.05 | 0.06 | 0.10 | 0.04 (0.03) | 0.01 | 0.03 | 0.04 | 0.05 | 0.18 |
|
| ||||||||||||
| Kernel Density | ||||||||||||
| Supermarkets | 0.80 (1.03) | 0.01 | 0.09 | 0.33 | 1.03 | 3.93 | 0.80 (1.03) | 0.01 | 0.09 | 0.33 | 1.02 | 3.93 |
| Fast food restaurants | 5.10 (3.43) | 0.51 | 2.00 | 4.83 | 7.71 | 14.14 | 5.09 (3.42) | 0.51 | 2.00 | 4.81 | 7.71 | 14.14 |
| Parks | 24.48 (30.32) | <0.01 | 8.38 | 19.19 | 27.61 | 163.23 | 24.48 (30.32) | 0.00 | 8.35 | 19.19 | 27.59 | 163.23 |
M = mean SD = standard deviation Min = minimum Q = quartile Med = median Max = maximum mi = miles
Park land measures for convex hull and 500m route buffer are the proportion of the activity space area that is park land.
Figure 1 (panels a-d) presents ICC results for different measurement periods, ranging from 2 valid days to 28 valid days, for mean daily activity space area/size, supermarkets, fast food restaurants, and parks. In general, ICCs for the kernel density activity space measures for supermarkets and parks usually exceed 0.80, even based on a few days of valid GPS data. The ICCs for kernel density activity space measures for fast food restaurants sometimes exceed 0.70, but there is no clear time frame after which the ICCs remain above 0.70 and they never exceed 0.80. Furthermore, for the route buffer and convex hull activity space measures, the ICCs for area/size and any of three environmental attributes never exceed 0.70.
Figure 1.
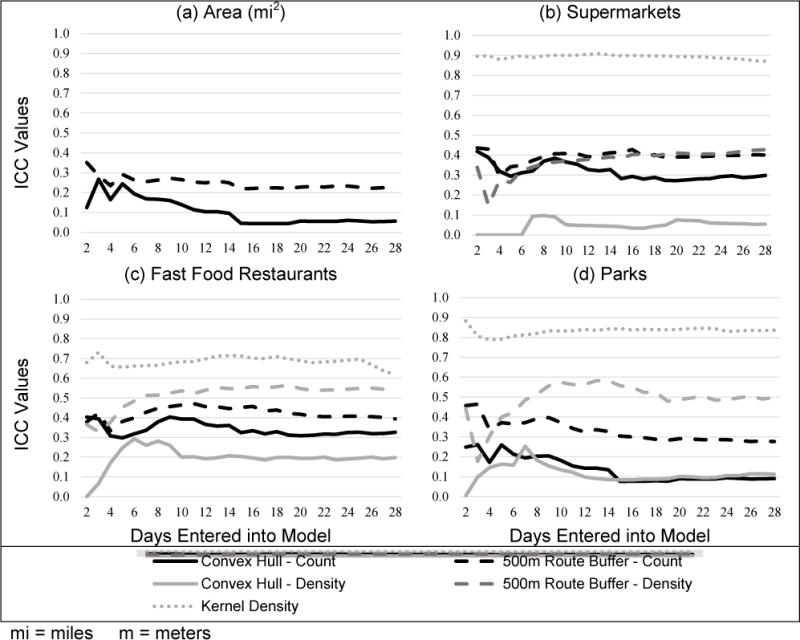
Intraclass correlation coefficient (ICC) values for mean daily activity space measures for different measurement periods, ranging from 2 days to 28 days
Table 3 summarizes median ICCs for the mean daily activity space measures across all measurement periods, ranging from 2 days to 28 days. The median ICCs for kernel density measures of supermarkets and parks are 0.89 and 0.84 respectively, while it is 0.68 for fast food restaurants. This indicates that as much as 89% of the variation in these exposures based on kernel density measures is between people, whereas as little as 11% is within-person, reflecting day-to-day variability. For the route buffer measures, the median ICCs range from 0.23 for area/size (indicating 77% of the variation within-person) to 0.54 for fast food restaurant density. For the convex hull measures, the median ICCs are generally lower; the lowest median ICC is also found for area/size (0.06) and the highest median ICC is for fast food restaurant counts (0.33).
Table 3.
Descriptive statistics for intraclass correlation coefficients (ICC) of mean daily activity space measures
| Convex Hull | 500m Route Buffer | Kernel Density | |||||||||||||
|---|---|---|---|---|---|---|---|---|---|---|---|---|---|---|---|
|
|
|||||||||||||||
| Min | Q1 | Med | Q3 | Max | Min | Q1 | Med | Q3 | Max | Min | Q1 | Med | Q3 | Max | |
|
|
|||||||||||||||
| Area/size | |||||||||||||||
| Area (mi2) | 0.04 | 0.05 | 0.06 | 0.15 | 0.27 | 0.22 | 0.23 | 0.23 | 0.26 | 0.35 | |||||
| Supermarkets | |||||||||||||||
| Count | 0.27 | 0.29 | 0.30 | 0.33 | 0.42 | 0.29 | 0.39 | 0.40 | 0.41 | 0.44 | |||||
| Density | 0.00 | 0.04 | 0.05 | 0.06 | 0.10 | 0.15 | 0.36 | 0.39 | 0.41 | 0.43 | 0.87 | 0.89 | 0.90 | 0.90 | 0.91 |
| Fast food restaurants | |||||||||||||||
| Count | 0.30 | 0.32 | 0.33 | 0.36 | 0.40 | 0.33 | 0.40 | 0.42 | 0.45 | 0.47 | |||||
| Density | 0.00 | 0.19 | 0.20 | 0.20 | 0.29 | 0.33 | 0.52 | 0.54 | 0.55 | 0.57 | 0.62 | 0.67 | 0.68 | 0.70 | 0.73 |
| Parks | |||||||||||||||
| Count | 0.08 | 0.09 | 0.09 | 0.19 | 0.26 | 0.28 | 0.29 | 0.30 | 0.37 | 0.46 | |||||
| Landa | 0.01 | 0.09 | 0.10 | 0.13 | 0.25 | 0.18 | 0.48 | 0.50 | 0.55 | 0.58 | 0.79 | 0.83 | 0.84 | 0.84 | 0.88 |
M = mean SD = standard deviation Min = minimum Q = quartile Med = median Max = maximum mi = miles m = meters
Park land measures for convex hull and 500m route buffer are the proportion of the activity space area that is parkland
Table 4 presents the minimum number of valid days of GPS data necessary to reach a MAPE <0.20 and an adjusted R2>0.80. For the MAPE analyses, between 7 and 15 days are required for the MAPE to fall below 0.20 for both mean daily and cumulative kernel density surface measures. For the other activity space measures (route buffer, convex hull), in general, fewer valid GPS days are needed for the MAPE to fall below 0.20 for the mean daily measures compared to the cumulative measures. To estimate 28-day area/size for both the route buffer and convex hull measures, between 10 and 20 valid GPS days are needed for the MAPE to fall below 0.20. For the 28-day environmental exposures, at least 15 days are required for the cumulative route buffer and convex hull measures, while the requisite number of valid GPS days ranges from 4 to 19 (with 8 of 12 exposure measures requiring 14 days or less) for the mean daily route buffer and convex hull measures. These patterns of results generally hold for the explained variance (adjusted R2) results. One noteworthy difference is that the explained variance results often suggest even fewer valid days of GPS monitoring are required for the mean daily activity space measures to achieve an adjusted R2>0.80.
Table 4.
Number of days necessary to reach adjusted explained variance (R2) >0.80 and mean adjusted percentage error (MAPE) <0.20 for activity space measures
| Cumulative Measures | Mean Daily Measures | |||
|---|---|---|---|---|
|
|
||||
| Activity space measure | Days for Adjusted R2 >0.80 | Days for MAPE <0.20 | Days for Adjusted R2 >0.80 | Days for MAPE <0.20 |
| Area/size | ||||
| Route buffer, 500m | 16 | 18 | 7 | 10 |
| Convex hull | 16 | 20 | 9 | 19 |
| Supermarkets | ||||
| Route buffer, 500m count | 17 | 17 | 9 | 10 |
| Route buffer, 500m density | 15 | 15 | 9 | 6 |
| Convex hull count | 16 | 19 | 6 | 18 |
| Convex hull density | 16 | 15 | 16 | 15 |
| Kernel density | 1 | 15 | 1 | 15 |
| Fast food restaurants | ||||
| Route buffer, 500m count | 17 | 18 | 4 | 12 |
| Route buffer, 500m density | 16 | 15 | 4 | 4 |
| Convex hull count | 16 | 20 | 6 | 18 |
| Convex hull density | 15 | 15 | 9 | 9 |
| Kernel density | 5 | 7 | 4 | 7 |
| Parks | ||||
| Route buffer, 500m count | 16 | 18 | 9 | 18 |
| Route buffer, 500m land proportion | 17 | 15 | 2 | 13 |
| Convex hull count | 16 | 20 | 9 | 10 |
| Convex hull land proportion | 23 | 15 | 13 | 6 |
| Kernel density | 1 | 10 | 1 | 10 |
m = meters
Table 5 shows the proportion of the 28-day cumulative activity space surface covered after 7, 14, and 21 days. For the convex hull, on average across participants, 43% of the 28-day cumulative activity space is covered by day 7 (IQR 42), 65% by day 14 (IQR 48), and 84% by day 21 (IQR 16). For the 500 m route buffer, on average, 50% is covered by day 7 (interquartile range or IQR 51), 70% by day 14 (IQR 33), and 87% by day 21 (IQR 13).
Table 5.
Proportion of 28-day cumulative activity space surface covered after 7, 14, and 21 days
| Time period | Convex Hull | 500m Route Buffer | ||||||||||||
|---|---|---|---|---|---|---|---|---|---|---|---|---|---|---|
|
| ||||||||||||||
| M | SD | Min | Q1 | Med | Q3 | Max | M | SD | Min | Q1 | Med | Q3 | Max | |
| Days 1-7 | 0.43 | 0.25 | 0.02 | 0.23 | 0.44 | 0.65 | 0.81 | 0.50 | 0.19 | 0.10 | 0.38 | 0.52 | 0.89 | 0.89 |
| Days 1-14 | 0.65 | 0.31 | 0.02 | 0.43 | 0.72 | 0.91 | 1.00 | 0.70 | 0.21 | 0.17 | 0.61 | 0.77 | 0.94 | 0.94 |
| Days 1-21 | 0.84 | 0.25 | 0.18 | 0.84 | 0.95 | 1.00 | 1.00 | 0.87 | 0.14 | 0.42 | 0.87 | 0.90 | 1.00 | 1.00 |
M = mean SD = standard deviation Min = minimum Q = quartile Med = median Max = maximum m = meters
Discussion
While activity space research is growing in popularity to understand environmental influences on health behaviors and outcomes, major gaps exist in activity space measurement. Fundamental for research using GPS monitoring as the basis for activity space measurement is the number of days of GPS monitoring required for reliable and valid measurement of routine environmental attributes. To our knowledge this is the first study to address how many days of GPS monitoring are needed to measure these environmental attributes. In a racially/ethnically diverse urban sample with low rates of employment and auto ownership, our results suggest wide variability (between 1 and 20 days) in the number of valid days of GPS data needed to accurately estimate activity space size and environmental exposures over one month. The requisite number of days depends on the activity space measure (e.g., kernel density, route buffer), attribute (e.g., size, supermarket, park), and representation (cumulative or mean daily). But in contrast to the current norm of up to 7 days, our results suggest that at least 14 valid days of GPS monitoring may be needed to accurately reflect a range of attributes for different activity space measures and based on different representations of an individual’s one-month activity space. This result is similar to a related study by Schlich and Axhausen who recommend a minimum of two weeks of daily data collection to understand habitual travel behavior (Schlich, Axhausen 2003).
Validity
Based on the MAPE and explained variance statistics, fewer valid days of GPS monitoring were generally needed to accurately estimate participants’ one-month activity space environmental attributes for kernel density surfaces than for route buffers and convex hull measures. Based on the MAPE results, we were able to achieve valid estimates of participants’ cumulative and average daily 28-day activity space environmental exposures with as few as 7 valid GPS days for kernel density measures of fast food restaurants. Kernel density measures of supermarkets, on the other hand, required 15 days of valid GPS data. Unlike route buffers and convex hulls, kernel density measures of environmental exposures are weighted according to where the individual spends time. These results might suggest that even if people move around in different ways on different days over a month, they may not be visiting diverse sets of places with respect to supermarket, fast food restaurant, or park access. Another potential explanation is that because kernel density measures can heavily reflect people’s residential neighborhoods, due to the disproportionate amount of time many people spend there, these activity space measures more quickly approximate the monthly values.
In general, fewer valid GPS days were needed to accurately estimate supermarket, fast food restaurant, and park densities in the one-month activity space than to estimate the raw counts of these environmental exposures. In other words, once activity space size is taken into account, fewer days are needed to accurately reflect these exposures over one month. This likely reflects the fact that resource densities can fluctuate up or down, while counts of resources can only go up as the size of the activity space expands. Based on the MAPE results, researchers only interested in density measures may need 2-9 fewer days of valid GPS data to accurately reflect environmental attributes over one-month, depending on the environmental exposure.
Finally, accurately estimating mean daily environmental attributes over one-month required fewer valid days of GPS monitoring than accurately estimating cumulative one-month activity space environmental attributes. While the latter is more commonly used, the selection of an approach should not only be guided by measure validity, but even more importantly by the researcher’s underlying conceptualization of how activity space environments affect health behaviors and outcomes.
Reliability and Within- and Between-Person Variability
Our ICC results suggest that we were only able to reliably distinguish between individuals on any environmental exposures using kernel density surface measures, not route buffer or convex hull measures. Based on kernel density surfaces that weight attributes based on where people spend time, we were able to reliably estimate park and supermarket exposures (which are less common than fast food restaurants) after just a few days of GPS tracking. Our results do not reveal a clear measurement period that yields adequate reliability for route buffers or convex hull measures, or for kernel density fast food restaurant measures. While not focused on activity space environments, a prior study found that 12 days of GPS monitoring were needed to reliably estimate physical activity time in many locations, although they were not able to reliably estimate physical activity time in commercial and residential (outside the home) locations based on even 21 days of monitoring (Holliday, Howard et al. 2017).
As shown in Table 3, our results indicate that most of the variation in time-weighted activity space environmental attributes is between people (60-90%). On the other hand, the vast majority of the variation in activity space area/size and environmental exposures for the route buffer and convex hull measures, which are not weighted by time, is generally within person (46-94%). In other words, there is more within-person day-to-day variation in activity-space size and environmental exposures than between-person variation. This suggests that non-time weighted activity spaces may be helpful to understand the role of the environment in within-person day-to-day variability in health behaviors and other health-related outcomes (e.g., mood, stress, blood pressure) (Dunton, Atienza 2009, Dunton 2017, Zenk, Horoi et al. 2014, Zenk, Horoi et al. 2017, Maltz, Gordon et al. 1991).
Strengths and Limitations
This study provides one of the first examinations of the number of days of GPS monitoring needed to obtain reliable and valid estimates of routine activity spaces. It has important strengths including the collection of one-month of GPS data, use of multiple activity space representations (cumulative, mean daily), measures (convex hull, route buffer, kernel density surface), and attributes (size, supermarket, fast food restaurant, park).
Nonetheless, the study also has important limitations to keep in mind. First, this is a small sample and the generalizability of the results is unclear. Thus, more research with different samples is needed. It is possible that fewer days of monitoring are required for samples with characteristics associated with more regular activities (e.g., those who are employed full-time) (Susilo, Axhausen 2007). Second, while our goal was to estimate the number of GPS monitoring required to obtain reliable, valid estimates of activity space attributes, our analyses actually estimate the number of valid days of GPS data required. More days of GPS monitoring may be needed to obtain the indicated number of valid GPS days. However, this is likely to vary depending on the sample, the utilized GPS technology (with monitors with fewer malfunctions and lower participant burden possibly minimizing invalid GPS days), and length of the field period (e.g., our lengthy 30-day field period may have contributed to more invalid GPS days). Based on the 86 participants in our study with 14 days of valid GPS data, our study suggested that the median number of days of GPS monitoring required to obtain those 14 valid GPS days was 16 (IQR 4). Third, while we examined activity space size/area and three environmental exposures that differed in spatial distribution, it is possible results may differ for other attributes. Fourth, we operationalized the routine activity space as the space individuals traveled and conducted activities over one-month. Inevitably this one-month measure has measurement error as it likely includes non-routine or atypical activity locations and travel routes. Thus, our validity analyses likely overestimate the requisite number of valid GPS days. Fifth, while all participants in the analytic sample had at least 28 days of GPS data, there are some missing days, including the removal of midpoint date when they visited the university. It is unclear what effect, if any, this had on results. Sixth, by virtue of their construction, kernel density surface measures are heavily weighted by the participants’ homes and residential neighborhoods. Trimming the home and/or residential neighborhood and estimating the kernel density surface for only the nonresidential locations could provide additional insights.
Conclusions
While health researchers often turn to activity spaces to better capture the environment of places to which people are exposed (Boruff, Nathan et al. 2012, Gustafson, Christian et al. 2013), incorporating activity spaces into neighborhood and health research also allows us to better incorporate time into our studies (Perchoux, Chaix et al. 2013, Matthews, Yang 2013, Rainham, McDowell et al. 2010, Saarloos, Kim et al. 2009, Widener, Minaker et al. 2017). Use of kernel density methods in particular for activity space measurement permits more accurate estimates of environmental exposures based on both space and time. Our study suggests that activity space research may be suitable for capturing not only chronic environmental exposures through routine activity spaces measurement but also acute environmental exposures through daily activity space measurement. Thus, while underexplored to date, activity space research also allows us to examine within-person variability in environmental exposures and how this variability contributes to daily fluctuations in health behaviors and psychosocial factors (e.g., stress, emotions, cognitions). Our research provides important new information on how many valid days of GPS monitoring we need for this activity space research. But this is only the tip of the iceberg in terms of what needs to be learned methodologically to realize the potential of activity space approaches in health research; we look forward to many more methodological studies addressing questions about the requisite duration of GPS monitoring for activity space measurement and other topics.
Supplementary Material
Highlights.
In contrast to current norm of 7 days, at least 14 days of valid GPS monitoring are needed.
Days for valid estimates varied by activity space representation, measure, and environmental attribute.
Kernel density measures achieved reliable estimates after a few days.
Reliable estimates were not found for convex hull and route buffer measures.
Activity space attributes, when not weighted by time, vary considerably day-to-day.
Acknowledgments
We thank Anna Wyrwa, Jessica Nunez, Kirby McKinnon, Aster Xiang, and Haytham Abu Zayd for research assistance. We also thank Dr. Chang Park for statistical consultation and Dr. Kelly Evenson for comments on an early draft of the manuscript. This research was supported by the National Cancer Institute (R21CA195543). Environmental data were provided through other National Cancer Institute support (R01CA172726). The analysis in this paper was also supported in part through a collaboration with the PALMS Project (UCSD-Palms-Project.wikispaces.com) at the University of California, San Diego (U01CA130771).
Footnotes
Publisher's Disclaimer: This is a PDF file of an unedited manuscript that has been accepted for publication. As a service to our customers we are providing this early version of the manuscript. The manuscript will undergo copyediting, typesetting, and review of the resulting proof before it is published in its final citable form. Please note that during the production process errors may be discovered which could affect the content, and all legal disclaimers that apply to the journal pertain.
References
- Boruff BJ, Nathan A, Nijënstein S. Using GPS technology to (re)-examine operational definitions of ‘neighbourhood’ in place-based health research. International Journal of Health Geographics. 2012;11(1):22–22. doi: 10.1186/1476-072X-11-22. [DOI] [PMC free article] [PubMed] [Google Scholar]
- Browning CR, Soller B. Moving beyond neighborhood: activity spaces and ecological networks as contexts for youth development. A Journal of Policy Development and Research. 2014;16(1):165. [PMC free article] [PubMed] [Google Scholar]
- Burgoine T, Jones A, Brouwer R, Neelon S. Associations between BMI and home, school and route environmental exposures estimated using GPS and GIS: do we see evidence of selective daily mobility bias in children? International Journal Of Health Geographics. 2015;14(1):8–8. doi: 10.1186/1476-072X-14-8. [DOI] [PMC free article] [PubMed] [Google Scholar]
- Byrnes HF, Miller BA, Wiebe DJ, Morrison CN, Remer LG, Wiehe SE. Tracking adolescents with global positioning system-enabled cell phones to study contextual exposures and alcohol and marijuana use: a pilot study. Journal of Adolescent Health. 2015;57(2):245–247. doi: 10.1016/j.jadohealth.2015.04.013. [DOI] [PMC free article] [PubMed] [Google Scholar]
- Center For Wireless And Population Health Systems. Personal Activity Location Measurement System User Guide. University of California; San Diego: 2011. [Google Scholar]
- Chaix B, Kestens Y, Perchoux C, Karusisi N, Merlo J, Labadi K. An interactive mapping tool to assess individual mobility patterns in neighborhood studies. American Journal of Preventive Medicine. 2012;43(4):440–450. doi: 10.1016/j.amepre.2012.06.026. [DOI] [PubMed] [Google Scholar]
- Chaix B, Meline J, Duncan S, Merrien C, Karusisi N, Perchoux C, Lewin A, Labadi K, Kestens Y. GPS tracking in neighborhood and health studies: A step forward for environmental exposure assessment, a step backward for causal inference? Health & Place. 2013;21:46–51. doi: 10.1016/j.healthplace.2013.01.003. [DOI] [PubMed] [Google Scholar]
- Chaix B, Merlo J, Evans D, Leal C, Havard S. Neighbourhoods in eco-epidemiologic research: delimiting personal exposure areas. A response to Riva, Gauvin, Apparicio and Brodeur. Social Science & Medicine. 2009;69(9):1306–1310. doi: 10.1016/j.socscimed.2009.07.018. [DOI] [PubMed] [Google Scholar]
- Chambers T, Pearson A, Kawachi I, Rzotkiewicz Z, Stanley J, Smith M, Mhurchu CN, Signal L. Kids in space: Measuring children’s residential neighborhoods and other destinations using activity space GPS and wearable camera data. Social Science & Medicine. 2017;193:41–50. doi: 10.1016/j.socscimed.2017.09.046. [DOI] [PubMed] [Google Scholar]
- Cummins S. Commentary: investigating neighbourhood effects on health—avoiding the ‘local trap’. International Journal of Epidemiology. 2007;36(2):355–357. doi: 10.1093/ije/dym033. [DOI] [PubMed] [Google Scholar]
- Duncan D, Regan S, Shelley D, Day K, Ruff R, Al-Bayan M, Elbel B. Application of global positioning system methods for the study of obesity and hypertension risk among low-income housing residents in New York City: a spatial feasibility study. Geospatial Health. 2014;9(1):57–70. doi: 10.4081/gh.2014.6. [DOI] [PMC free article] [PubMed] [Google Scholar]
- Dunton GF, Atienza AA. The need for time-intensive information in healthful eating and physical activity research: a timely topic. Journal of the American Dietetic Association. 2009;109(1):30–35. doi: 10.1016/j.jada.2008.10.019. [DOI] [PubMed] [Google Scholar]
- Dunton G. Ecological momentary assessment in physical activity research. Exercise and Sport Sciences Reviews. 2017;45(1):48–54. doi: 10.1249/JES.0000000000000092. [DOI] [PMC free article] [PubMed] [Google Scholar]
- Freisthler B, Lipperman-Kreda S, Bersamin M, Gruenewald P. Tracking the when, where, and with whom of alcohol use integrating ecological momentary assessment and geospatial data to examine risk for alcohol-related problems. Alcohol Research-Current Reviews. 2014;36(1):29–38. [PMC free article] [PubMed] [Google Scholar]
- Gesler WM, Albert DP. How spatial analysis can be used in medical geography. In: Albert DP, Gesler WM, Levergood B, editors. Spatial Analysis, GIS and Remote Sensing Applications in the Health Sciences. Chelsea, Mich: Ann Arbor Press; 2000. pp. 11–38. [Google Scholar]
- Golledge RG, Stimson RJ. Spatial Behavior: A Geographic Perspective. New York: Guilford Press; 1997. [Google Scholar]
- Goodchild MF, Janelle DG. The city around the clock: space—time patterns of urban ecological structure. Environment and Planning A. 1984;16(6):807–820. [Google Scholar]
- Gustafson A, Christian JW, Lewis S, Moore K, Jilcott S. Food venue choice, consumer food environment, but not food venue availability within daily travel patterns are associated with dietary intake among adults, Lexington Kentucky 2011. Nutrition Journal. 2013;12:17–2891. 12–17. doi: 10.1186/1475-2891-12-17. [DOI] [PMC free article] [PubMed] [Google Scholar]
- Hägerstraand T. What about people in regional science? Papers in Regional Science. 1970;24(1):7–24. [Google Scholar]
- Holliday KM, Howard AG, Emch M, Rodríguez DA, Rosamond WD, Evenson KR. Deriving a GPS monitoring time recommendation for physical activity studies of adults. Medicine & Science in Sports & Exercise. 2017;49(5):939–947. doi: 10.1249/MSS.0000000000001190. [DOI] [PMC free article] [PubMed] [Google Scholar]
- Hurvitz PM, Moudon AV, Kang B, Saelens BE, Duncan GE. Emerging technologies for assessing physical activity behaviors in space and time. Frontiers in Public Health. 2014;2:2. doi: 10.3389/fpubh.2014.00002. [DOI] [PMC free article] [PubMed] [Google Scholar]
- Inagami S, Cohen DA, Finch BK. Non-residential neighborhood exposures suppress neighborhood effects on self-rated health. Social Science & Medicine. 2007;65(8):1779–1791. doi: 10.1016/j.socscimed.2007.05.051. [DOI] [PubMed] [Google Scholar]
- Kang M, Bassett DR, Barreira TV, Tudor-Locke C, Ainsworth B, Reis JP, Strath S, Swartz A. How many days are enough? A study of 365 days of pedometer monitoring. Research Quarterly for Exercise and Sport. 2009;80(3):445–453. doi: 10.1080/02701367.2009.10599582. [DOI] [PubMed] [Google Scholar]
- Kestens Y, Lebel A, Chaix B, Clary C, Daniel M, Pampalon R, Theriault MP, Subramanian S. Association between activity space exposure to food establishments and individual risk of overweight. PLOS ONE. 2012;7(8):E41418. doi: 10.1371/journal.pone.0041418. [DOI] [PMC free article] [PubMed] [Google Scholar]
- Kestens Y, Thierry B, Chaix B. Re-creating daily mobility histories for health research from raw GPS tracks: Validation of a kernel-based algorithm using real-life data. Health & Place. 2016;40:29–33. doi: 10.1016/j.healthplace.2016.04.004. [DOI] [PubMed] [Google Scholar]
- Kirchner TR, Cantrell J, Anesetti-Rothermel A, Ganz O, Vallone DM, Abrams DB. Geospatial exposure to point-of-sale tobacco: Real-time craving and smoking-cessation outcomes. American Journal of Preventive Medicine. 2013;45(4):379–385. doi: 10.1016/j.amepre.2013.05.016. [DOI] [PMC free article] [PubMed] [Google Scholar]
- Klepeis NE, Nelson WC, Ott WR, Robinson JP, Tsang AM, Switzer P, Behar JV, Hern SC, Engelmann WH. The National Human Activity Pattern Survey (NHAPS): a resource for assessing exposure to environmental pollutants. Journal of Exposure Analysis and Environmental Epidemiology. 2001;11(3):231–252. doi: 10.1038/sj.jea.7500165. [DOI] [PubMed] [Google Scholar]
- Krenn PJ, Titze S, Oja P, Jones A, Ogilvie D. Use of global positioning systems to study physical activity and the environment: A systematic review. American Journal of Preventive Medicine. 2011;41(5):508–515. doi: 10.1016/j.amepre.2011.06.046. [DOI] [PMC free article] [PubMed] [Google Scholar]
- Kwan MP. Gender and individual access to urban opportunities: A study using space-time measures. The Professional Geographer. 1999;51(2):211–227. [Google Scholar]
- Leal C, Chaix B. The influence of geographic life environments on cardiometabolic risk factors: a systematic review, a methodological assessment and a research agenda. Obesity Reviews. 2011;12(3):217–230. doi: 10.1111/j.1467-789X.2010.00726.x. [DOI] [PubMed] [Google Scholar]
- Lebel A, Kestens Y, Pampalon R, Thériault M, Daniel M, Subramanian SV. Local context influence, activity space, and foodscape exposure in two Canadian metropolitan settings: Is daily mobility exposure associated with overweight? Journal of Obesity. 2012;2012:1–9. doi: 10.1155/2012/912645. [DOI] [PMC free article] [PubMed] [Google Scholar]
- Lee JH, Davis A, Yoon SY, Goulias KG. Activity space estimation with longitudinal observations of social media data. Transportation. 2016:1–23. [Google Scholar]
- Lipperman-Kreda S, Morrison C, Grube J, Gaidus A. Youth activity spaces and daily exposure to tobacco outlets. Health & Place. 2015;34:30–33. doi: 10.1016/j.healthplace.2015.03.013. [DOI] [PubMed] [Google Scholar]
- Malpede CZ, Greene LF, Fitzpatrick SL, Jefferson WK, Shewchuk RM, Baskin ML, Ard JD. Racial influences associated with weight-related beliefs in African American and Caucasian women. Ethnicity & Disease. 2007;17(1):1–5. [PubMed] [Google Scholar]
- Maltz M, Gordon A, Friedman W. Mapping Crime in Its Community Setting. New York: Springer-Verlag; 1991. [Google Scholar]
- Mason M, Mennis J, Way T, Light J, Rusby J, Westling E, Crewe S, Flay B, Campbell L, Zaharakis N, Mchenry C. Young adolescents’ perceived activity space risk, peer networks, and substance use. Health & Place. 2015;34:143–149. doi: 10.1016/j.healthplace.2015.04.005. [DOI] [PMC free article] [PubMed] [Google Scholar]
- Matthews CE, Ainsworth BE, Thompson RW, Bassett DR., Jr Sources of variance in daily physical activity levels as measured by an accelerometer. Medicine & Science in Sports & Exercise. 2002;34(8):1376–1381. doi: 10.1097/00005768-200208000-00021. [DOI] [PubMed] [Google Scholar]
- Matthews SA, Yang T. Spatial polygamy and contextual exposures (spaces) promoting activity space approaches in research on place and health. American Behavioral Scientist. 2013;57(8):1057–1081. doi: 10.1177/0002764213487345. [DOI] [PMC free article] [PubMed] [Google Scholar]
- Patrick K. A tool for geospatial analysis of physical activity: Physical Activity Location Measurement System (PALMS) Medicine & Science in Sports & Exercise. 2009;41:10. [Google Scholar]
- Perchoux C, Kestens Y, Brondeel R, Chaix B. Accounting for the daily locations visited in the study of the built environment correlates of recreational walking (the RECORD Cohort Study) Preventive Medicine. 2015;81:142–149. doi: 10.1016/j.ypmed.2015.08.010. [DOI] [PubMed] [Google Scholar]
- Perchoux C, Chaix B, Cummins S, Kestens Y. Conceptualization and measurement of environmental exposure in epidemiology: Accounting for activity space related to daily mobility. Health & Place. 2013;21:86–93. doi: 10.1016/j.healthplace.2013.01.005. [DOI] [PubMed] [Google Scholar]
- Rainham DG, Bates CJ, Blanchard CM, Dummer TJ, Kirk SF, Shearer CL. Spatial classification of youth physical activity patterns. American Journal of Preventive Medicine. 2012;42(5):E87–e96. doi: 10.1016/j.amepre.2012.02.011. [DOI] [PubMed] [Google Scholar]
- Rainham D, Mcdowell I, Krewski D, Sawada M. Conceptualizing the healthscape: Contributions of time geography, location technologies and spatial ecology to place and health research. Social Science & Medicine. 2010;70(5):668–676. doi: 10.1016/j.socscimed.2009.10.035. [DOI] [PubMed] [Google Scholar]
- Saarloos D, Kim JE, Timmermans H. The built environment and health: Introducing individual space-time behavior. International Journal of Environmental Research and Public Health. 2009;6(6):1724–1743. doi: 10.3390/ijerph6061724. [DOI] [PMC free article] [PubMed] [Google Scholar]
- Sadler RC, Gilliland JA. Comparing children’s GPS tracks with geospatial proxies for exposure to junk food. Spatial and Spatio-temporal Epidemiology. 2015;14:55–61. doi: 10.1016/j.sste.2015.09.001. [DOI] [PubMed] [Google Scholar]
- Schlich R, Axhausen KW. Habitual travel behaviour: evidence from a six-week travel diary. Transportation. 2003;30(1):13–36. [Google Scholar]
- Schönfelder S, Axhausen K. Structure and innovation of human activity spaces. Arbeitsberichte Verkehrs-und Raumplanung. 2004;258:1–40. [Google Scholar]
- Shareck M, Kestens Y, Vallee J, Datta G, Frohlich K. The added value of accounting for activity space when examining the association between tobacco retailer availability and smoking among young adults. Tobacco Control. 2016;25(4):406–412. doi: 10.1136/tobaccocontrol-2014-052194. [DOI] [PubMed] [Google Scholar]
- Shareck M, Kestens Y, Frohlich KL. Moving beyond the residential neighborhood to explore social inequalities in exposure to area-level disadvantage: Results from the Interdisciplinary Study on Inequalities in Smoking. Social Science & Medicine. 2014;108:106–114. doi: 10.1016/j.socscimed.2014.02.044. [DOI] [PubMed] [Google Scholar]
- Shareck M, Kestens Y, Gauvin L. Examining the spatial congruence between data obtained with a novel activity location questionnaire, continuous GPS tracking, and prompted recall surveys. International Journal of Health Geographics. 2013;12(1):40–40. doi: 10.1186/1476-072X-12-40. [DOI] [PMC free article] [PubMed] [Google Scholar]
- Sherman JE, Spencer J, Preisser JS, Gesler WM, Arcury TA. A suite of methods for representing activity space in a healthcare accessibility study. International Journal of Health Geographics. 2005;4(1):24–24. doi: 10.1186/1476-072X-4-24. [DOI] [PMC free article] [PubMed] [Google Scholar]
- Susilo YO, Axhausen KW. Stability in individual daily activity-travel-location patterns. Transportation. 2007;41:995–1011. [Google Scholar]
- Tamura K, Elbel B, Chaix B, Regan SD, Al-Ajlouni YA, Athens JK, Meline J, Duncan DT. Residential and GPS-defined activity space neighborhood noise complaints, body mass index and blood pressure among low-income housing residents in New York City. Journal of Community Health. 2017:1–9. doi: 10.1007/s10900-017-0344-5. [DOI] [PMC free article] [PubMed] [Google Scholar]
- Trost SG, Pate RR, Freedson PS, Sallis JF, Taylor WC. Using objective physical activity measures with youth: how many days of monitoring are needed? Medicine and Science in Sports and Exercise. 2000;32(2):426–431. doi: 10.1097/00005768-200002000-00025. [DOI] [PubMed] [Google Scholar]
- Tudor-Locke C, Burkett L, Reis JP, Ainsworth BE, Macera CA, Wilson DK. How many days of pedometer monitoring predict weekly physical activity in adults? Preventive Medicine. 2005;40(3):293–298. doi: 10.1016/j.ypmed.2004.06.003. [DOI] [PubMed] [Google Scholar]
- Van Heeswijck T, Paquet C, Kestens Y, Thierry B, Morency C, Daniel M. Differences in associations between active transportation and built environmental exposures when expressed using different components of individual activity spaces. Health & Place. 2015;33:195–202. doi: 10.1016/j.healthplace.2015.03.003. [DOI] [PubMed] [Google Scholar]
- Widener MJ, Minaker L, Farber S, Allen J, Vitali B, Coleman PC, Cook B. How do changes in the daily food and transportation environments affect grocery store accessibility? Applied Geography. 2017;83:46–62. [Google Scholar]
- Zenk SN, Schulz AJ, Odoms-Young AM, Wilbur J, Matthews S, Gamboa C, Wegrzyn LR, Hobson S, Stokes C. Feasibility of using global positioning systems (GPS) with diverse urban adults: Before and after data on perceived acceptability, barriers, and ease of use. Journal of Physical Activity and Health. 2012;9(7):924–934. doi: 10.1123/jpah.9.7.924. [DOI] [PMC free article] [PubMed] [Google Scholar]
- Zenk SN, Horoi I, Jones KK, Finnegan L, Corte C, Riley B, Wilbur J. Environmental and personal correlates of physical activity and sedentary behavior in African American women: An ecological momentary assessment study. Women & Health. 2017;57(4):446–462. doi: 10.1080/03630242.2016.1170093. [DOI] [PubMed] [Google Scholar]
- Zenk SN, Schulz AJ, Matthews SA, Odoms-Young A, Wilbur J, Wegrzyn L, Gibbs K, Braunschweig C, Stokes C. Activity space environment and dietary and physical activity behaviors: A pilot study. Health & Place. 2011;17(5):1150–1161. doi: 10.1016/j.healthplace.2011.05.001. [DOI] [PMC free article] [PubMed] [Google Scholar]
- Zenk S, Horoi I, McDonald A, Corte C, Riley B, Odoms-Young A. Ecological momentary assessment of environmental and personal factors and snack food intake in African American women. Appetite. 2014;83:333–341. doi: 10.1016/j.appet.2014.09.008. [DOI] [PMC free article] [PubMed] [Google Scholar]
Associated Data
This section collects any data citations, data availability statements, or supplementary materials included in this article.