Abstract
Recent developments in alcohol monitoring devices have made it more feasible to use contingency management (CM) procedures to reduce alcohol use. A growing body of literature is demonstrating the effectiveness of CM to reduce alcohol use among community recruited adults wearing transdermal alcohol concentration (TAC) monitoring devices. This article describes the quality improvement process aimed at adapting TAC-informed CM aimed at minimizing alcohol use and maximizing treatment completion. This extends literature to a high-risk population; adults arrested and awaiting trial (pretrial) for criminal charge of driving while intoxicated (DWI). Participants were enrolled during their orientation to pretrial supervision conditions of DWI bond release. At enrollment, participants completed a screening, brief intervention, and referral to treatment; those with high risk alcohol histories were enrolled in an 8-week CM procedure to avoid TAC readings. Four Plan-Do-Study-Act (PDSA) quality improvement cycles were conducted where the TAC cutoff for determining alcohol use, the quantity of reinforcer, and handling of tampers on the transdermal alcohol monitor were manipulated. Across four PDSA cycles, the retention for the full 8-weeks of treatment was increased. The proportion of weeks with alcohol use was not decreased across cycles, the peak TAC values observed during drinking weeks were significantly lower in Cycles 1 and 4 than 3. CM may be developed as a tool for pretrial supervision to be used to increase bond compliance of those arrested for DWI and for others as a method to identify the need for additional judicial services.
Keywords: alcohol, transdermal alcohol monitor, contingency management, driving while intoxicated, pretrial
1. Introduction
Driving while intoxicated (DWI) offenses are prevalent and associated with severe consequences. DWI is among the most frequently committed offenses in the U.S. (FBI, 2015), yet it's estimated that only 0.1% of alcohol-impaired drivers are arrested (Zaloshnja et al., 2013). Further, nearly 30% of those arrested for DWI will be re-arrested for alcohol impaired driving (NHTSA, 2014b). DWI recidivists are over-represented in fatal crashes by a factor of 1.62, as drinking drivers in fatal crashes by a factor of 2.38, and as a high blood alcohol concentration (BAC) driver in fatal crashes by a factor of 3.81 (Fell, 2014). National rates show 31% of motor vehicle fatalities involve a driver with a BAC ≥ 0.08 (legal intoxication) and cost $49.8 billion annually (NHTSA, 2014a).
The period after DWI arrest is a unique context for targeting reduction in alcohol use. The time between arrest and adjudication (pretrial) is typically lengthy and involves bond stipulation for alcohol abstinence and monitoring (Buner, 2015; Fell, 2006; Widgery, 2015). Despite inherent contingencies (fines, incarceration) within the pretrial supervision period, rates of alcohol use are alarmingly high. One large study (n = 7,743) using ignition interlock data (car-installed breathalyzer) found that alcohol is detected in as many as 70% of cases (Vanlaar et al., 2010). In light of ongoing alcohol use in pretrial, we were interested in adapting a contingency management procedure to ultimately determine if it reduces alcohol use among DWI defendants under pretrial supervision.
Contingency management (CM) may be an effective intervention to reduce alcohol use during the pretrial supervision period. CM is a behavioral intervention involving the delivery of rewards or removal of punishment to achieve a specific behavior, like reductions in alcohol use. CM is effective in reducing the quantity and frequency of using drugs of abuse (Benishek et al., 2014; Lussier et al., 2006) and is well-tolerated by patients (Petry et al., 2016). Until recently, limitations in blood, breath, or urine alcohol use biomarkers (e.g., Javors & Johnson, 2003; Maenhout et al., 2013) hindered progress in applying CM for reducing alcohol use. However, continuous remote detection of alcohol use is now available through transdermal alcohol monitors that passively measure alcohol excreted in sweat (Swift, 2000; 2003; Marques & McKnight, 2009; McKnight et al., 2012). One study has shown that DWI offenders mandated to transdermal alcohol monitoring during pretrial supervision have delayed recidivism to DWI compared to non-monitored offenders (360 days to rearrests versus 271; Tison et al., 2015).
Transdermal alcohol concentration (TAC)-informed CM procedures have been shown to reduce alcohol use among community samples and this article describes the quality improvement process of adapting these procedures for a new population and treatment context: adults recently arrested for a DWI and under bond-stipulation of alcohol abstinence. Previous studies examined manipulations of CM parameters (i.e., size of reinforcers and the TAC cut-offs) in studies of community volunteers (Barnett et al., 2011; 2017; Dougherty et al., 2014; 2015a; 2015b). The issue of limits of detection is important because the forensic criteria for TAC cut-offs to confirm a drinking event is deliberately conservative to avoid false positive readings. In contrast, clinical research has focused on the reliability of detection of lower TAC values (i.e., is higher sensitivity; Roache et al., 2015). Across various adaptations in TAC-informed CM procedures, studies have consistently found reductions in alcohol use among community-recruited heavy drinkers (Barnett et al., 2011; 2017; Dougherty et al., 2014; 2015a; 2015b). Because the DWI population tends to have more complex needs and more limited resources than general community samples (Mullen et al., 2015b), we anticipated that the CM procedure would require adaptation for the high-risk pretrial DWI offender population. This project used quality improvement methodology as a mechanism to adapt TAC-informed CM procedures for this new target population with the goal of minimizing alcohol use and maximizing treatment completion among those recently arrested for DWI offenses.
2. Material and Methods
2.1 Participants
Between May 2015 and June 2017, adults who had been recently arrested for a DWI were offered enrollment into an evaluation and intervention program. Enrollment occurred at pretrial orientation, where offenders are instructed on the conditions of their bond release supervision. In our local jurisdiction, this orientation typically occurs two weeks after arrest. As an adjunct to the typical orientation process, our staff advertised the availability of alcohol evaluation and intervention services. Participants were informed that these services are separate from the pretrial supervision, voluntary, and confidential. They specifically were informed that participation in the program was not intended to impact the outcome of their pending DWI case and that information gathered as part of participation in the intervention would not be shared with the pretrial supervision officers. Those who attended all 8-weekly CM visits received a program completion certificate. Of the 213 potential participants approached during this 2-year project, 86 were enrolled in CM, 88 were excluded for low AUDIT score, and 39 declined participation.
2.1.1 Screening, Brief Intervention, Referral to Treatment (SBIRT)
Interested participants first experienced an approximately 45 min computer-assisted alcohol screening, brief intervention, and referral to treatment (SBIRT) as previously described in Mullen et al., 2015a. During the SBIRT session, data were collected about participant demographic and alcohol use characteristics (including the Alcohol Use Disorders Identification Test (AUDIT; Saunders et al., 1993). Those who score risky, harmful, or in the dependent range (i.e. scores > 4) in the AUDIT were offered participation in the CM intervention. Participants were included if they were: adults (≥ 21 years); arrested for DWI; under pretrial supervision; and willing to undergo voluntary transdermal alcohol monitoring for the purpose of treatment. Participants were excluded if they: were court mandated to transdermal alcohol monitoring; had significant alcohol withdrawal symptoms (Clinical Institute Withdrawal Assessment for Alcohol (CIWA score ≥ 10; Sullivan et al., 1989); or had medical conditions that might contraindicate wearing the ankle monitor (e.g., pregnancy, diabetes). While not an entry criteria, the clinic from which this data was gathered serves a high proportion of low-income, uninsured clients.
2.2 Transdermal Alcohol Monitoring
Participants who qualified and agreed to volunteer were fitted with the Secure Continuous Remote Alcohol Monitors [SCRAM, Alcohol Monitoring Systems (AMS); Highlands Ranch, CO] for detecting transdermal alcohol concentrations (TAC). The monitors were worn on the ankle and detected ethanol emitted through the skin every 30 minutes, 24 hours/day. Attempts to obfuscate alcohol use were measured by infrared reflectivity and body temperature sensors.
SCRAM data was uploaded to the AMS web interface (SCRAMNET; Highlands Ranch, CO) during weekly visits. Then, data was downloaded and run through a program we developed for processing TAC data and producing a CM payment decision. The data processing removes TAC data points that are uninterpretable because they do not conform to characteristics of actual alcohol use events based on known absorption and elimination rates, or producing implausibly high or low, but long, TAC readings. After processing, the application then produces a CM payment decision (yes/no) and provides a summary of TAC, infrared, and temperature data.
2.3 Quality Improvement Cycles
This project describes four QI cycles following the Plan, Do, Study, Act (PDSA) model (described in Moran et al., 2012). Each cycle involved: Planning a CM intervention using a well-defined set of contingency criteria; Doing the intervention in a cohort of participants; Studying the outcomes of that cycle of intervention; and Acting to implement change in the subsequent round of intervention. The goal of the PDSA process was to improve the quality of the CM intervention to minimize alcohol use and maximize treatment completion. Cycles were conducted in approximately 6-month intervals and sample size within each cycle was the outcome of recruitment rate within that interval. Outcomes of the analysis conducted in the Study cycle are presented in the Results, while the Discussion reflects the interpretations made at each Plan cycle.
In each cycle, the CM intervention was divided into 8 consecutive 7-day weeks for each participant. Whether or not participants attended their scheduled weekly appointment or came in on a later date to collect their transdermal and self-report alcohol data, all data were analyzed by their original 7-day weekly blocks and up to 8 monetary reinforcements were paid for these each of these one-week intervals.
Cycle 1
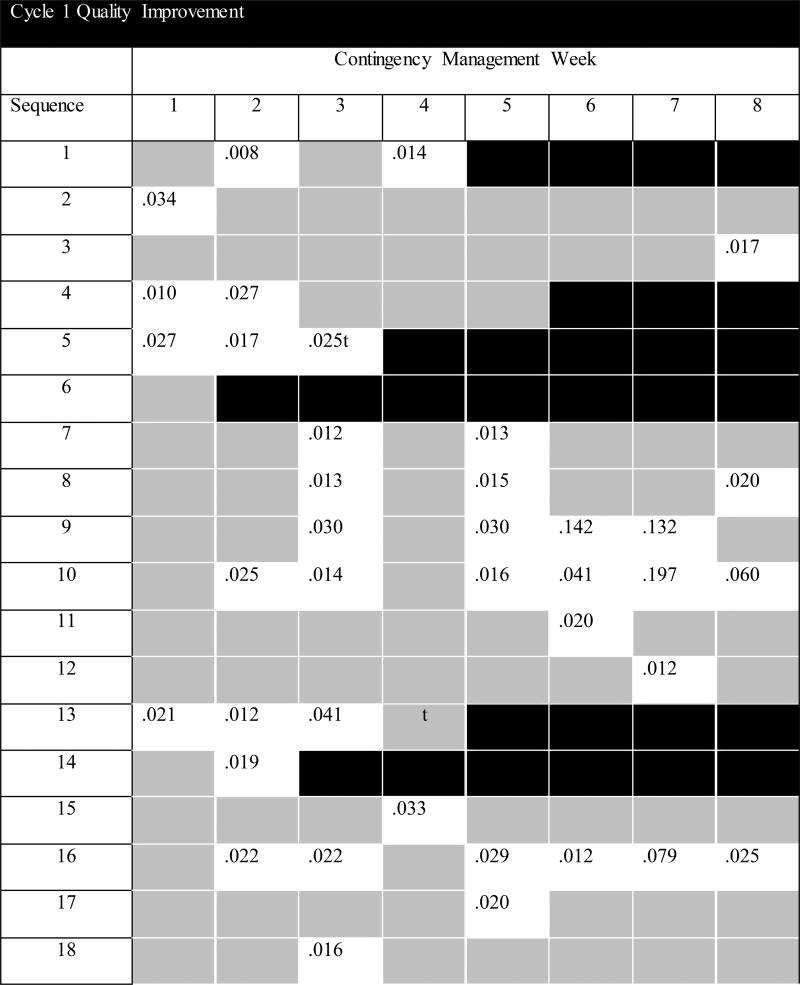
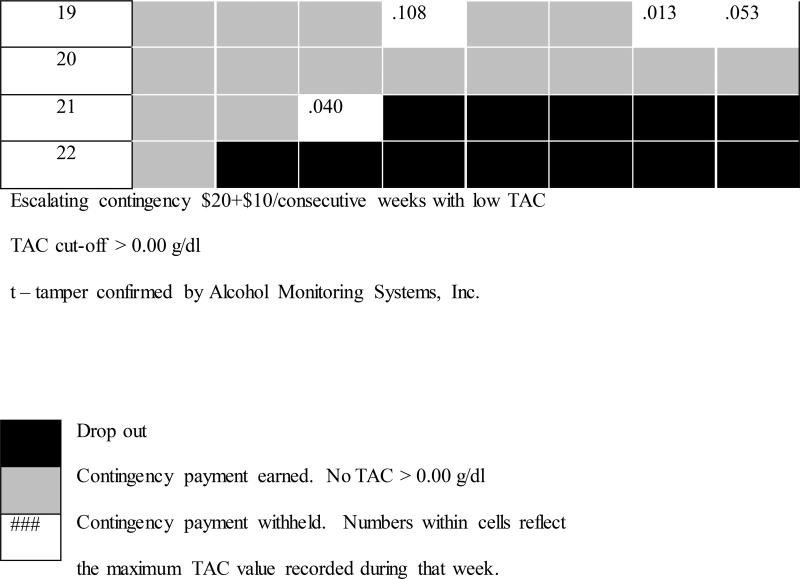
During the first Do cycle, 22 participants were enrolled and treated between May and November 2015. In this cycle participants were instructed that any evidence of alcohol use would result in forfeiture of that week's contingency earning. Monetary reinforcement was delivered at each weekly monitoring showing transdermal alcohol concentration (TAC) = 0.00. The escalating-resetting payment scale started at $20 in week 1 and this increased by $10/week for consecutive weeks of TAC = 0.00. If TAC > 0.00 there was no payment for that week, and the following week's payment was reset to $20, resuming $10/week escalation thereafter. Completing all 8 visits earned a $50 bonus and $50 was paid for returning the SCRAM monitor.
Cycle 2
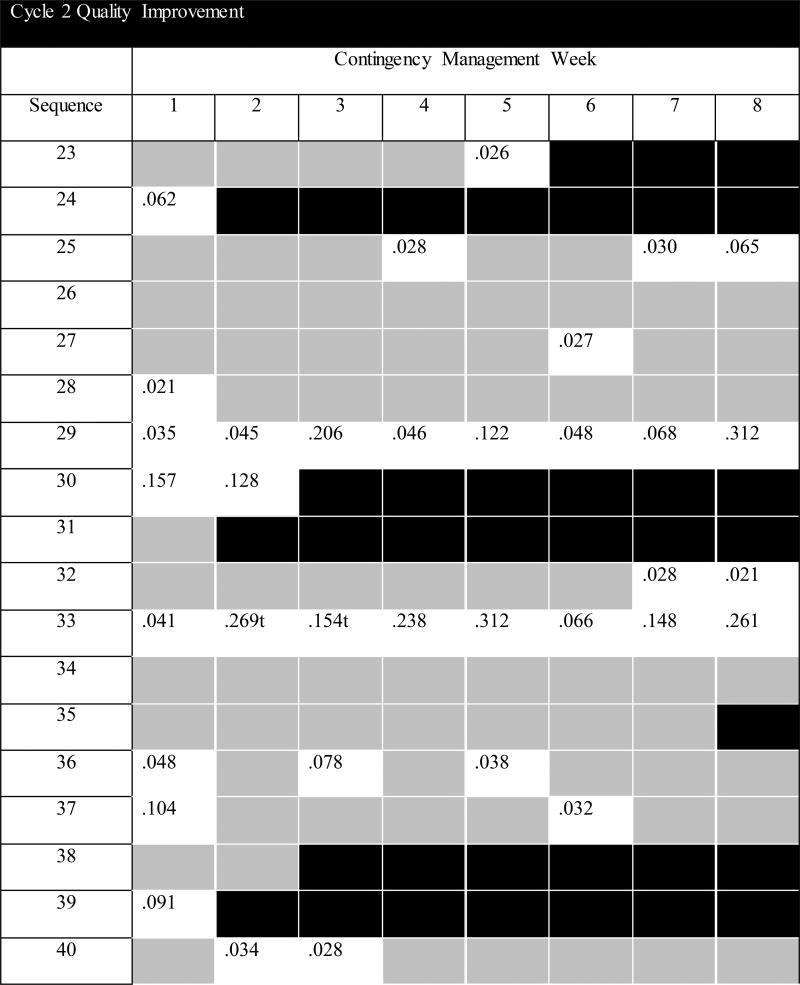
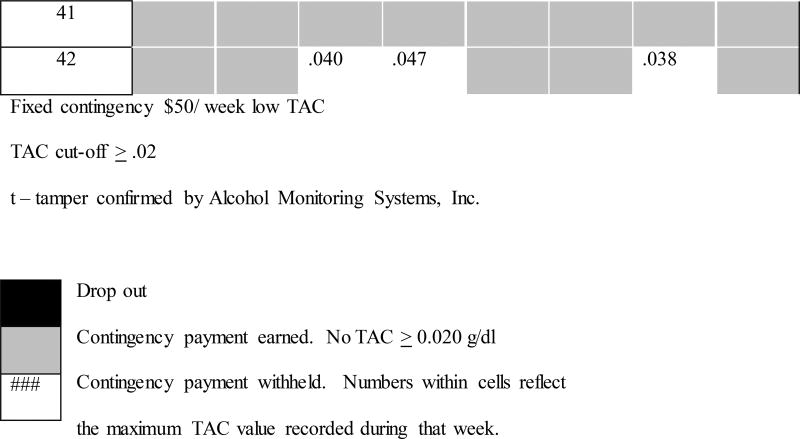
During the second cycle, 20 participants were enrolled and treated between April and October 2016. In this cycle participants were instructed to avoid alcohol use and that evidence of heavy drinking would result in forfeiture of that week's contingency earning. Maintaining TAC below 0.02 (Barnett et al., 2011) for the week resulted in contingency payments of $50/week, along with completion bonus ($50) and monitor return ($50) bonus.
Cycle 3
During the third cycle, 18 participants were enrolled and treated between September 2016 and January 2017. In this cycle, instructions and TAC contingencies were similar to Cycle 2, with the addition of $70/week paid for wearing the SCRAM monitor (consistent with Dougherty et al., 2014; Dougherty et al., 2015a, 2015b).
Cycle 4
During the fourth cycle, 26 participants were enrolled and treated between January and June 2017. Participants were instructed to avoid an "alert" on the monitor to receive their contingency payment. They were instructed that alerts could be caused by drinking alcohol and/or by tampering with the device; either of these would result in forfeiture of the $50/week contingency payment. Potential tampers are identified in the alert log of the AMS Client Report generated at the time of upload of data to SCRAMNET. Authors TEKW and CWM visually inspected the AMS Client report output for large variability in infrared voltage and reductions temperature collected by the transdermal alcohol monitor. The participant was also queried about their experience wearing the device, specifically during the tamper alert period. Based on this review, the contingency payment was withheld in 3 instances on account of tamper as indicated by high infrared voltage variability. Subsequently, AMS reviewed and confirmed all 3 of these as tamper events. AMS tamper criteria include fluctuations in infrared voltage deviation and temperature drop that is visually inspected by AMS technicians trained in interpretation of transdermal alcohol, temperature, and infrared data patterns collected by the SCRAM device. Payments for wearing the monitor, treatment completion, and returning the device remained the same as Cycle 3.
2.4 Timeline Followback Interview (TLFB)
TLFB was used to gather self-reported alcohol use during each 7-day contingency period. The TLFB procedure is a calendar-based interview (Sobell & Sobell, 1992) to document date, time, type, quantity, frequency, and duration of alcohol use.
2.5 Ethics Approval
Data from this project involved analyses of de-identified electronic health record information of patients who consented to receive alcohol assessment and intervention. Analyses were conducted for the purpose of QI, and our local institutional review board determined this publication is not regulated as research as defined by DHHS regulations at 45 CFR 46 and FDA regulations at 21 CFR 56.
2.6 Data Analyses
The primary outcomes of interest are the proportion of weeks with: Non-Drinking, Alcohol Use, Dropout, or Tamper. Because each participant may separately demonstrate each of these outcomes depending on week, outcome comparisons were conducted focusing on the proportion of weeks rather than by individual. The proportion of weeks was calculated as the count of weeks with each type of outcome (i.e., Non-Drinking, Alcohol Use, Dropout, and Tamper) divided by the number of weeks within that cycle (N = 688 observations: Cycle 1 = 176, Cycle 2 = 160, Cycle 3 = 144, and Cycle 4 = 208 weeks).
Univariate analyses of variance (ANOVA) were used to compare outcomes, as well as peak TAC, time in observation (days between arrest and SBIRT, days between SBIRT and start of CM, and days so complete CM), alcohol history, and demographic characteristics that were on an interval scale. Significant outcomes were retested in analyses to explore the effect of covariates, separately including: days between SBIRT and CM, AUDIT score, past alcohol treatment, number of DWI arrests, and heavy drinking days in the month prior to arrest. Chi-square analyses were used for comparison of dichotomous, nominal, and ordinal scale characteristics (e.g., sex, past alcohol treatment). In instances, where there was a significant main effect of Cycle, follow-up comparisons were conducted using the Benjamini and Hochberg (1995) procedure correcting for multiple comparisons. All analyses were conducted using IBM SPSS Statistics version 24 (IBM Corp. Armonk, NY).
3. Results
3.1 Quality Improvement Cycles
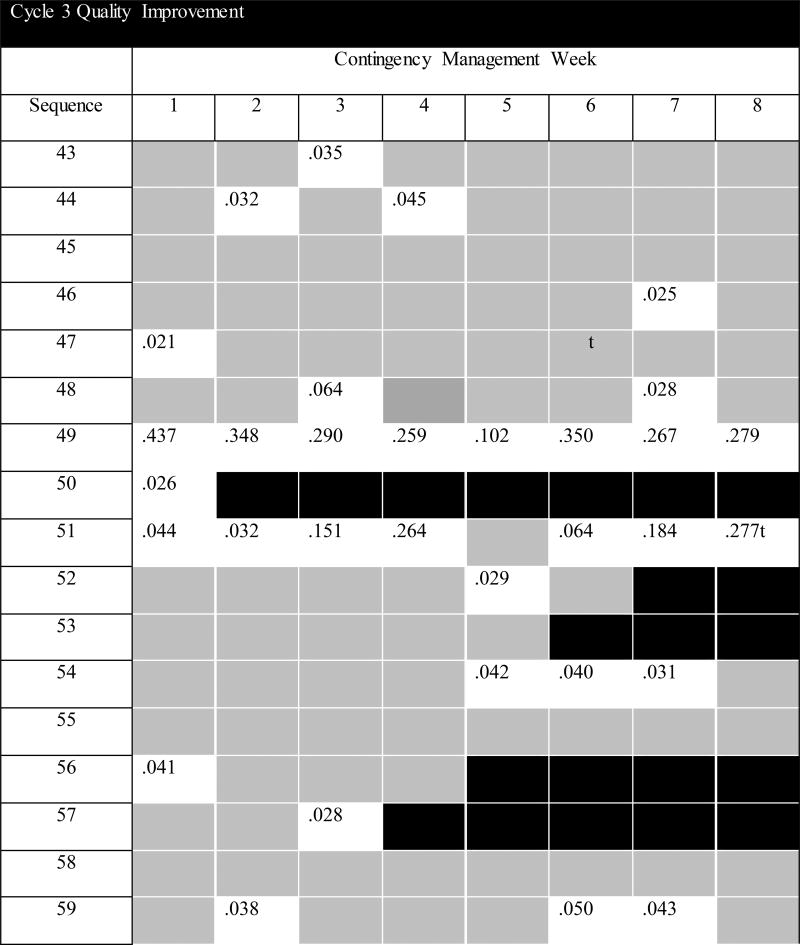
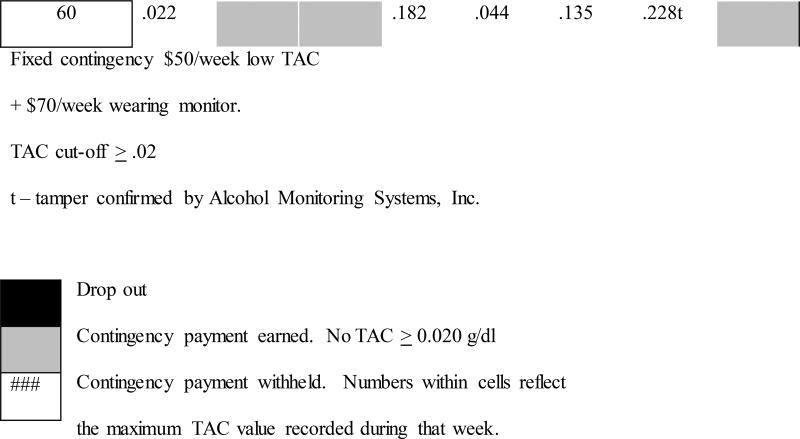
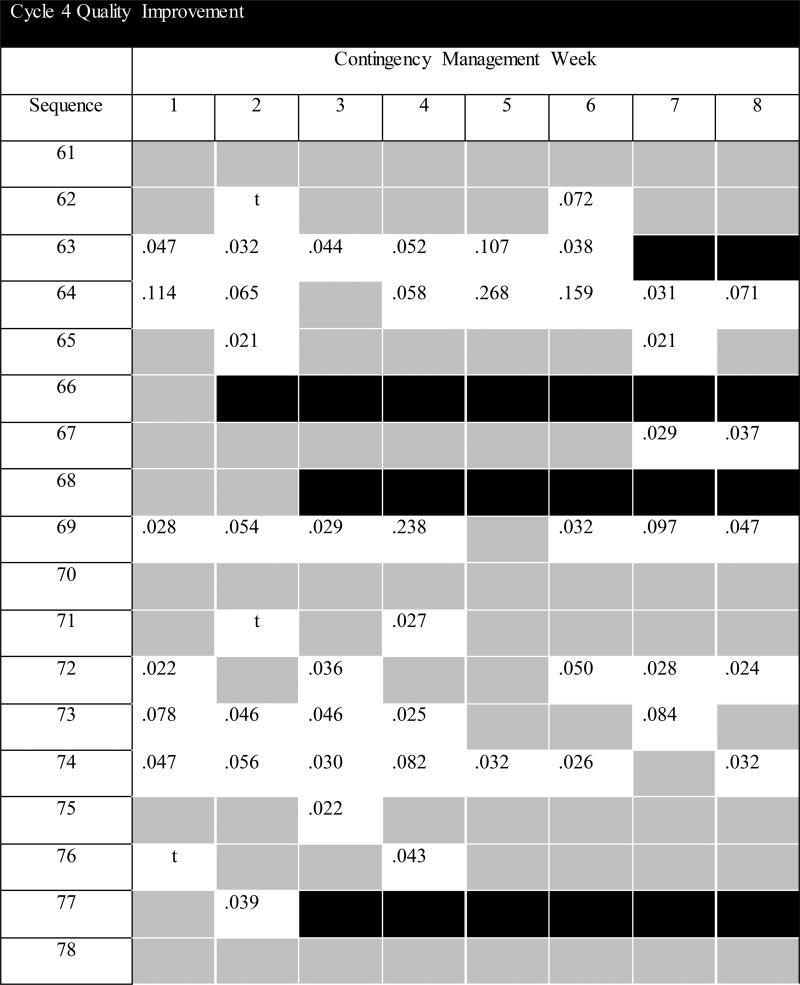
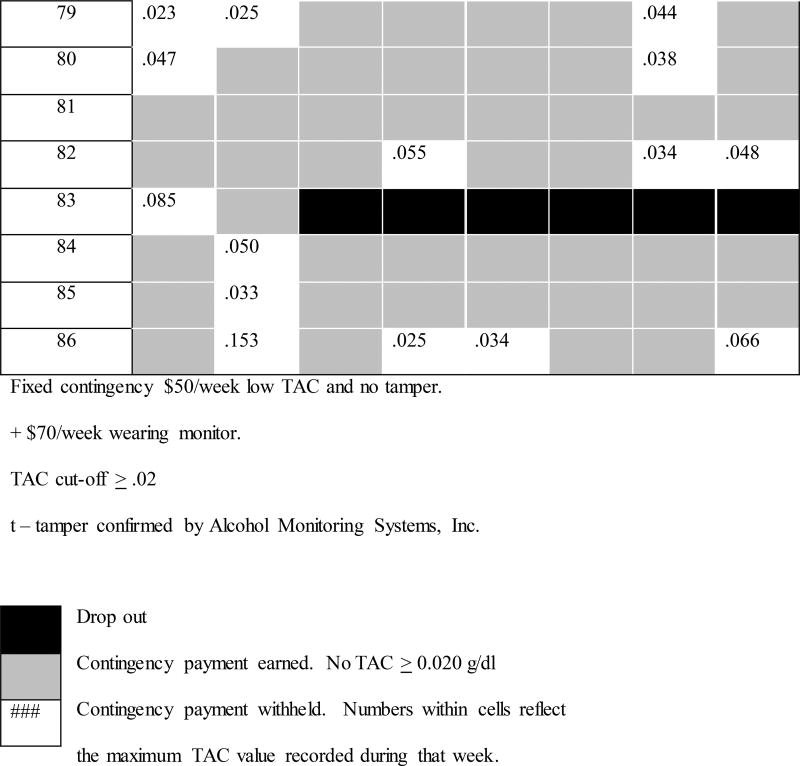
QI dashboards showing the sequence of participant enrollment and outcomes by cycles appear in Figures 1a–1d, which show; earning CM incentive payments did not differ by Cycle (p = .47), dropout typically occurred during the first half of treatment, drinking events were not concentrated within any particular week or week range, and peak TAC was similar across individual weeks when drinking did occur (there were no Week or Week X Cycle effects of peak TAC; p's > .30). Descriptive measures are reported by QI cycle in Table 1, where the proportion of Non-Drinking, Alcohol Use, Dropout, and Tamper are reported and analyzed as the proportion of scheduled weeks (e.g., in Cycle 1, 22 participants were enrolled in the 8-weeks treatment, resulting in 176 observations toward outcome). The rate of treatment completion and level of TAC varied across the four different QI cycle CM conditions. There was a significant QI Cycle difference in proportion of weeks with dropout (F3,683 = 4.19, p = .006; Cohen's d = .27; observed power = .85); compared to Cycles 1 and 2, there was significantly lower dropout under Cycle 3 (p's = .023 and .028) and Cycle 4 (p's = .006 and .008) CM conditions. There were no significant differences in proportion of weeks drinking between the four cycles (p = .833), but the average TAC during weeks with alcohol use did differ by CM conditions (F3,159 = 5.76, p = .001, Cohen's d = .66; observed power = .95). There was significantly higher average TAC for Cycle 3 conditions than both Cycle's 1 and 4 (p's = .0015 and .0015), which were not different from one another. Average TAC in Cycle 2 was not statistically different from any other cycle. Differences in rate of Dropout and average TAC remained significant after accounting for the following covariates: days between SBIRT and CM, AUDIT score, past alcohol treatment, number of DWI arrests, and heavy drinking days in the month prior to arrest.
Figure 1.
a. Quality Improvement Cycle 1 for Developing Transdermal-Informed Contingency Management
b. Quality Improvement Cycle 2 for Developing Transdermal-Informed Contingency Management
c. Quality Improvement Cycle 3 for Developing Transdermal-Informed Contingency Management
d. Quality Improvement Cycle 4 for Developing Transdermal-Informed Contingency Management
Table 1.
Outcomes of Four Quality Improvement Cycles by Week of Treatment.
| Outcome | Cycle 1 | Cycle 2 | Cycle 3 | Cycle 4 | p |
Cycle Comparison |
|---|---|---|---|---|---|---|
|
n = 22 176 weeks |
n = 20 160 weeks |
n = 18 144 weeks |
n = 26 208 weeks |
|||
| Non-Drinking | 52% | 53% | 60% | 56% | .879 | -- |
| Alcohol Use | 25% | 24% | 25% | 29% | .833 | -- |
| Dropout | 23% | 23% | 15% | 13% | .006 | 1,2>3,4 |
| Tamper | -- | -- | -- | 1% | -- | -- |
| M (SD) | M (SD) | M (SD) | M (SD) | |||
|
|
||||||
| Average Max TAC* | .050 (.045) | .093 (086) | .124 (.125) | .063 (.055) | .001 | 3>1,4 |
| Median | Median | Median | Median | |||
|
| ||||||
| Days between arrest and SBIRT | 19 | 14 | 14.5 | 17 | .204 | -- |
| Days between SBIRT and CM | 1 | 7 | 8 | 23 | <.001 | 1,2<4 |
Max TAC scores for Cycle 1 were post-hoc constrained to same cut-off as Cycles 2–4 (include only TAC≥.02) for this analysis.
The primary unit of measure for outcomes was the proportion of weeks for each outcome divided by the number of weeks within that cycle. Alcohol Use – proportion of weeks TAC greater than the cycle cut-off target; CM – contingency management; Dropout – proportion of weeks discontinued participation; Non-Drinking – proportion of weeks TAC zero or less than the cycle cut-off target; SBIRT – alcohol screening, brief intervention, and referral to treatment; Tamper – proportion of weeks AMS confirmed tamper event.
The four QI cycle cohorts were compared for time to treatment completion (see Table 1, bottom panel). The time between SBIRT and the start of CM differed significantly by cohort (F3,82=6.80, p <.001); Cycle 4 was significantly longer than in Cycles 1 and 2 (p's = .001), but not Cycle 3. The longer time for Cycle 4 resulted from delays in starting CM due to end of year holidays. However, 72% completed in exactly 8-weeks and the remaining participants completed within ±1 week of the 56 day of treatment. There were no significant differences between the four cohorts in terms of time between arrest and SBIRT or length of time to complete the CM treatment.
3.2 Demographic and Alcohol Use Characteristics
Demographic characteristics are reported separately by the four QI cycles in Table 2. Across each of the four cohorts, the majority of participants were Hispanic men, with low income and uninsured for healthcare. There were no significant differences between the cohorts in terms of age, sex, ethnicity, education, health insurance coverage, poverty status, or court appointed attorney (all p > 0.05). There were no significant differences between the cohorts in terms of pre-intervention patterns of alcohol consumption (Table 3). The cohorts generally scored in the risky range on the AUDIT, reported driving more than twice after consuming three or more drinks in the month prior to arrest, spending > $2,000/year on alcohol, anticipated the cost of their DWI to be > $7,000, had not previously been treated for alcohol misuse, and had heavy alcohol use in the month prior to DWI arrest. Although not all participants were recidivists, the median number of DWI arrests was 2 in each cohort.
Table 2.
Demographic Characteristics of Participants in Four Quality Improvement Cycles.
| Demographic Characteristics |
Cycle 1 | Cycle 2 | Cycle 3 | Cycle 4 |
|---|---|---|---|---|
|
n = 22 M (SD) |
n = 20 M (SD) |
n = 18 M (SD) |
n = 26 M (SD) |
|
| Age, years | 38.5 (12.0) | 37.3 (12.1) | 39.3 (12.3) | 42.6 (23.7) |
| % (n) | % (n) | % (n) | % (n) | |
|
|
||||
| Male | 91 (20) | 80 (16) | 94 (17) | 88 (20) |
| Race/Ethnicity | ||||
| Hispanic | 86 (19) | 85 (17) | 94 (17) | 76 (20) |
| White | 14 (3) | 5 (1) | 0 (0) | 8 (2) |
| Black | 0 (0) | 0 (0) | 0 (0) | 8 (2) |
| More than 1 race | 0 (0) | 10 (2) | 6 (1) | 8 (2) |
| Education | ||||
| Less than HS | 36 (8) | 10 (2) | 28 (5) | 27 (7) |
| HS diploma/GED | 9 (2) | 40 (8) | 34 (6) | 35 (9) |
| Some College | 46 (10) | 35 (7) | 28 (5) | 35 (9) |
| College degree | 9 (2) | 10 (2) | 5 (1) | 3 (1) |
| >Undergraduate | 0 (0) | 5 (1) | 5 (1) | 0 (0) |
| Uninsured, health | 45 (10) | 60 (12) | 61 (11) | 62 (16) |
| <200% poverty | 86 (19) | 100 (20) | 78 (14) | 81 (21) |
| Court appointed lawyer | 54 (12) | 55 (11) | 67 (12) | 50 (13) |
<200% poverty – earning less than 200% of the Federal Poverty Level, adjusted for number of people in the household; Court appointed lawyer – self-reported representation in pending DWI will be public defender;
HS – high school; Uninsured, health – self-reported absence of health insurance.
Table 3.
Alcohol Characteristics of Participants in Four Quality Improvement Cycles.
| Alcohol Characteristics |
Cycle 1 | Cycle 2 | Cycle 3 | Cycle 4 |
|---|---|---|---|---|
|
n = 22 M (SD) |
n = 20 M (SD) |
n = 18 M (SD) |
n = 26 M (SD) |
|
| AUDIT Score | 12.7 (9.5) | 14.8 (8.8) | 15.2 (9.4) | 13.8 (7.4) |
| Driving after 3+ drinks | 1.5 (1.6) | 2.6 (3.6) | 3.7 (5.2) | 3.2 (3.8) |
| Alcohol spending | $1,423 (950) | $3,120 (2,700) | $2,620 (2,487) | $2,070 (2,348) |
| DWI Cost | $6,322 (5,131) | $6,647 (4,520) | $7,361 (4,422) | $8,677 (5,579) |
| Drinks per montha | 66.7 (100.2) | 56.1 (49.4) | 90.4 (101.1) | 68.0 (73.2) |
| Drinking daysa | 9.3 (9.9) | 8.5 (7.1) | 11.5 (10.9) | 8.0 (8.5) |
| Heavy drinking daysa | 5.6 (9.9) | 5.6 (6.9) | 8.8 (9.3) | 6.3 (9.0) |
| % (n) | % (n) | % (n) | % (n) | |
|
|
||||
| Past alcohol treatment | 50 (11) | 30 (6) | 44 (8) | 46 (12) |
= Timeline follow back self-report of alcohol use for the month prior to DWI arrest.
Alcohol spending – estimated annual alcohol expenditures based on self-reported weekly expenditures on alcohol; Driving after 3+ drinks – self-reported number of times driving after ≥3 drinks in the month prior to arrest; DWI cost – self-report estimate of total cost of the pending DWI charge by after final adjudication; Heavy drinking days – number of days with self-reported alcohol consumption of 5 or more drinks during the month prior to arrest.
4. Discussion
This project describes four QI cycles aimed at adapting TAC-informed CM for minimizing alcohol use and maximizing treatment completion among adults arrested for DWI who are awaiting trial. Under the different CM conditions, the proportion of participants retained for the full 8-weeks of treatment was highest by the final QI cycles. Participants who dropped out, tended to do so during the first half of treatment. The overall proportion of weeks with- and without-alcohol use increased under that later QI cycle conditions (due to fewer dropouts), but these effects did not reach statistical significance. Lower TAC values were observed under Cycles 1 and 4 conditions than Cycle 3 CM conditions. There were no systematic differences between the four cohorts in term of their demographic and alcohol use characteristics prior to treatment.
4.1 The Quality Improvement Process
4.1.1 Cycle 1
The first cycle was administered using a zero-tolerance strategy, where any TAC value > 0.00 was interpreted as a drinking event and the contingency payment for that week was forfeited. While this approach was planned with a strong emphasis on the amount of drinking, the salient outcome of this cycle was an undesirably high proportion of weeks with treatment dropout. Inspection of the TAC values revealed that a substantial proportion (about 40%) of these drinking events were less than the .02 g/dl TAC used by AMS for evidentiary purposes and anecdotally many of the participants protested that drinking did not occur. While concluding with this PDSA cycle, literature emerged cautioning against unreliability of interpreting TAC < 0.02 (Roache et al., 2015). In an effort to increase treatment retention across the 8-weeks of CM, the next cycle was planned to increase the TAC cut-off of above 0.02 g/dl for withholding contingency payment. While this criterion represents a lower bar for alcohol event detection than the AMS criteria (which requires 3 or more values above the .02 threshold), it is consistent with what has been used to detect drinking events in previous CM studies (e.g., Barnett et al., 2011) and alcohol administration studies demonstrate this criterion reliably detects consuming 3 or more alcohol drinks (Marques & McKnight, 2007; Roache et al., 2015).
4.1.2 Cycle 2
Following evaluation of Cycle 1 outcomes, changes were made in Cycle 2 to increase the criterion for withholding the contingent payment to TAC ≥ .02 g/dl and this level was used for the remaining QI cycles. Despite increasing to a higher TAC cut-off, outcomes observed were relatively unchanged from Cycle 1. Discussion continued to focus on the high proportion of treatment dropout and as a result a second payment manipulation was planned, to deliver an incentive payment for wearing the monitor in Cycle 3. Our previous research successfully included this approach to compensate participants for the burden of wearing the device (Dougherty et al., 2014; 2015a; 2015b).
4.1.3 Cycle 3
Under conditions including incentive payments for both maintaining TAC below .02 g/dl and for wearing the monitor there was a significant reduction in treatment dropout observed in Cycle 3 (relative to Cycles 1 & 2), a significant increase in the average maximal TAC values (relative to Cycle 1), and a non-significant increase in the proportion of weeks Non-Drinking. While encouraged by the reduction in Dropout, in evaluating Cycle 3 outcomes concerns were raised over two instances of tampering with the transdermal alcohol monitor. In both cases the tamper was detected concurrent with a drinking event (i.e., observed both TAC > .02 and AMS confirmed tamper event based on infrared and temperature readings). This lead to a retrospective review of previous cycles where we noted four additional AMS confirmed tamper events across the cycles. The analysis discussion raised the question if participants could receive their incentive payment by obscuring alcohol use through tampering. Out of this concern, Cycle 4 was planned to include altering instructions and including tampering as criterion for withholding incentive payment.
4.1.4 Cycle 4
During the final cycle, Dropout remained significantly below Cycles 1 & 2, average TAC values were significantly less than Cycle 3, there was a non-significant decline in the proportion of non-drinking weeks, and incentive payment was withheld on 3 occasions for tampering. Having explored several parameters of TAC cut-off, participant instruction, and incentive payment parameters, weeks with detected alcohol use was resistant to change, while Dropout and TAC values significantly varied under the different CM conditions. The purpose of this project was the use of a quality improvement methodology as a mechanism to adapt CM procedures for minimizing alcohol use and maximizing treatment retention among those recently arrested for DWI offenses. After 4 QI cycles, ideal outcomes were not achieved and there remains room for reducing alcohol use and increasing in treatment retention across the 8-weeks intervention. While we continue to develop a procedure for maximizing outcomes, desire for achieving ideal outcomes are balanced against need to use incentive values of a magnitude feasibly implementable within this context.
4.2 Pretrial Context
The pretrial context offers opportunities to overcome barriers typically faced in implementing CM procedures. Fundamental challenges to implementing CM for substance abuse are: the negative perception of paying someone for avoiding unhealthy behavior; dispersion of responsibility if the patient is not in a closed system of care; and lack of resources available to incentivize behavioral change (Gupta, 2015). Pretrial supervision offers the advantage of being a context where transdermal alcohol monitors are widely used, it is a closed system solely responsible for managing offender behavior (within the bond stipulations), and it is inherently a contingent-rich environment. Typically, TAC violations are used to return someone to jail as a punitive last resort. However, pretrial supervision has a host of other contingencies at their disposal, including: monetary incentives (levy or forgiveness of fines) and time incentives (e.g., frequency of required visits to the pretrial office; participation alcohol education classes, community service), which could be used for recurring non-compliance including TAC violations. We seek to evaluate the utility of CM using manipulation of incentives that can be contingent when a positive change in behavior is witnessed or at the first sign of a TAC violation. Ongoing efforts are underway to develop algorithms for CM of transdermal detection of drinking in the pretrial context, which have the potential to improve drinking outcomes for those with recent DWI arrests.
Even in the absence of ideal outcomes, the CM procedure can be developed as an effective tool to improve pretrial supervision of DWI offenders. Beyond the response rate to CM directly, another benefit of this approach is it is a relatively quick method to identify those who are unable to limit alcohol use in the context of contingencies. In this way CM can be used to inform a stepped-care approach to alcohol treatment. Stepped-care has been described as a useful heuristic approach for making decisions about treatment, where the intensity and dose of treatment delivered is based on the individual need (Sobell & Sobell, 2000). Delivery of alcohol interventions soon after DWI arrest is suggested to increase the likelihood of favorable response (Lapham, 2004); staging CM at the beginning of the pretrial process to detect early alcohol violations is a rapid method for identifying those requiring a greater level of intervention to reduce their alcohol use. The relatively limited resources for treatment services (e.g., psychological treatment) or enhanced judicial services (specialty DWI court) can then be reserved for those cases who are unsuccessful in CM.
4.3 Limitations
As with any attempt to use data to inform practice, this project is not without its limitations. First, the transdermal alcohol monitor used in this project has a lower limit of detection; the SCRAM reliably detects the consumption of 5 beers, but 45.9% of all occasions of drinking 1–3 beers were undetected using TAC > 0.02 (Roache et al., 2015). Second, outcomes were only based on objective criteria based on TAC readings, while qualitative interview would have add breadth to the quality improvement process (Moran et al., 2012). Finally, lacks rigor, control and precision that would be gained in a randomized controlled trial. As a result generalizable inferences about the effectiveness of CM for alcohol in DWI cannot be drawn. However, the PDSA cycle approach is consistent with current methodology for improving health intervention best practice and was selected for adapting the CM procedure for those with DWI rather than systematic research which would be too slow, expensive, and elaborate for rapid cycle change (Solberg et al., 1997). Using the PDSA process is a method to achieve improvement in outcomes, within its constraints it is what is feasibly delivered in this treatment context, and establishes baseline rates of response that can be used to inform design of randomized controlled trials for testing effectiveness of transdermal-informed contingency management for reducing alcohol use for DWI offenders.
4.4 Conclusions
In this quality improvement project, we collected and analyzed data for a CM intervention across four distinct quality improvement cycles. Outcomes from this project extend previous literature focusing on TAC-informed CM for heavy drinkers recruited from the community by documenting rates of alcohol use and dropout for a pretrial DWI offender population and under four different CM conditions. This data may help inform future efficacy studies of CM for alcohol use among DWI offenders. CM is a promising intervention for reducing alcohol use. This procedure can be informed through the use of transdermal alcohol monitors, which are widely used in the criminal justice system, especially in the pretrial supervision period. The current program is aimed at adapting CM procedures for adults arrested for DWI who are awaiting trial. Ongoing refinement of procedures are underway toward implementation of a CM program in pretrial services with those mandated to wear transdermal alcohol monitors. Our ultimate goal is development of algorithms for TAC-informed CM that can be scaled across pretrial jurisdictions and downstream result in reduction in the high recidivism of DWI.
Highlights.
Describes four Plan-Do-Study-Act (PDSA) cycles of quality improvement.
Adapting transdermal alcohol concentration monitoring for contingency management.
Treatment retention was greatest under final round of contingency management conditions.
The proportion of weeks with alcohol use remained stable across the four PDSA cycles.
Acknowledgments
Role of Funding Sources
Participant intervention services and the quality improvement process was supported by the Texas Medicaid 1115 Waiver program DHHS 085144601.2.6. Funding from the National Institutes of Health [award numbers R01AA014988; T32DA031115; and UL1TR001120] supported the development of the software algorithm for rapidly processing transdermal alcohol data for determination of contingency, and development of the expertise in interpretation of transdermal alcohol data. The content is solely the responsibility of the authors and does not necessarily represent the official views of the National Institutes of Health or the Texas Health and Human Services Commission; neither of these funders had a role in the design, collection, analysis or interpretation of the data, writing the manuscript, or the decision to submit the paper for publication. Dr. Donald M. Dougherty also gratefully acknowledges support from the William and Marguerite Wurzbach Distinguished Professor endowment.
We gratefully acknowledge the technical contributions of: Dr. Stacy Ryan for clinical support; Philip Brink and Cecily Lawrence for data management; and Sebastian Mounetou, Sanjuana Rodriguez, Thalia Rodriguez, and Javier Torres, for delivery of the SBIRT and CM. We appreciate your consideration of this manuscript for publication in the special issue on Ambulatory Assessment.
Footnotes
Publisher's Disclaimer: This is a PDF file of an unedited manuscript that has been accepted for publication. As a service to our customers we are providing this early version of the manuscript. The manuscript will undergo copyediting, typesetting, and review of the resulting proof before it is published in its final citable form. Please note that during the production process errors may be discovered which could affect the content, and all legal disclaimers that apply to the journal pertain.
Conflict of Interest
None of the authors have conflict of interest to declare. Specifically, we have no financial interest or disclosures for the transdermal alcohol monitor (SCRAM) used in this project.
- The design of this project was developed by authors: Mathias, Hill-Kapturczak, Karns-Wright, Mullen, Roache, and Dougherty.
- Data collection, administration, and analyses was the responsibility of authors: Mathias, Karns-Wright, and Mullen
- Interpretation of the data contributed to by authors: Mathias, Hill-Kapturczak, Karns-Wright, Mullen, Roache, Fell, and Dougherty
- The first draft of the manuscript was developed by author: Mathias and Hill-Kapturczak. It is subsequently reviewed, revised, and edited by all other authors.
- The decision to submit the paper for publication was determined by authors: Mathias and Dougherty.
References
- Barnett NP, Celio MA, Tidey JW, Murphy JG, Colby SM, Swift RM. A preliminary randomized controlled trial of contingency management for alcohol use reduction using a transdermal alcohol sensor. Addiction. 2017;112:1025–1035. doi: 10.1111/add.13767. [DOI] [PMC free article] [PubMed] [Google Scholar]
- Barnett NP, Tidey J, Murphy JG, Swift R, Colby SM. Contingency management for alcohol use reduction: A pilot study using a transdermal alcohol sensor. Drug and Alcohol Dependence. 2011;118:391–399. doi: 10.1016/j.drugalcdep.2011.04.023. [DOI] [PMC free article] [PubMed] [Google Scholar]
- Benishek LA, Dugosh KL, Kirby KC, Matejkowski J, Clements NT, Seymour BL, Festinger DS. Prize-based contingency management for the treatment of substance abusers: a meta-analysis. Addiction. 2014;109:1426–1436. doi: 10.1111/add.12589. [DOI] [PMC free article] [PubMed] [Google Scholar]
- Benjamini Y, Hochberg Y. Controlling the false discovery rate: A practical and powerful approach to multiple testing. Journal of the Royal Statistical Society. Series B (Methodological) 1995;57:289–300. [Google Scholar]
- Buner E. Pretrial diversion programs for DUIs. Traffic Resource Center for Judges. Issue Brief. 2015;2:1–7. [Google Scholar]
- Dougherty DM, Hill-Kapturczak N, Liang Y, Karns TE, Cates SE, Lake SL, Mullen J, Roache JD. Use of continuous transdermal alcohol monitoring during a contingency management procedure to reduce excessive alcohol use. Drug and Alcohol Dependence. 2014;142:301–306. doi: 10.1016/j.drugalcdep.2014.06.039. [DOI] [PMC free article] [PubMed] [Google Scholar]
- Dougherty DM, Charles NE, Acheson A, John S, Furr RM, Hill-Kapturczak N. Comparing the detection of transdermal and breath alcohol concentrations during periods of alcohol consumption ranging from moderate drinking to binge drinking. Experimental and Clinical Psychopharmacology. 2012;20:373–81. doi: 10.1037/a0029021. [DOI] [PMC free article] [PubMed] [Google Scholar]
- Dougherty DM, Karns TE, Mullen J, Liang Y, Lake SL, Roache JD, Hill-Kapturczak N. Transdermal alcohol concentration data collected during a contingency management program to reduce at-risk drinking. Drug and Alcohol Dependence. 2015a;148:77–84. doi: 10.1016/j.drugalcdep.2014.12.021. [DOI] [PMC free article] [PubMed] [Google Scholar]
- Dougherty DM, Lake SL, Hill-Kapturczak N, Liang Y, Karns TE, Mullen J, Roache JD. Using contingency management procedures to reduce at-risk drinking in heavy drinkers. Alcoholism: Clinical and Experimental Research. 2015b;39:743–751. doi: 10.1111/acer.12687. [DOI] [PMC free article] [PubMed] [Google Scholar]
- FBI. Uniform Crime Report: Crime in the United States, 2007. Department of Justice, Federal Bureau of Investigation; Washington, DC: 2015. [Google Scholar]
- Fell JC. A guide to sentencing DWI offenders. 2. National Highway Traffic Safety Administration and National Institute on Alcohol Abuse and Alcoholism; Washington, DC: 2006. (DOT HS 810 555) [Google Scholar]
- Fell JC. Update: Repeat DWI offenders involvement in fatal crashes in 2010. Traffic Injury Prevention. 2014;15:431–433. doi: 10.1080/15389588.2013.838230. [DOI] [PubMed] [Google Scholar]
- Gupta S. Contingency management: Why it pays to quit. Nature. 2015;552:s57–s59. doi: 10.1038/522S57a. [DOI] [PubMed] [Google Scholar]
- Javors MA, Johnson BA. Current status of carbohydrate deficient transferrin, total serum sialic acid, sialic acid index of apolipoprotein J and serum beta-hexosaminidase as markers for alcohol consumption. Addiction. 2003;98:45–50. doi: 10.1046/j.1359-6357.2003.00582.x. [DOI] [PubMed] [Google Scholar]
- Lapham S. Screening and brief intervention in the criminal justice system. Alcohol Research and Health. 2004;28:85–93. [PMC free article] [PubMed] [Google Scholar]
- Lussier JP, Heil SH, Mongeon JA, Badger GJ, Higgins ST. A meta-analysis of voucher-based reinforcement therapy for substance use disorders. Addiction. 2006;101:192–203. doi: 10.1111/j.1360-0443.2006.01311.x. [DOI] [PubMed] [Google Scholar]
- Maenhout TM, De Buyzere ML, Delanghe JR. Non-oxidative ethanol metabolites as a measure of alcohol intake. Clinica Chimica Acta. 2013;415:322–329. doi: 10.1016/j.cca.2012.11.014. [DOI] [PubMed] [Google Scholar]
- Marques PR, McKnight AS. Evaluating transdermal alcohol measuring devices (DOT HS 810 875) National Highway Traffic Safety Administration; Washington, DC: 2007. [Google Scholar]
- Marques PR, McKnight AS. Field and Laboratory Alcohol Detection with 2 Types of Transdermal Devices. Alcoholism: Clinical and Experimental Research. 2009;33:703–711. doi: 10.1111/j.1530-0277.2008.00887.x. [DOI] [PubMed] [Google Scholar]
- McKnight AS, Fell JC, Auld-Owens A. Transdermal alcohol monitoring: Case studies (DOT HS 811 603) National Highway Traffic Safety Administration; Washington, DC: 2012. [Google Scholar]
- Moran JW, Duffy GL, Smith J. In: Public Health Quality Improvement Encyclopedia. Reineke EE, Beaudry ML, editors. Public Health Foundation; Washington, DC: 2012. [Google Scholar]
- Mullen J, Ryan SR, Mathias CW, Dougherty DM. Feasibility of a computer-assisted alcohol screening, brief intervention and referral to treatment program for DWI offenders. Addiction Science & Clinical Practice. 2015a;10:1–10. doi: 10.1186/s13722-015-0046-1. [DOI] [PMC free article] [PubMed] [Google Scholar]
- Mullen J, Ryan SR, Mathias CW, Dougherty DM. Treatment needs of driving while intoxicated offenders: The need for a multi-modal approach to treatment. Traffic Injury Prevention. 2015b;16:637–644. doi: 10.1080/15389588.2015.1013189. [DOI] [PMC free article] [PubMed] [Google Scholar]
- NHTSA. Alcohol-impaired driving (DOT HS 812 102) National Highway Traffic Safety Administration; Washington, DC: 2014a. [Google Scholar]
- NHTSA. DWI recidivism in the United States: An examination of state-level driver data and the effect of look-back periods on recidivism prevalence (DOT HS 811 991) National Highway Traffic Safety Administration; Washington, DC: 2014b. [Google Scholar]
- Kirby KC, Benishek LA, Tabit MB. Contingency management works, clients like it, and it is cost-effective. American Journal of Drug and Alcohol Abuse. 2016;42:250–253. doi: 10.3109/00952990.2016.1139585. [DOI] [PMC free article] [PubMed] [Google Scholar]
- Roache JD, Karns TE, Hill-Kapturczak N, Mullen J, Liang Y, Lamb RJ, Dougherty DM. Detecting low level drinking using continuous transdermal alcohol monitoring. Experimental and Clinical Psychopharmacology. 2015;39:1120–1127. doi: 10.1111/acer.12750. [DOI] [PMC free article] [PubMed] [Google Scholar]
- Saunders JB, Aasland OG, Babor TF, de la Fuente JR, Grant M. Development of the alcohol use disorders identification test (AUDIT): WHO collaborative project on early detection of persons with harmful alcohol consumption-II. Addiction. 1993;88:791–804. doi: 10.1111/j.1360-0443.1993.tb02093.x. [DOI] [PubMed] [Google Scholar]
- Sobell LC, Sobell MB. Timeline Follow-back: A technique for assessing self-reported alcohol consumption. In: Litten ER, Allen J, Totwa NJ, editors. Measuring Alcohol Consumption. Humana Press Inc.; Totowa, NJ: 1992. pp. 41–72. [Google Scholar]
- Sobell LC, Sobell MB. Stepped care as a heuristic approach to treatment of alcohol problems. Journal of Consulting and Clinical Psychology. 2000;68:573–579. [PubMed] [Google Scholar]
- Solberg L, Mosser G, McDonald S. The three faces of performance measurement: Improvement, accountability, and Research. Journal of Quality Improvement. 1997;23:135–147. doi: 10.1016/s1070-3241(16)30305-4. [DOI] [PubMed] [Google Scholar]
- Sullivan JT, Sykora K, Schneiderman J, Naranjo CA, Sellers EM. Assessment of alcohol withdrawal: The revised Clinical Institute Withdrawal Assessment for Alcohol Scale (CIWA-Ar) British Journal of Addiction. 1989;84:1353–1357. doi: 10.1111/j.1360-0443.1989.tb00737.x. [DOI] [PubMed] [Google Scholar]
- Swift R. Transdermal alcohol measurement for estimation of blood alcohol concentration. Alcoholism: Clinical and Experimental Research. 2000;24:422–423. [PubMed] [Google Scholar]
- Swift R. Direct measurement of alcohol and its metabolites. Addiction. 2003;98:73–80. doi: 10.1046/j.1359-6357.2003.00605.x. [DOI] [PubMed] [Google Scholar]
- Tison J, Nichols J, Casanova-Powell T, Chaudhary N. Comparative study and evaluation of SCRAM use, recidivism rates, and characteristics (DOT HS 812-143) National Highway Traffic Safety Administration; Washington, DC: 2015. [Google Scholar]
- Vanlaar W, Robertson R, Schaap D, Vissers J. Understanding behavioral patterns of interlocked offenders to inform the efficient and effective implementation of interlock programs: How offenders on an interlock learn to comply. Traffic Injury Research Foundation. 2010 ISBM: 978-1-926857-09-1. [Google Scholar]
- Widgery A. Pretrial release eligibility. [Accessed February 4, 2016];National Conference of State Legislatures, March. 2013 from: http://www.ncsl.org/research/civil-and-criminal-justice/pretrial-release-eligibility.aspx.
- Zaloshnja E, Miller T, Blincoe L. Costs of alcohol-involved crashes, United States, 2010. Annals of Advances in Automotive Medicine. 2013;57:3–12. [PMC free article] [PubMed] [Google Scholar]


