

Abstract
Reduced fractional anisotropy (FA) is a well-established correlate of schizophrenia, but it remains unclear whether these tensor-based differences are the result of axon damage and/or organizational changes and whether the changes are progressive in the adult course of illness. Diffusion MRI data were collected in 81 schizophrenia patients (54 first episode and 27 chronic) and 64 controls. Analysis of FA was combined with “fixel-based” analysis, the latter of which leverages connectivity and crossing-fiber information to assess both fiber bundle density and organizational complexity (i.e., presence and magnitude of off-axis diffusion signal). Compared with controls, patients with schizophrenia displayed clusters of significantly lower FA in the bilateral frontal lobes, right dorsal centrum semiovale, and the left anterior limb of the internal capsule. All FA-based group differences overlapped substantially with regions containing complex fiber architecture. FA within these clusters was positively correlated with principal axis fiber density, but inversely correlated with both secondary/tertiary axis fiber density and voxel-wise fiber complexity. Crossing fiber complexity had the strongest (inverse) association with FA (r = −0.82). When crossing fiber structure was modeled in the MRtrix fixel-based analysis pipeline, patients exhibited significantly lower fiber density compared to controls in the dorsal and posterior corpus callosum (central, postcentral, and forceps major). Findings of lower FA in patients with schizophrenia likely reflect two inversely related signals: reduced density of principal axis fiber tracts and increased off-axis diffusion sources. Whereas the former confirms at least some regions where myelin and or/axon count are lower in schizophrenia, the latter indicates that the FA signal from principal axis fiber coherence is broadly contaminated by macrostructural complexity, and therefore does not necessarily reflect microstructural group differences. These results underline the need to move beyond tensor-based models in favor of acquisition and analysis techniques that can help disambiguate different sources of white matter disruptions associated with schizophrenia.
Keywords: Schizophrenia, Diffusion imaging, DWI, DTI, First episode, Chronic, White matter, Fiber density, Fiber organization
Graphical abstract
Highlights
-
•
MRtrix3's fixel-based analysis pipeline performs crossing-fiber modeling and anatomically precise whole-brain white matter registration
-
•
Axon bundle density and organizational complexity appear to underlie white matter alterations in first episode and chronic schizophrenia
-
•
Results underline the need to incorporate techniques that can help disambiguate sources of white matter alterations
1. Introduction
Schizophrenia is widely viewed as a disorder of brain connectivity. However, the extent to which brain dysfunction in schizophrenia may be due to alterations in the structural connections between neuronal populations remains unclear. Fractional Anisotropy (FA) is a commonly used tensor-based measure from diffusion weighted imaging that reflects the relative amount of water diffusion along a principal axis within a voxel of brain tissue. Schizophrenia spectrum disorders are associated with decreased FA in many white matter tracts, in particular in the corpus callosum, as well as in fronto-thalamic, fronto-striatal, and fronto-temporal regions (Canu et al., 2014; Pettersson-Yeo et al., 2011). These findings are often interpreted as indicative of reduced myelination or tract “integrity.” However, the interpretation of FA differences is problematic, particularly in brain regions containing crossing fibers (Jbabdi et al., 2010; Tournier et al., 2011). Evidence suggests that at least one third (and up to 90%) of white matter voxels contain crossing fibers, virtually invalidating the use of the tensor model on which FA is based as a tool for making inferences about microstructural properties of white matter in specific bundles (Behrens et al., 2007; Jeurissen et al., 2013).
Of the available techniques, constrained spherical deconvolution (CSD) is best able to detect voxels containing crossing fibers in simulated data (known ground truth) at b-values typical for clinical studies (e.g., b = 1000; Wilkins et al., 2015). MRtrix3's Fixel-based analysis pipeline uses constrained spherical deconvolution and underlying tractography to examine the properties of individual fiber populations within a voxel (“fixels”) and can therefore go beyond whole-voxel FA estimation to provide more anatomically specific information about the micro and macrostructural properties of white matter populations, particularly in crossing fiber regions. While FA captures information about overall relative diffusion patterns in a voxel, studies in both phantom and human data show that fixel-based analysis can approximate both the density and macrostructural cross-section of distinct fiber bundles traversing a voxel (Raffelt et al., 2015, Raffelt et al., 2016). In addition, the fixel-based pipeline can provide a measure of the degree of organizational complexity of distinct fiber populations within a voxel (Fig. 1c; Riffert et al., 2014).
Fig. 1.

Schematic of Fiber Density Reduction (A) and Fiber Cross-Section Reduction (B). (C) Example of how changes in the relative FD in a crossing fiber region affects complexity (CX). Complexity (CX) metrics will be higher if there is a relative increase in the FD2 (density of the second fiber population in a voxel) or if there is a decrease in the FD1 (density of the primary fiber population within a voxel). A and B adapted with permission from (Raffelt et al., 2016).
In the present study, we sought to examine schizophrenia-linked white matter changes using typical FA analysis and then to further investigate the sources of FA differences using fixel-based analysis. Based on the existing literature linking FA decreases to schizophrenia (Ellison-Wright and Bullmore, 2009; Samartzis et al., 2013) and on post-mortem studies that demonstrate structural oligodendrocyte alterations and axonal myelin damage in schizophrenia patients (Bernstein et al., 2015; Vikhreva et al., 2016), we hypothesized that schizophrenia patients would exhibit lower FA in frontal and callosal white matter and that these FA differences would be attributable to reductions in principal axis fiber density. In addition, since it is possible that more off-axis diffusion signal in or near crossing pathways could also contribute to lower FA, we performed exploratory whole brain analyses to test the hypothesis that crossing fiber complexity is higher in patients compared to controls.
2. Methods and materials
2.1. Sample recruitment and demographics
All participants were recruited as part of the Center for Neurocognition and Emotion in Schizophrenia research. The study protocol and consent form were approved by the institutional review boards of the University of California, Los Angeles (UCLA) and Yale University, and all participants provided written informed consent. The present sample included individuals who had recently experienced their first episode (FE) of schizophrenia (within two years prior to recruitment), individuals with chronic schizophrenia, and matched healthy controls. Schizophrenia diagnosis was determined using the Structured Clinical Interview for DSM-IV Axis I disorders (SCID-I; First et al., 1995). Patients were excluded on the basis of drug induced psychosis, substance dependence within the last 6 months, or history of traumatic brain injury or neurological disorder. Patients were recruited from public and private clinics and hospitals in the Los Angeles area, and all FE patients were under the care of the UCLA Aftercare Research Program. All FE patients were clinically stabilized at the time of test (61% Risperidone, 19% Olanzapine, 6% Aripiprazole, 8% Other antipsychotic, 6% missing; missing data were due to computer error). Chronic patients were drawn from a sample of patients previously recruited and treated as FE patients through the Aftercare program, but whose initial psychotic episode occurred 5 years or more prior to the imaging assessment. The medication profile of the Chronic patient subset was somewhat more diverse: 33% Risperidone, 20% Aripiprazole, 11% Haldol, 30% other antipsychotic, 6% no current antipsychotic medication.
Healthy control participants were recruited through local advertisements (newspapers and posters). Control participants were excluded based on the following criteria: history of any major DSM-IV Axis I disorder, neurological disorder, traumatic brain injury, or drug dependence or recent abuse (as assessed by the SCID-I). Potential control participants were also excluded if they had a first-degree relative with psychosis, or if they were currently pregnant.
The initial MRI sample comprised 163 patients and controls aged 18–40. Following visual inspection for scan quality, 18 scans were removed: 15 based on Field of View errors (7 controls) and 3 based on overt MR artifacts, such as blurring or warping (2 controls). The final sample included 81 patients (54 FE and 27 Chronic) and 64 age-matched controls. Patients and controls did not differ significantly in age (t(139) = 1.56, p = 0.12) or sex (X2 = 0.39, p = 0.53). Sample demographics are presented in Table 1.
Table 1.
Sample characteristics.
| Patients N = 81 |
Controls N = 64 |
Group difference |
||
|---|---|---|---|---|
| Predictor | Statistic | p-Value | ||
| % Male | 70% | 63% | X2(1) = 0.68 | 0.41 |
| Mean age (SD) | 25.35 (5.40) | 26.95 (6.04) | t(143) = 1.68 | 0.10 |
| Mean years of education (SD) | 13.0 (1.6) | 14.2 (1.7) | t(143) = 4.03 | <0.001 |
| Mean Years of parental education (SD) | 13.10 (4.01) | 13.71 (2.13) | t (143) = 1.51 | 0.13 |
| Ethnicity | ||||
| % Black | 20% | 20% | X2(1) = 0.00 | 1.00 |
| % Hispanic | 38.5% | 41.6% | X2(1) = 0.03 | 0.87 |
| Mean Global Positive Symptoms (SAPS) (SD) | 1.35 (1.3) | NA | NA | NA |
| Mean Global Negative Symptoms (SANS) (SD) | 2.00 (1.22) | NA | NA | NA |
| Medication | ||||
| % Risperodone | 52% | NA | NA | NA |
| % Olanzapine | 12% | |||
| % Aripiprazole | 14% | |||
| % Haldol | 7% | |||
| % Other | 11% | |||
| % Unmedicated | 2% | |||
| % Missing data | 4% | |||
| Mean duration of illness (months) (SD) | ||||
| All patients | 37.68 (54.78) | NA | NA | NA |
| First episode | 6.21 (5.13) | |||
| Chronic | 107.17 (50.34) | |||
2.2. Neuroimaging data acquisition & preprocessing
Imaging was performed on a 3T Siemens Trio Scanner using a 12-channel head coil at the Staglin Center for Cognitive Neuroscience at UCLA. The diffusion image was acquired as a single-shot spin-echo echo planar imaging pulse sequence, with 64 diffusion sensitized gradients (b = 1000) and seven b = 0 volumes collected (b = 0 images stacked at the beginning of the sequence). Repetition time (TR)/echo time (TE) was 7000 ms/93 ms, voxel size = 1.98 × 1.98 × 3.00, matrix = 96 × 96 × 50, and acquisition time was 8 min, 24 s.
In order to approximate and control for subtle effects of motion, data were processed using FSL's EDDY tool, which provides estimates of relative volume-to-volume motion for each participant, adjusted for translation in the Phase Encoding direction. Patients had higher mean relative motion compared to controls (Patient mean = 0.20 (0.12), Control mean = 0.16 (0.08), t(143) = −2.26, p < 0.05). To account for motion effects, mean relative motion was included as a covariate in all analyses. In addition, we formed matched groups of patients and controls (whereby each control was matched with one or more patients based on the mean relative motion parameter, excluding any patients for whom motion was unmatched with a control subject) and tested whether the primary results held when motion was perfectly balanced between diagnostic groups. This motion-matched subset consisted of 64 patients (mean motion = 0.16 (0.05)) and 64 controls (mean motion = 0.16 (0.08)); t(126) = 0.30, p = 0.76. Since signal-to-noise ratio (SNR) of diffusion-weighted images may have important implications for diffusion metric estimation, we also calculated SNR using the tools outlined in Roalf et al. (2016). Mean SNR across the whole sample was 7.79 (0.70), which indicates good-to-excellent SNR across the sample (Roalf et al., 2016). Patients had slightly lower SNR compared to controls (t(143) = 2.03, p < 0.05), but this difference was explained entirely by the high correlation between relative motion and SNR (r(143) = −0.83, p < 0.001).
2.3. Tract based spatial statistics
Dicom files were converted to nifti using dcm2nii (http://www.mccauslandcenter.sc.edu/mricro/mricron/dcm2nii.html). The preprocessing steps and all analyses were completed using tools in FMRIB Software Library (FSL 5.0.3; Smith et al., 2006; http://www.fmrib.ox.ac.uk/fsl). All images were corrected for motion and eddy current distortions using EDDY, which also outputs corrected bvecs files for use in subsequent tensor-fitting steps. Brain extractions were completed using the FSL brain extraction tool (bet), and dtifit was used to calculate diffusion parameters using the adjusted bvecs files.
FA images were normalized to an FA template in Montreal Neurological Institute (MNI) space using the non-linear registration algorithm FNIRT. A mean FA image was calculated from the spatially normalized images of all subjects. This image was then “skeletonized” to allow for the comparison of FA values across spatially matched tract structures across all subjects. FA values of each subject were projected on the mean sample-based FA skeleton for use in regression analyses.
Voxel-wise whole-brain statistical analyses were performed using the “randomise” command in FSL. Randomise uses the general linear model in conjunction with 5000 non-parametric permutation tests to generate test statistics. Threshold-free cluster enhancement (TFCE) was used because it avoids an arbitrarily predefined T-threshold or cluster threshold (Smith and Nichols, 2009). Whole-brain family wise error (FWE) corrected p-maps were thresholded at an FWE of 0.05. All reported coordinates are in MNI_152 space, and results are reported using the JHU-White-Matter Tractography Atlas and the JHU ICBM-DTI-81 White Matter Labels Atlases.
Per the FSL GLM recommendation, all continuous variables were mean centered prior to being entered into regression. Using FSL's GLM tool, the main effect model of interest in the present study was set up to test for group differences in FA between patients and controls, covarying for age, sex, and mean relative head motion. Secondary analyses were conducted to determine whether there was an interaction effect between age and diagnosis (all interaction effects were tested in separate models, and the interaction terms were never included in models from which main effects are reported).
2.4. Fixel-based processing and analysis
All fixel-based processing steps were carried out using MRtrix3 version RC2, according to the procedures outlined in the MRtrix3 documentation (www.MRtrix.readthedocs.io; Raffelt et al., 2016). The processing steps are summarized briefly here (see Supplemental Materials for further details). Following dcm2nii conversion, data were converted from nifti format to MRtrix3 format (“.mif”) using mrconvert and preprocessed according to the MRtrix3 fixel-based workflow. All images were denoised (Veraart et al., 2016; see supplemental methods for more detail) preprocessed via FSL's EDDY, and bias field corrected. In order to adjust for free water compartment influences, tissue-specific (CSF and white matter) response functions were then generated for each subject and then averaged to create sample-specific response functions for white matter and CSF, respectively (Dhollander et al., 2016). B = 0 images can be leveraged as a second “shell” from which CSF-specific response functions can be estimated in each participant. Modeling the distinct response functions for white matter and CSF in this way makes it possible to apply multi-shell, multi-tissue deconvolution in single-shell data, thereby enhancing the signal from white matter relative to CSF (Dhollander et al., 2016). This strategy is technically referred to as “single shell, multi tissue” constrained spherical deconvolution (SSMT-CSD), and is useful because the better signal-to-noise ratio ameliorates the problem of white matter volume overestimation that can arise from the standard “single shell, single tissue” approach (Jeurissen et al., 2014). The SSMT-CSD technique has been successfully applied in a recent study of optic neuritis in multiple sclerosis (Gajamange et al., 2017). In order to demonstrate that Dhollander et al.'s (2016) algorithm can appropriately identify white matter vs. CSF voxels in our single-shell data, we randomly selected 6 participants and included the graphical output of the voxel selection procedure in the Supplemental Material (Supplemental Fig. 4).
Multi-shell, multi-tissue constrained spherical deconvolution was performed for white matter and CSF, respectively, using the previously estimated response functions, and the resulting white matter Fiber Orientation Distribution (FOD) images were fed forward into all subsequent analysis steps. The mtnormalise command was used to correct for intensity inhomogeneities across subjects, and the normalized white matter FOD images were then coregisistered to create a sample-specific FOD template. Peak FOD amplitudes at each fixel in this template were calculated and thresholded (at 0.30) to remove fixels containing residual gray matter peaks. This thresholded image was then used to create an “analysis fixel mask” and an “analysis voxel mask”, which represent the coregistered fixel- and voxel-space in white matter across all subjects in the sample. Individual subjects' FOD images were then transformed into a sample-specific FOD template space, segmented into fiber density-based (FD) fixels within each voxel, and reoriented to the template space. The final FD images for each subject were computed by taking each fixel in reoriented subject space and assigning it to the corresponding fixel in template space. Fiber cross-section (FC) is then computed based on the deformation fields of the warps generated during registration, allowing for some measure of the macroscopic diameter of fiber bundles spanning multiple voxels (see Fig. 1).
Because connectivity-based fixel enhancement (CFE) capitalizes on tractography-based connectivity information to inform the spatial extent of clustering in fixel-wise analyses, whole brain tractography was performed on the unbiased FOD sample-specific FOD template, and the resulting 20-million streamline tractogram was reduced using SIFT (Smith et al., 2013) to contain 2 million streamlines for use in analyses. Finally, the fixelcfestats command, which uses GLM in concert with non-parametric permutation testing (5000 permutations) was used to perform whole-brain fixel analyses for fiber density and cross-section, respectively.
In order to verify the spatial extent of FA group differences from TBSS, we also performed FA analysis using MRtrix tools. Starting with native space images that were processed with EDDY, the tensor model was fit at each voxel using dwi2tensor, and FA images were created using the tensor2metric command. To ensure robust registration based on underlying fiber architecture, MRtrix-derived FA images were transformed to the same template space used in fixel-based analyses. In addition, a complexity metric was computed across each subject's template-space fixel image and stored at the voxel level. The complexity metric ranges from zero to one (where zero represents a voxel with a single fixel), and nears one when multiple fixels within a voxel have the same fiber density. Since small densities may be spurious, complexity was computed based on both the raw fixel images, and then again on fixel images that were thresholded to remove small densities (<0.1). For voxel-wise analyses, both complexity and FA images were then smoothed at FWHM = 3 and entered into regression models using MRtrix3's mrclusterstats. The mrclusterstats command is similar to FSL's randomise in that it uses Threshold-free cluster enhancement, and performs FWE correction using non-parametric bootstrapping (5000 permutations).
All mrclusterstats and fixelcfestats regression models included sex, age, and mean relative subject motion as covariates. Reported results from TBSS and MRtrix analyses are Family Wise Error (FWE) corrected. Extracted region-of-interest based metrics were analyzed using R statistical software (R Core Team, 2016).
3. Results
3.1. FA results: TBSS and MRtrix
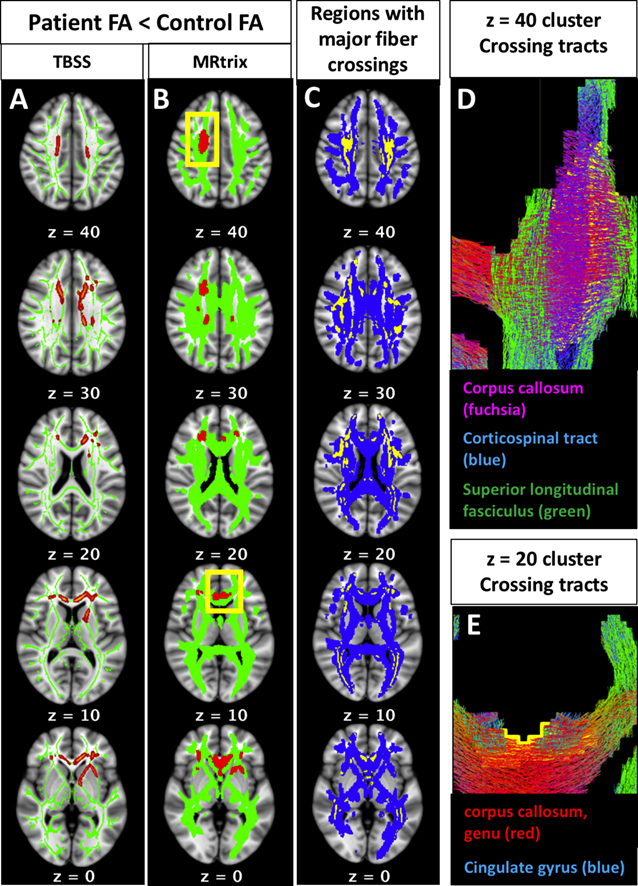
Controlling for multiple comparisons on a voxel-wide level, both the TBSS and MRtrix analyses revealed a significant main effect of diagnostic group on FA, with patients showing lower FA than controls in several non-contiguous clusters. Group differences in FA were regionally consistent between the independent pipelines. As demonstrated in Fig. 2, voxel-wise differences in FA occur in regions overlapping and adjacent to major white matter crossings. Roughly one third of the voxels in the MRtrix FA results (880 voxels out of 2405; Fig. 2A) contained two or more fiber populations in the sample-specific fixel-based template, even after thresholding for small density values (densities <0.1 removed). All regions containing two or more fiber populations in the fixel-based sample template are shown in 2C (yellow), overlaid on the MRtrix white matter template (2C, blue). Note that this map of fiber crossings represents the crossing regions shared by all subjects in the sample; individual subjects' data contain more extensive individualized crossing patterns, which would have further influenced variation in subject-wise FA values. Generally speaking, the clusters were located in the bilateral frontal white matter, the right centrum semiovale, and left anterior limb of the internal capsule. Based on the JHU white matter tractography atlas (Wakana et al., 2004), clusters at each of the axial MNI z-coordinates from the MRtrix results (Fig. 2B) have a high probability of being traversed by the following white matter pathways: z = 40: right corpus callosum, right corticospinal tract, and right superior longitudinal fasciculus (further detail can be seen in tractogram, 2D); z = 30: bilateral corpus callosum, right anterior thalamic radiation, right corticospinal tract; z = 20: bilateral anterior thalamic radiations, left cingulate gyrus, right inferior fronto-occipital fasciculus (further detail can be seen in tractogram, 2E); z = 10: bilateral genu of the corpus callosum, bilateral cingulate gyri; z = 0: bilateral genu of the corpus callosum, bilateral cingulate gyri, left anterior limb of the internal capsule, bilateral inferior fronto-occipital fasciculi. There was no significant interaction of diagnostic group-by-age in any region of the TBSS skeleton or the MRtrix white matter template.
Fig. 2.

Fractional anisotropy (fa) results: patients vs. controls.
Group differences in FA occur in regions overlapping and adjacent to major white matter crossings. Results from both the TBSS (2A, red) and MRtrix (2B, red) voxel-based tensor analysis pipelines demonstrated that patients have lower FA compared to controls, and these group differences are regionally consistent between the independent pipelines. Roughly one third of the voxels in Fig. 2A (880 voxels out of 2405) contained two or more fiber populations in the sample-specific fixel-based template. All regions containing two or more fiber populations in the fixel-based sample template are shown in 2C (yellow), overlaid on the MRtrix white matter template (2C, blue). The clusters at each of the following MNI z-coordinates from the MRtrix results (2B) are traversed by the following white matter pathways: z = 40: right corpus callosum, right corticospinal tract, and right superior longitudinal fasciculus (further detail can be seen in tractogram, 2D); z = 30: bilateral corpus callosum, right anterior thalamic radiation, right corticospinal tract; z = 20: bilateral anterior thalamic radiations, left cingulate gyrus, right inferior fronto-occipital fasciculus (further detail can be seen in tractogram, 2E); z = 10: bilateral genu of the corpus callosum, bilateral cingulate gyri; z = 0: bilateral genu of the corpus callosum, bilateral cingulate gyri, left anterior limb of the internal capsule, bilateral inferior fronto-occipital fasciculi. (For interpretation of the references to color in this figure legend, the reader is referred to the web version of this article.)
The FA differences reported above are largely consistent with those seen in prior studies of chronic and first episode illness using similar approaches (e.g., TBSS; see Ellison-Wright and Bullmore, 2009; Samartzis et al., 2013), indicating that the patients in this study are likely to be representative of the broader population of patients, at least in terms of the general white matter features most robustly associated with schizophrenia. Given that nearly all of the regions showing case-control differences in FA are likely to contain crossing fibers, it is unclear whether the observed effects reflect reduced myelination or other changes in microstructure, such as reduced fiber density and/or more fiber crossing. To examine this possibility, we next evaluated metrics related to fiber density and organization from the MRtrix pipeline described above.
3.2. Complexity results
To examine the possibility that organizational changes also contribute to FA differences, we used the MRtrix3 pipeline to generate a voxel-wise metric of fiber complexity, which depends on the relative density of different fiber populations within a voxel (Fig. 1c). When calculated from unthresholded fixel images, complexity was higher in patients compared to controls across most of the white matter template (FWE p < 0.05, Supplemental Fig. 1A). However, after thresholding fixel density to remove small, potentially spurious fixels (FD < 0.1), there were no longer significant group differences in complexity (minimum FWE p = 0.06; Supplemental Fig. 1B). The trend-level complexity effects that that remained following the removal of small densities had precise anatomical overlap with significant group differences in FA (Fig. 2b, main text).
3.3. Fixel-based results
At the whole brain level, Fiber density (FD) was significantly lower in patients in the postcentral and posterior corpus callosum (p.FWE < 0.05, Fig. 3). Fiber Cross-section (FC) did not differ significantly between patients and controls. With the exception of a handful of voxels in the right postcentral callosal fibers, significant group differences in FD did not overlap anatomically with group differences in FA.
Fig. 3.

Fiber density results: patients vs. controls.
Regions in which patients displayed lower fiber density compared to controls (red-orange; MNI coordinates of minimum p-value = 5, −10, 27). As demonstrated by the plot, there was no correlation between FD and age for either the patients or the controls. (For interpretation of the references to color in this figure legend, the reader is referred to the web version of this article.)
Across the MRtrix-based FA group difference map, complexity was highly inversely correlated with FA (r = −0.82). In order to understand whether these complexity differences were due to primary fiber density reductions, secondary/tertiary density increases, or both, we used the fixel2voxel command to decompose subjects' fixel images into primary, secondary, and tertiary voxel-based fiber density maps. Using the FA-based ROI as a mask, we extracted means for each subject for each metric (FA, CX, FD1, FD2, FD3). Across the FA-based ROI, FA was significantly positively correlated with principal axis fiber density (FD1), but significantly inversely correlated with secondary and tertiary fiber densities (FD2, FD3). Fig. 5 displays the raw Pearson correlations among these metrics with corresponding scatter plots. To determine the extent to which each of these metrics (FD1, FD2, FD3) were associated with group status, we used mrclusterstats to perform three additional group comparisons (FD1, FD2, and FD3 in patients vs. controls), controlling for age, sex, and mean relative motion. Results indicated that lower fiber density in the principal axis explained FA group differences across much of the ROI, especially in the clusters overlapping the postcentral corpus callosum (Fig. 4B), but patients also had significantly higher tertiary axis fiber density in these regions (Fig. 4D). Secondary axis fiber density was also significantly higher in patients, albeit only in the more frontal, ventral portions of the FA-based ROI (Fig. 4C).
Fig. 5.

Correlations among diffusion metrics computed across the significant FA-based voxel clusters.
Scatterplots, histograms, and raw Pearson correlations among diffusion metrics within the clusters where FA differed significantly between patients and controls. FA = Fractional Aniostropy, CX = Complexity, FD1 = Fiber Density, largest fixel, FD2 = Fiber Density, second largest fixel, FD3 = Fiber Density, third largest fixel. *** (p < 0.0001), ** (p < 0.001).
Fig. 4.
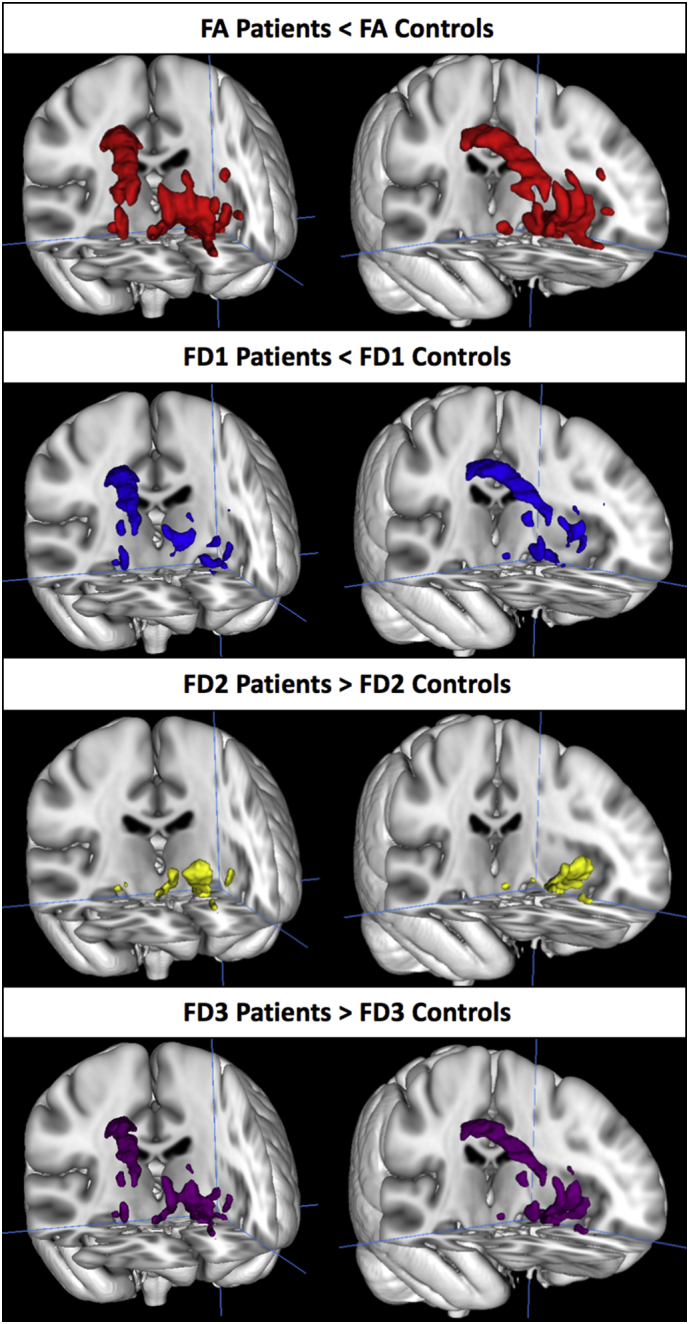
Group differences in fiber density (FD) within the FA-based region of interest.
Within the regions where patients had significantly lower FA compared to controls (1A, red), patients had lower fiber density in the primary (largest) density fixel (FD1; 1B, blue), but higher fiber density in secondary (FD2; 1C, yellow) and tertiary fixels (FD3; 1D, purple). (For interpretation of the references to color in this figure legend, the reader is referred to the web version of this article.)
3.4. Associations with age and duration of illness
TBSS analyses indicated that there was no significant main effect of age on FA, and fixel-based analyses using the whole brain template did not reveal a significant effect of age on fiber density (nor fiber cross section). There was a significant positive association between age and mean voxel-wise complexity in small clusters in the bilateral centrum semiovale, right superior longitudinal fasciculus, and left genu of the corpus callosum (Supplemental Fig. 2). There were no significant interactions between age and schizophrenia group for any of the white matter indices. To further investigate potential effects of chronicity, we also ran whole brain regressions to examine the effect of total illness duration within the 81 patients. When controlling for age, there was no significant effect of illness duration on FA, complexity, or FC. However, there was a significant inverse association between total months ill and FD in the bilateral postcentral corpus callosum (medial aspect of the forceps major; Supplemental Fig. 3); the callosal region significantly associated with chronicity was adjacent to (but did not overlap with) the postcentral callosal regions that differed between patients and controls. Finally, we ran groupwise comparisons to examine whether Chronic patients differed from First Episode patients in any of the whole brain diffusion metrics. Whole brain analyses (controlling for age and sex) did not reveal any regions where Chronic patients differed from First Episode patients in FA, FD, FC, or complexity.
3.5. Results in patient and control samples matched on head motion during scanning
All of the analyses reported above used a motion parameter derived from the EDDY processing stream as a covariate. To determine whether the primary results held when motion was perfectly balanced between diagnostic groups, we also formed matched groups of patients and controls, whereby each control was matched with one or more patients based on the mean relative motion parameter. This procedure (which effectively excluded any patients for whom motion was unmatched with a control subject) resulted in samples of 64 patients and 64 controls. Among these groups perfectly matched on motion, patients continued to show lower fiber density in the corpus callosum (matched sample β = −0.27, p < 0.01; full sample β = −0.21, p < 0.01) and lower FA in the FA-based MRtrix clusters (matched sample β = −0.57, p < 0.0001; full sample β = −0.56, p < 0.0001).
4. Discussion
We sought to disambiguate the meaning of FA reductions in schizophrenia using connectivity-enhanced fixel analysis, which uses constrained spherical deconvolution to account for the presence of multiple fiber populations within a voxel. Results demonstrated a general pattern of attenuated fiber density in patients compared with controls, although this group difference only reached significance in the postcentral and posterior corpus callosum when controlling for multiple comparisons at the whole-brain level. This finding is consistent with the results of the only other study that reports on schizophrenia-linked white matter density while accounting for fiber orientation and free water volume using a different method from that in this study (Rae et al., 2017). Callosal abnormalities are commonly reported in schizophrenia samples (Francis et al., 2016; Highley et al., 1999), and their effects on interhemispheric connectivity may be linked to some of the core symptoms of psychosis, particularly auditory hallucinations and language deficits (Mulert et al., 2012).
There was virtually no overlap between group differences in fiber density and group differences in FA. However, trend-level (FWE p < 0.06; Fig. S1) group differences in complexity were almost perfectly coextensive with group differences in FA. Within the FA-based ROI, higher complexity values observed in patients appeared to be the result of lower density in the primary fiber bundle, as well as higher density in the secondary fiber bundle (see Fig. 1c). This situation suggests that the observed FA differences are largely capturing information about group differences in crossing fiber organization—not necessarily information that reflects density differences that are attributable to specific pathways (measured by FD). In this sample, one third of the significant FA ROI contained voxels that had at least two crossings in the study-specific template. Compared to this shared white matter template, individual subjects' data contain even more extensive individualized crossing patterns, which would have further influenced organization-driven variation in subject-wise FA values. Another way to think about the result is that FD and FA are positively associated in this sample and within the FA-based ROI (see Fig. 4, Fig. 5), yet their shared variance in the FA-based ROI was not significantly associated with patient status.
It is not entirely clear why schizophrenia would be linked to lower white matter density in primary fibers, but higher densities in secondary/tertiary fibers. One explanation for this situation is that as primary white matter bundles lose density, processes secondary to this loss fill the empty space, and these cells restrict diffusion signal in a way that mimics crossing fibers. There is some limited evidence that this occurs in schizophrenia: studies examining white matter histology in nonelderly postmortem patients demonstrate increases in microglia as well as unusual morphology of myelinated cells (Uranova et al., 2004; Vikhreva et al., 2016). Also consistent with this interpretation, histological analysis in aging macaques observed that the degeneration of axons (and their myelin sheaths) is accompanied by a marked increase in microglia, oligodendrocytes, and astrocyte processes (Peters and Sethares, 2002; Sandell and Peters, 2002). The presence of these developmental shifts in white matter content could also partially explain why white matter volume in normally developing humans appears to reach its developmental peak roughly 20 years later than peak FA (Westlye et al., 2010; Yeatman et al., 2014). The positive association between age and complexity observed in our sample appears compatible with the idea that age- or illness-related increases in non-axonal cells could manifest as anisotropic diffusion signal. Also supporting this interpretation is the fact that the majority of the patient group difference in complexity across the whole white matter template was attributable to small-density fixels (FD < 0.1, see Supplemental Fig. 1A versus 1B) that are less likely to represent axonal fiber populations per se, especially considering that fixels with fiber densities in the range of 0.01–0.12 were typically observed in gray matter voxels in our sample. However, based on the present methodology, we cannot rule out the possibility that the fiber density signal related to off-axis diffusion in the patients may reflect higher amounts of small-density secondary fiber populations, as could be characteristic of ectopic cell placements (Benes and Berretta, 2001; Connor et al., 2011). Although we were careful to account for the effects of head motion, we also cannot completely rule out the possibility that subtle, unmeasured motion caused many small, spurious fixels to be identified during constrained spherical deconvolution.
Cross-sectional analyses of FA, fiber density, and complexity in our sample generally indicate that patients do not display a steeper rate of age-related changes in white matter microstructure compared with controls. However, there was a small region of the medial/posterior corpus callosum in which illness chronicity was negatively associated with fiber density (Supplemental Fig. 3). The largest cross-sectional studies that have examined age-related FA decline in schizophrenia report somewhat conflicting results. One study, in participants aged 15–64 (N = 224 patients), found no evidence of progressive schizophrenia-linked FA changes (Schwehm et al., 2016), while another study reported a significantly steeper FA decrease across age in patients compared to controls (N = 324 patients, ages 20–65; Cropley et al., 2016). The findings of the latter study appear driven primarily by the FA group difference in participants older than 40, and so it is likely that we did not have an adequate age range to detect accelerated decline in older patients if it occurs.
Our results demonstrate that the MRtrix3 fixel-based connectivity pipeline can identify some group differences using diffusion acquisition parameters typically collected in clinical settings, that is, single-shell diffusion sequences with b = 1000. The finding that group differences in FA occur primarily in white matter regions with complex fiber architecture, paired with the lack of anatomical overlap in FA findings and FD findings, reinforces concerns about the utility of FA for understanding specific sources of white matter changes. Fig. 3 demonstrates that schizophrenia-linked fiber density differences can be attributed to structural alterations within distinct white matter pathways. This capability of the MRtrix pipeline represents a distinct advantage in this context. The present results suggest that some medial callosal fiber density attenuation is present in both first episode and chronic patients, and that longer chronicity is correlated with lower fiber density in a more posterior callosal region. Future studies should endeavor to understand the precise sources of these effects.
5. Limitations and future directions
This study has several limitations. First, although b = 1000 is adequate for constrained spherical deconvolution(Wilkins et al., 2015), higher b-values are more optimal for detecting fiber density differences, and this shortcoming may have reduced our power to detect more widespread significant differences in fiber density. By using distinct response functions for white matter and CSF during fiber orientation distribution estimation, we were able to implement some free water volume adjustment, which may increase the interpretability of fiber density changes at b = 1000 by enhancing the signal from white matter relative to free water. That said, this free water adjustment method is not as well vetted as some others (Pasternak et al., 2012; Rae et al., 2017). The complexity metric, while compelling, is not a precise measure of literal fiber complexity. Potential sources of changes in complexity include group differences in typical crossing fiber angle, the presence of cell bodies secondary to inflammation, or other types of cytological differences. Finally, compared to single-shell data, multi-shell diffusion acquisitions are likely to further enhance the signal-to-noise benefits of multi-tissue CSD, and thus may reveal subtler, more extensive white matter alterations associated with schizophrenia. Future work will benefit from large sample sizes, and should aim to collect diffusion data that are more optimized to multi-compartment, high-angular analysis methods; otherwise the precise nature FA changes in schizophrenia will remain ambiguous.
6. Conclusions
The group differences in fiber density observed in the postcentral corpus callosum suggest that anatomically specific schizophrenia-linked white matter density disruptions can be identified using fixel-based analysis. Significant tensor-based group differences (in FA) were not coextensive with fixel-based group differences in FD, but were highly coextensive with voxels containing complex fiber configurations, raising the possibility that FA reductions in schizophrenia are partly attributable to processes other than axon loss or axonal myelin damage. With the increasing availability of more advanced diffusion imaging sequences and analysis techniques, these results underline the need to move beyond tensor-based diffusion models in favor of techniques that pave the way for a more nuanced understanding of white matter changes associated with schizophrenia.
Acknowledgments
Acknowledgments
This study was supported by NIH grant # P50 MH066286.
We are very grateful to the authors of the MRtrix3 software for several helpful clarifications and advice provided during the course of analyses, with special thanks to Drs. David Raffelt, Thijs Dhollander, Robert Smith, and J-Donald Tournier.
Financial disclosures
Dr. Cannon reports that he is a consultant to Boehringer Ingelheim Pharmaceuticals. Dr. Nuechterlein reports he has received research grants from Janssen Research and Development, Genentech, and Posit Science, Inc., and has been a paid consultant to Astellas, Janssen Scientific Affairs, Takeda, and Teva. Dr. Ventura has been received a research grant from Posit Science, Inc. and has been a paid consultant to Boehringer Ingelheim. Dr. Subotnik has been a paid consultant to Janssen and Teva. Drs. Grazioplene, Bearden, and Haut report no biomedical financial interests or potential conflicts of interest.
Footnotes
Supplementary data to this article can be found online at https://doi.org/10.1016/j.nicl.2018.02.015.
Appendix A. Supplementary data
Supplementary material 1
MRtrix3 Fiber Density Results in MNI space.
FSL FA Results in MNI space.
MRtrix3 FA Results in MNI space.
References
- Behrens T.E.J., Berg H.J., Jbabdi S., Rushworth M.F.S., Woolrich M.W. Probabilistic diffusion tractography with multiple fibre orientations: what can we gain? NeuroImage. 2007;34(1):144–155. doi: 10.1016/j.neuroimage.2006.09.018. [DOI] [PMC free article] [PubMed] [Google Scholar]
- Benes F.M., Berretta S. GABAergic interneurons: implications for understanding schizophrenia and bipolar disorder. Neuropsychopharmacology. 2001;25(1):1–27. doi: 10.1016/S0893-133X(01)00225-1. [DOI] [PubMed] [Google Scholar]
- Bernstein H.G., Steiner J., Guest P.C., Dobrowolny H., Bogerts B. Glial cells as key players in schizophrenia pathology: recent insights and concepts of therapy. Schizophr. Res. 2015;161(1):4–18. doi: 10.1016/j.schres.2014.03.035. [DOI] [PubMed] [Google Scholar]
- Canu E., Agosta F., Filippi M. A selective review of structural connectivity abnormalities of schizophrenic patients at different stages of the disease. Schizophr. Res. 2014;161(1):19–28. doi: 10.1016/j.schres.2014.05.020. [DOI] [PubMed] [Google Scholar]
- Connor C.M., Crawford B.C., Akbarian S. White matter neuron alterations in schizophrenia and related disorders. Int. J. Dev. Neurosci. 2011;29(3):325–334. doi: 10.1016/j.ijdevneu.2010.07.236. [DOI] [PMC free article] [PubMed] [Google Scholar]
- Cropley V.L., Klauser P., Lenroot R.K., Bruggemann J., Sundram S., Bousman C.…Zalesky A. Accelerated gray and white matter deterioration with age in schizophrenia. Am. J. Psychiatry. 2016 doi: 10.1176/appi.ajp.2016.16050610. [DOI] [PubMed] [Google Scholar]
- Dhollander T., Raffelt D., Connelly A. ISMRM Workshop on Breaking the Barriers of Diffusion MRI. 2016. Unsupervised 3-tissue response function estimation from single-shell or multi-shell diffusion MR data without a co-registered T1 image; pp. 1–2. (September) [Google Scholar]
- Ellison-Wright I., Bullmore E. Meta-analysis of diffusion tensor imaging studies in schizophrenia. Schizophr. Res. 2009;108(1–3):3–10. doi: 10.1016/j.schres.2008.11.021. [DOI] [PubMed] [Google Scholar]
- First M., Spitzer R.L., Gibbon M., Williams B., Williams J.B.W. Patient Edition. Biometrics Research Department, New York State Psychiatric Institute; New York: 1995. Structured Clinical Interview for DSM-IV Axis I Disorders. [Google Scholar]
- Francis A.N., Mothi S.S., Mathew I.T., Tandon N., Clementz B., Pearlson G.D.…Keshavan M.S. Callosal abnormalities across the psychosis dimension: bipolar schizophrenia network on intermediate phenotypes. Biol. Psychiatry. 2016;80(8):627–635. doi: 10.1016/j.biopsych.2015.12.026. [DOI] [PMC free article] [PubMed] [Google Scholar]
- Gajamange S., Raffelt D., Dhollander T., Lui E., van der Walt A., Kilpatrick T.…Kolbe S. Fibre-specific white matter changes in multiple sclerosis patients with optic neuritis. NeuroImage Clin. 2017;17(September 2017):60–68. doi: 10.1016/j.nicl.2017.09.027. [DOI] [PMC free article] [PubMed] [Google Scholar]
- Highley J.R., Esiri M.M., McDonald B., Cortina-Borja M., Herron B.M., Crow T.J. The size and fibre composition of the corpus callosum with respect to gender and schizophrenia: a post-mortem study. Brain. 1999;122(1):99–110. doi: 10.1093/brain/122.1.99. [DOI] [PubMed] [Google Scholar]
- Jbabdi S., Behrens T.E.J., Smith S.M. Crossing fibres in tract-based spatial statistics. NeuroImage. 2010;49(1):249–256. doi: 10.1016/j.neuroimage.2009.08.039. [DOI] [PubMed] [Google Scholar]
- Jeurissen B., Leemans A., Tournier J.D., Jones D.K., Sijbers J. Investigating the prevalence of complex fiber configurations in white matter tissue with diffusion magnetic resonance imaging. Hum. Brain Mapp. 2013;34(11):2747–2766. doi: 10.1002/hbm.22099. [DOI] [PMC free article] [PubMed] [Google Scholar]
- Jeurissen B., Tournier J., Dhollander T., Connelly A., Sijbers J. Multi-tissue constrained spherical deconvolution for improved analysis of multi-shell diffusion MRI data. NeuroImage. 2014;103:411–426. doi: 10.1016/j.neuroimage.2014.07.061. [DOI] [PubMed] [Google Scholar]
- Mulert C., Kirsch V., Whitford T.J., Alvarado J., Pelavin P., McCarley R.W.…Shenton M.E. Hearing voices: a role of interhemispheric auditory connectivity? World J. Biol. Psychiatry. 2012;13(2):153–158. doi: 10.3109/15622975.2011.570789. [DOI] [PMC free article] [PubMed] [Google Scholar]
- Pasternak O., Westin C.-F., Bouix S., Seidman L.J., Goldstein J.M., Woo T.-U.W.…Kubicki M. Excessive extracellular volume reveals a neurodegenerative pattern in schizophrenia onset. J. Neurosci. 2012;32(48):17365–17372. doi: 10.1523/JNEUROSCI.2904-12.2012. [DOI] [PMC free article] [PubMed] [Google Scholar]
- Peters A., Sethares C. Aging and the myelinated fibers in prefrontal cortex and corpus callosum of the monkey. J. Comp. Neurol. 2002;442(3):277–291. doi: 10.1002/cne.10099. [DOI] [PubMed] [Google Scholar]
- Pettersson-Yeo W., Allen P., Benetti S., McGuire P., Mechelli A. Dysconnectivity in schizophrenia: where are we now? Neurosci. Biobehav. Rev. 2011;35(5):1110–1124. doi: 10.1016/j.neubiorev.2010.11.004. [DOI] [PubMed] [Google Scholar]
- R Core Team . R Foundation for Statistical Computing; Vienna, Austria: 2016. R: A Language and Environment for Statistical Computing. [Google Scholar]
- Rae C.L., Davies G., Garfinkel S.N., Gabel M.C., Dowell N.G., Cercignani M.…Critchley H.D. Deficits in neurite density underlie white matter structure abnormalities in first-episode psychosis. Biol. Psychiatry. 2017 doi: 10.1016/j.biopsych.2017.02.008. [DOI] [PubMed] [Google Scholar]
- Raffelt D.A., Smith R.E., Ridgway G.R., Tournier J.D., Vaughan D.N., Rose S.…Connelly A. Connectivity-based fixel enhancement: whole-brain statistical analysis of diffusion MRI measures in the presence of crossing fibres. NeuroImage. 2015;117:40–55. doi: 10.1016/j.neuroimage.2015.05.039. [DOI] [PMC free article] [PubMed] [Google Scholar]
- Raffelt D.A., Tournier J.-D., Smith R.E., Vaughan D.N., Jackson G., Ridgway G.R., Connelly A. Investigating white matter fibre density and morphology using Fixel-based analysis. NeuroImage. 2016 doi: 10.1016/j.neuroimage.2016.09.029. [DOI] [PMC free article] [PubMed] [Google Scholar]
- Riffert T.W., Schreiber J., Anwander A., Knösche T.R. Beyond fractional anisotropy: extraction of bundle-specific structural metrics from crossing fiber models. NeuroImage. 2014;100:176–191. doi: 10.1016/j.neuroimage.2014.06.015. [DOI] [PubMed] [Google Scholar]
- Roalf D.R., Quarmley M., Elliott M.A., Satterthwaite T.D., Vandekar S.N., Ruparel K.…Gur R.E. The impact of quality assurance assessment on diffusion tensor imaging outcomes in a large-scale population-based cohort. NeuroImage. 2016;125:903–919. doi: 10.1016/j.neuroimage.2015.10.068. [DOI] [PMC free article] [PubMed] [Google Scholar]
- Samartzis L., Dima D., Fusar-Poli P., Kyriakopoulos M. White matter alterations in early stages of schizophrenia: a systematic review of diffusion tensor imaging studies. J. Neuroimaging. 2013:1–10. doi: 10.1111/j.1552-6569.2012.00779.x. [DOI] [PubMed] [Google Scholar]
- Sandell J.H., Peters A. Effects of age on the glial cells in the rhesus monkey optic nerve. J. Comp. Neurol. 2002;445(1):13–28. doi: 10.1002/cne.10162. [DOI] [PubMed] [Google Scholar]
- Schwehm A., Robinson D.G., Gallego J.A., Karlsgodt K.H., Ikuta T., Peters B.D.…Szeszko P.R. Age and sex effects on white matter tracts in psychosis from adolescence through middle adulthood. Neuropsychopharmacology. 2016;41(10):2473–2480. doi: 10.1038/npp.2016.47. [DOI] [PMC free article] [PubMed] [Google Scholar]
- Smith S.M., Nichols T.E. Threshold-free cluster enhancement: addressing problems of smoothing, threshold dependence and localisation in cluster inference. NeuroImage. 2009;44(1):83–98. doi: 10.1016/j.neuroimage.2008.03.061. [DOI] [PubMed] [Google Scholar]
- Smith S.M., Jenkinson M., Johansen-Berg H., Rueckert D., Nichols T.E., Mackay C.E., Behrens …., J T.E. Tract-based spatial statistics: Voxelwise analysis of multi-subject diffusion data. NeuroImage. 2006;31(4):1487–1505. doi: 10.1016/j.neuroimage.2006.02.024. [DOI] [PubMed] [Google Scholar]
- Smith R.E., Tournier J.D., Calamante F., Connelly A. SIFT: spherical-deconvolution informed filtering of tractograms. NeuroImage. 2013;67:298–312. doi: 10.1016/j.neuroimage.2012.11.049. [DOI] [PubMed] [Google Scholar]
- Tournier J., Mori S., Leemans A. Diffusion tensor imaging and beyond. Magn. Reson. Med. 2011;65(6):1532–1556. doi: 10.1002/mrm.22924. [DOI] [PMC free article] [PubMed] [Google Scholar]
- Uranova N.A., Vostrikov V.M., Orlovskaya D.D., Rachmanova V.I. Oligodendroglial density in the prefrontal cortex in schizophrenia and mood disorders: a study from the Stanley Neuropathology Consortium. Schizophr. Res. 2004;67(2–3):269–275. doi: 10.1016/S0920-9964(03)00181-6. [DOI] [PubMed] [Google Scholar]
- Veraart J., Novikov D.S., Christiaens D., Ades-aron B., Sijbers J., Fieremans E. Denoising of diffusion MRI using random matrix theory. NeuroImage. 2016;142:394–406. doi: 10.1016/j.neuroimage.2016.08.016. [DOI] [PMC free article] [PubMed] [Google Scholar]
- Vikhreva O.V., Rakhmanova V.I., Orlovskaya D.D., Uranova N.A. Ultrastructural alterations of oligodendrocytes in prefrontal white matter in schizophrenia: a post-mortem morphometric study. Schizophr. Res. 2016;177(1–3):28–36. doi: 10.1016/j.schres.2016.04.023. [DOI] [PubMed] [Google Scholar]
- Wakana S., Jiang H., Nagae-Poetscher L.M., van Zijl P.C.M., Mori S. Fiber tract-based atlas of human white matter anatomy. Radiology. 2004;230:77–87. doi: 10.1148/radiol.2301021640. [DOI] [PubMed] [Google Scholar]
- Westlye L.T., Walhovd K.B., Dale A.M., Bjørnerud A., Due-Tønnessen P., Engvig A.…Fjell A.M. Life-span changes of the human brain white matter: diffusion tensor imaging (DTI) and volumetry. Cereb. Cortex. 2010;20(9):2055–2068. doi: 10.1093/cercor/bhp280. [DOI] [PubMed] [Google Scholar]
- Wilkins B., Lee N., Gajawelli N., Law M., Leporé N. Fiber estimation and tractography in diffusion MRI: development of simulated brain images and comparison of multi-fiber analysis methods at clinical b-values. NeuroImage. 2015;109:341–356. doi: 10.1016/j.neuroimage.2014.12.060. [DOI] [PMC free article] [PubMed] [Google Scholar]
- Yeatman J.D., Wandell B.A., Mezer A.A. Lifespan maturation and degeneration of human brain white matter. Nat. Commun. 2014;5:4932. doi: 10.1038/ncomms5932. [DOI] [PMC free article] [PubMed] [Google Scholar]
Associated Data
This section collects any data citations, data availability statements, or supplementary materials included in this article.
Supplementary Materials
Supplementary material 1
MRtrix3 Fiber Density Results in MNI space.
FSL FA Results in MNI space.
MRtrix3 FA Results in MNI space.