

Abstract
Background
To measure rates of parental-report of allergic disorders and ED presentations for allergic disorders in children, and to describe factors associated with either.
Methods
An existing cohort of 3404 children born between 2006 and 2011 (Environments for Healthy Living) with prospectively collected pre-natal, perinatal and follow-up data were linked to i) nationwide Medicare and pharmaceutical data and ii) Emergency Department (ED) data from four hospitals in Australia. Parental-reported allergy was assessed in those who returned follow-up questionnaires. ED presentation was defined as any presentation for a suite of allergic disorders, excluding asthma. Univariate analysis and multivariate logistic regression were used to descibe risk factors for both parental-reported allergy and ED presentation for an allergic disorder.
Results
The incidence of parental-reported child allergy at 1, 3 and 5 years of age was 7.8, 7.8 and 12.6%, respectively. Independent predictors of parental-report of allergy in multivariate analysis were parental-report of asthma (OR 2.2, 95% CI 1.4–3.4) or eczema (OR 4.3, 95% CI 3.1–6.1) and age > 6 months at introduction of solids (OR 1.3, 95% CI 1.0–1.7). Factors associated with ED presentations for allergy, which occurred in 3.6% of the cohort, were presence of maternal asthma (OR 2.3 95% CI:1.1, 4.9) and child born in spring (OR 1.7, 95% CI 1.1, 2.7).
Conclusions
More than 10% of children up to 5 years have a parental-reported allergic disorder, and 3.6% presented to ED. Parental-report of eczema and/or asthma and late introduction of solids were predictors of parental-report of allergy. Spring birth and maternal asthma were predictors for ED presentation for allergy.
Electronic supplementary material
The online version of this article (10.1186/s12887-018-1148-1) contains supplementary material, which is available to authorized users.
Keywords: Allergy, Anaphylaxis, Birth cohort, Emergency department, Longitudinal study
Background
Allergic disorders are common and increasing, especially in children [1]. Allergic disorders consist of a wide spectrum of conditions, including rashes, atopic eczema, and most worryingly anaphylaxis. They represent an immune response to allergens, which are environmental substances that are normally considered harmless [2].
Common known triggers for allergic diseases and/or anaphylaxis include insect stings (especially from the Hymenoptera family of wasps, bees and ants), drugs (especially β-lactam antibiotics), and food (especially nuts, eggs, fish, shellfish and milk) [3]. Allergies seem to be more common in children than in adults, with food allergy prevalence reported between 7 and 10% in children [1].
The cause of the apparent increase in allergic disorders is unclear. Studies on risk factors for the development of allergic disorders have led to a number of meta-analyses of prospective cohort studies [1, 4]. From review articles [5–7] a common emerging theme is that allergic disorders are caused by a complex interrelationship between genetics, environment, and exposures both in-utero and during early infancy [5, 8]. We outline a summary of the literature on risk factors in Additional file 1.
Despite the noted high prevalence of allergic disorders in the community and the mild nature of the majority of allergic disorders, they can occasionally be more severe and anaphylactic reactions can be life-threatening. There are limited data available characterizing patients who present to the Emergency Department (ED) with allergic conditions. One French study [9] reported that allergic disorders represented 1% of all ED presentations, but was conducted nearly 20 years ago and did not report on children less than 10 years of age.
The overall aim of this study was to describe contemporaneous data for allergy presentations to the ED in the first years of life and to provide further understanding of (modifiable) associated risk factors. This study aims to measure the rates of, and describe factors associated with; 1) parental-report of allergy in children, and 2) ED presentations with allergic disorders in children in the first 5 years of life.
Methods
Study design
This study links data on children enrolled in a prospective birth cohort (Environments for Healthy Living [EFHL]: Griffith Birth Cohort study [10], registered Australian and New Zealand Clinical Trials Registry ACTRN12610000931077) to data from i) the Emergency Department Information System (EDIS) of four public hospitals, ii) the nationwide Medicare Benefit Scheme (MBS) and iii) the Pharmaceutical Benefits Scheme (PBS).
Setting
From 2006 to 2011 inclusive, pregnant women from 24 weeks gestation who attended one of the only three public hospitals in the area with a birthing service were enrolled in the EFHL cohort [10]. This area services a population of approximately 800,000 people. A fourth new public hospital ED opened in the area in September 2007. ED data were available for EFHL children for the period from November 2006 to December 2013.
EFHL data
The EFHL dataset included maternal, pregnancy/child, and household data and was collected by self-completed questionnaires by the primary caregiver at enrolment and when their child reached 12 months, 3 and 5 years of age. The baseline survey consisted of 48 self-report items including maternal, household and demographic factors during pregnancy [11]. Parents also provided consent at the time of enrolment to access additional gestational and birth information from hospital perinatal records after the delivery, hospital data and emergency department data.
Study subjects, outcome definition and comparison groups
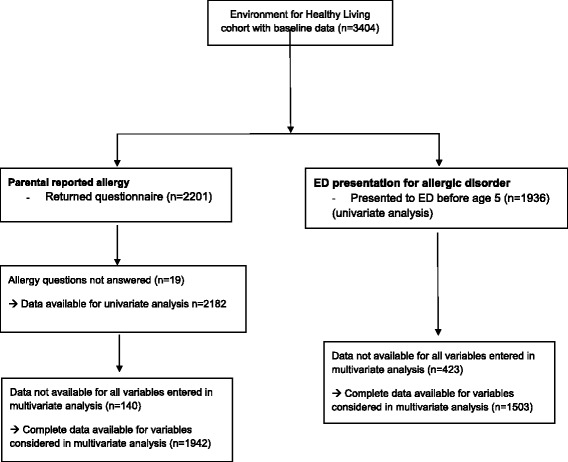
Study subjects were children born to mothers enrolled in the EFHL study. The primary outcomes of interest included the rate of parental-reported allergic disorders as obtained through questionnaires returned at 1, 3 and 5 years (Table 1), and the rate of ED presentations with an ICD-10 code of allergy or allergic disorder (Fig. 1). Asthma was not included as an allergic disorder. We included ‘rash’, as an allergic disorder, although other etiologies could be the cause of this diagnosis. As such (sensitivity) analyses were conducted for ED diagnoses of allergy with and without ‘rash’ included. Mothers or primary caregivers completed the surveys and are hereafter grouped as parents for ease of reporting. The one-year questionnaire data was included as source data for potential risk factors (e.g. breast feeding or introduction of solids) for the parental-report of allergy analysis, comparing risk factors amongst children with and without a parental-reported allergy. For the ED presentation analysis, baseline questionnaire data were used to identify risk factors for children with an ED presentation for allergy, compared to children with other ED presentations. For both parental-report and ED presentation analyses, PBS data were utilized. Table 2 summarises the available subjects for both parental-reported allergy analysis and ED presentation analysis.
Table 1.
Enrolment into the EFHL cohort study, questionnaire response rates, and consent to Pharmaceutical Benefits Scheme (PBS) linkage
| Cohort year | 2006 | 2007 | 2008 | 2009 | 2010 | 2011 | Total |
|---|---|---|---|---|---|---|---|
| Live births | n = 631 | n = 477 | n = 456 | n = 628 | n = 715 | n = 497 | n = 3404 |
| Questionnaire returned at: | |||||||
| 12 months | 507 (80.3%) | 354 (74.2%) | 308 (67.5%) | 404 (64.3%) | 398 (55.8%) | 230 (46.3%) | 2201 (64.7%) |
| 3 years | 391 (62.0%) | 279 (58.5%) | 230 (50.4%) | 317 (50.5%) | 348 (48.8%) | 1565 (46.0%) | |
| 5 years | 271 (42.9%) | 196 (41.1%) | 181 (39.7%) | 648 (19.0%) | |||
| Consent given to PBS linkage | |||||||
| 352 (55.8%) | 272 (57.0%) | 292 (64.0%) | 385 (61.3%) | 391 (54.8%) | 220 (44.3%) | 1912 (56.2%) | |
EFHL Environments for Healthy Living
Fig. 1.
ICD-10 codes included in the definition of allergy
Table 2.
Samples used for analysis of i) self-reported allergy and ii) ED presentation with allergic disorder
| ICD-10 | Description |
|---|---|
| J30.1 | Hay fever or allergic rhinitis due to pollen |
| J30.4 | Allergic rhinitis, unspecified |
| J45.0 | Allergic rhinitis with asthma or predominantly allergic asthma |
| J67a | Allergic alveolitis and pneumonitis due to inhaled organic dust and particles of fungal, actinomycetic or other origin |
| K52.2a | Allergic gastroenteritis and colitis |
| L20.0a | Atopic dermatitis |
| L20.8a | Atopic dermatitis |
| L20.9 | Atopic dermatitis |
| L23.0 | Allergic contact dermatitis due to metals |
| L23.9 | Allergic contact dermatitis unspecified |
| L50.0 | Allergic urticaria |
| L50.9 | Urticaria, unspecified |
| R21 | Rash and other nonspecific eruptions |
| T78.0a | Anaphylactic shock due to adverse food reaction |
| T78.2 | Anaphylactic shock, unspecified |
| T78.4 | Allergy, NOS |
| T80.5a | Anaphylactic shock due to serum |
| T88.1 | Rash following immunization |
| T88.6a | Anaphylactic shock due to medication properly administered |
| T88.7 | Allergic reaction to medicine properly administered |
aAlthough these ICD-10 codes were eligible for inclusion, there were no cases of children in this study with these codes. ICD-10: International Classification of Disease (tenth edition)
Administrative data sources
Table 1 summarizes enrolment and consent timeframes for relevant data sets in this study. The following administrative databases were linked to the EFHL data:
EDIS data
Routinely collected state-wide data from EDIS were extracted from the four public hospitals. This included baseline variables (such as hospital name), ED process variables (i.e. triage category, discharge destination) and clinical variables (i.e. primary presenting complaint and ICD-10 diagnostic codes). The triage scale used in Australia is the Australasian Triage Scale (ATS), a five-tiered scale that categorizes presentations by urgency, from 1 (immediate review and treatment required) to 5 (treatment/review required within 120 min) [12].
Linkage between EFHL participants and EDIS datasets used a unique identifier and was completed by personnel at the Health Statistics Branch of the Queensland Department of Health, and by the Health Economics and Casemix Unit, Northern NSW Local Health District.
MBS and PBS data
Over half of parents (56%) provided consent to access the Australian government databases of MBS and PBS. Linkage between EFHL and PBS was enabled using participant Medicare numbers. Linkage to our unique study identifier (ChildID), including manual matching and cleaning of conflicts was completed by Medicare Australia. Only prescriptions supplied prior to presentation date or follow-up time point (1 yr., 3 yr., 5 yr) were counted when comparing medication usage between children with and without allergy.
Statistical analysis
EFHL data was managed with Stata 12.1. Data analyses were undertaken using R [13]. Chi-square tests were used to compare associations between parental-reported allergy and potential risk factors. The presentation rate to ED of children with allergic disorders was calculated based on the whole EFHL cohort (n = 3404, Table 1). A p-value of < 0.05 was considered statistically significant. Prevalence rates and 95% confidence intervals were computed using the Mid-p exact test for person-time rates. Person-years (PYs) for prevalence rates of parental-report allergy were calculated by adding the number of years each child had contributed to the study. Person-years for the prevalence of presentation to ED with allergy was calculated for each child based on the last date of ED data available (31 December 2013) minus the child’s date of birth, and summed across the cohort. Logistic regression analyses were conducted to identify variables independently associated with parental report of allergy as well as ED diagnosis of allergy (including and excluding ‘rash’). For the parental report model, variables significant at a p < 0.10 level in the univariate analysis and with complete data on at least 90% of children were considered in a forward stepwise conditional regression model with entry and exit criteria of p < 0.10. The same regression technique was used for models determining variables associated with ED presentation for allergy (including and excluding “rash” lead to two separate models). However, because some of the key univariate predictors had > 10% missing data for this model, various models were built on the full sample as well as for subsets with complete data on key variables found to be significant in univariate analysis. Interactions between variables were assessed; significant interactions (p < .05) were accounted for in all models. In determining the best model, the number of records, the strength of the associations, the persistence of covariates across models, and the Negelkerke’s R square value were considered.
Ethics approval
The Human Research Ethics Committees of both the participating health service districts, and Griffith University approved this study, including linkage of data. For each participant written informed consent was obtained (from the parent or primary caregiver) for completion of a maternal baseline survey, the release of hospital perinatal data related to the birth of their child and linkage of their child’s inpatient state hospital records.
Results
Parental-report of allergy in children
Of the 3404 children in EFHL, questionnaire data for at least one time point were available for 2452 unique children (72%), including 2201 children with available one-year data (Table 1). The allergy questions were answered for 2182 children at 1 year, and for 1213 and 627 children at 3 and 5 years, respectively (Table 1). Allergy at any time in the child’s life was reported in 7.8% of children at 1 year, in 7.8% of children at 3 years, and in 12.6% of children with 5 years follow-up (Table 3). By 5 years of age, 255 children had an allergy as reported by their parent, representing 10.4% of the starting cohort of children who returned at least one questionnaire.
Table 3.
Proportion of children with a parental-report of allergy by age attained, and cumulative prevalence rate of children with parental report of allergy per 1000 person-years
| 12 months | 3 years | 5 years | ||||
|---|---|---|---|---|---|---|
| n = 2182 | n = 1213 | n = 627 | ||||
| Person-years =2182 | Person-years =4608 | Person-years =5862 | ||||
| n | (%) | n | % | n | % | |
| Parental reported allergy | ||||||
| Yes | 171 | 7.8% | 93 | 7.8% | 56 | 12.6% |
| No | 2011 | 92.2% | 1115 | 92.3% | 388 | 87.4% |
| Cumulative number of unique children with allergy | 171 | 227 | 255 | |||
| Cumulative prevalence rate per 1000 person-years [95% CI] | 78.4 [67.3, 90.8] | 49.3 [43.2, 56.0] | 43.5 [38.4, 49.1] | |||
CI confidence interval
Table 4 describes univariate analysis of parental report of allergy by duration of follow up and potential risk factors in proportions and person-years, respectively.
Table 4.
Parental-report of allergy by child’s age at follow-up and for all ages combined, and potential risk factors
| Age at follow-up | ||||||||||||
|---|---|---|---|---|---|---|---|---|---|---|---|---|
| Characteristic | 12 months (n = 2182) | 3 years (n = 1213) | 5 years (n = 627) | All ages combined | ||||||||
| Total N | n with allergy | % with allergy | Total N | n with allergy | % with allergy | Total N | n with allergy | % with allergy | Total person-years | Rate ratio | RR [95% CI] | |
| Gender | ||||||||||||
| Male | 1094 | 93 | 8.5% | 571 | 56 | 9.8%* | 211 | 36 | 17.1%** | 2658 | 69.6 | 1.4 [1.2,1.8] |
| Female | 1028 | 74 | 7.2% | 607 | 37 | 6.1% | 226 | 19 | 8.4% | 2693 | 48.3 | 1.0 (Reference) |
| Maternal Indigenous status | ||||||||||||
| Not indigenous | 2065 | 159 | 7.7% | 1177 | 93 | 7.9% | 433 | 55 | 12.7% | 5286 | 58.1 | 1.0 (Reference) |
| ATSI | 29 | 4 | 13.8% | 0 | 0 | 0.0% | 0 | 0 | 0.0% | 29 | 138.0 | 1.8 [0.6, 4.7] |
| Birthweight | ||||||||||||
| < 2500 g | 59 | 7 | 11.8% | 33 | 3 | 9.1% | 0 | 0 | 0.0% | 125 | 79.8 | 1.3 [0.7, 2.5] |
| ≥ 2500 g | 1905 | 160 | 8.4% | 1154 | 90 | 7.8% | 426 | 55 | 12.9% | 4212 | 59.3 | 1.0 (Reference) |
| Season of birth | ||||||||||||
| Summer/Spring | 1873 | 148 | 7.9% | 958 | 68 | 7.1% | 389 | 44 | 11.3% | 4568 | 56.9 | 1.0 (Reference) |
| Autumn/Winter | 301 | 22 | 7.3% | 240 | 25 | 10.4% | 56 | 12 | 21.4% | 894 | 66.0 | 1.2 [0.8, 1.5] |
| Maternal education | ||||||||||||
| Did not complete high school | 312 | 29 | 9.3% | 186 | 21 | 11.3% | 64 | 7 | 10.9% | 812 | 70.2 | 1.2 [0.9, 1.6] |
| Completed high school | 1679 | 141 | 8.4% | 1000 | 72 | 7.2% | 380 | 49 | 12.9% | 4438 | 59.0 | 1.0 (Reference) |
| Household income (annual) | ||||||||||||
| < $40,000 | 347 | 26 | 7.5% | 175 | 11 | 6.3% | 60 | 11 | 18.3% | 816 | 58.8 | 0.8 [0.7, 1.1] |
| $40,000 - $70,000 | 635 | 47 | 7.4% | 357 | 25 | 7.0% | 144 | 15 | 10.4% | 1638 | 53.1 | |
| ≥ $70,000 | 906 | 77 | 8.5% | 511 | 47 | 9.2% | 188 | 24 | 12.8% | 2303 | 64.3 | 1.0 (Reference) |
| Other children living in household | ||||||||||||
| 0 | 973 | 72 | 7.4% | 492 | 32 | 6.5% | 176 | 25 | 14.2% | 2310 | 55.9 | 1.0 (Reference: 0–2) |
| 1–2 | 734 | 47 | 6.4% | 418 | 33 | 7.9% | 167 | 18 | 10.8% | 1903 | 51.5 | |
| 3 or more | 532 | 50 | 9.4% | 276 | 27 | 9.8% | 95 | 13 | 13.7% | 1273 | 70.7 | 1.3 [1.0, 1.7] |
| Child care attendance (in first year of life) | ||||||||||||
| Yes | 571 | 52 | 9.1% | 816 | 62 | 7.6% | Not applicable | 2203 | 51.7 | 1.0 (Reference) | ||
| No | 1575 | 115 | 7.3% | 380 | 30 | 7.9% | 2335 | 62.1 | 1.2 [0.9, 1.5] | |||
| Breast feeding before discharged newborn | ||||||||||||
| Yes | 1072 | 89 | 8.3% | 524 | 33 | 6.3% | 204 | 23 | 11.3% | 2527 | 57.4 | 1.2 [0.7, 2.1] |
| N0 | 106 | 5 | 4.7% | 51 | 5 | 9.8% | 30 | 3 | 10.0% | 268 | 48.4 | 1.0 (Reference) |
| Not asked | 935 | 72 | 7.7% | 604 | 55 | 9.1% | 200 | 29 | 14.5% | 2544 | 61.3 | Not included |
| Ever breast-fed by 12 months of age | ||||||||||||
| Yes | 2025 | 160 | 7.9% | 1053 | 80 | 7.6% | 408 | 53 | 13.0% | 4946 | 59.2 | 1.1 [0.6, 1.9] |
| No | 132 | 9 | 6.8% | 63 | 5 | 7.9% | 0 | 0 | 0.0% | 259 | 54.1 | 1.0 (Reference) |
| Breastfeeding duration | ||||||||||||
| 0–3 months | 720 | 59 | 8.2% | 361 | 26 | 7.2% | 138 | 17 | 12.3% | 1718 | 59.4 | 1.0 (Reference all < 6 months) |
| 3–6 months | 388 | 31 | 8.0% | 196 | 9 | 4.6% | 77 | 9 | 11.7% | 933 | 52.5 | |
| > 6 months | 500 | 36 | 7.2% | 276 | 27 | 9.8% | 105 | 19 | 18.1% | 1261 | 65.0 | 1.1 [0.9, 1.5] |
| Age at first consumption of solids | ||||||||||||
| 0–3 months | 286 | 24 | 8.4% | 143 | 5 | 3.5% | 48 | 5 | 10.4% | 668 | 50.9 | 1.0 (Reference all < 6 months) |
| 3–6 months | 1759 | 139 | 7.9% | 916 | 76 | 8.3% | 350 | 42 | 12.0% | 4291 | 59.9 | |
| > 6 months | 92 | 7 | 7.6% | 55 | 5 | 9.1% | 26 | 6 | 23.1% | 254 | 70.9 | 1.2 [0.8, 1.9] |
| Smoking during pregnancy | ||||||||||||
| Yes | 423 | 41 | 9.7% | 247 | 19 | 7.7% | 89 | 5 | 5.6%* | 1095 | 59.4 | 1.0 [0.8, 1.3] |
| No | 1743 | 129 | 7.4% | 949 | 74 | 7.8% | 355 | 50 | 14.1% | 4350 | 58.2 | 1.0 (Reference) |
| Use of antibiotics (in first year of life) | ||||||||||||
| None | 335 | 69 | 20.6%** | 232 | 44 | 19%*** | 41 | 7 | 17.1% | 880 | 136.4 | 2.3 [1.6, 3.2]a |
| 1–4 prescriptions | 226 | 21 | 9.3% | 167 | 12 | 7.2% | 47 | 7 | 14.9% | 653 | 61.2 | 4.2 [2.3, 8.4]b |
| 5+ prescriptions | 34 | 4 | 11.7% | 128 | 5 | 3.9% | 7 | 1 | 13.9% | 305 | 32.8 | |
ATSI Aboriginal or Torres Strait Islander, CI Confidence Interval
aReference group for nil prescriptions vs. 1–4
bReference group for nil prescriptions vs. 5 +
* p < .05; **p < .01; ***p < .001, Reference = reference group
Parents of male children were more likely to report allergy in their children at 3 and 5 years (Table 4). The cumulative prevalence of allergy for boys over the period was 1.4 times higher than that for girls (Risk Ratio [RR] 1.4 [95% CI 1.2,1.8], Table 4).
Children with three or more other children in the household had a higher risk of allergy compared to children with 0–2 other children in the household (RR = 1.3 [1.0, 1.7], Table 4).
There appeared to be a trend towards lower parental-report of allergy in children who had solids introduced in the first 3 months of life compared to other children, most notable at the 3-year and 5 year time points (Table 4).
At 5 years, parents who were non-smokers during pregnancy reported more allergic disorders in their children than parents who smoked (14.1% vs. 5.6%; p = 0.03, Table 4). This finding did not persist when the cumulative rate was considered across all time points (Table 4).
The following (potential risk) factors were not significantly associated with parental-reported allergy in univariate analysis: season of birth, birthweight, maternal education level, household annual income, childcare attendance, breast feeding (ever, and duration), and passive smoking exposure (Table 4).
The logistic regression model considered data on 1942 children; 235 of these had an allergy reported at any time during follow-up. Variables considered in the model were: breast feeding at 12 months, aboriginal or Torres strait island ethnicity (ATSI), birth season, mother’s age, mother’s education status, other children at home (0,1–2 or 3+), smoking during pregnancy, mother’s place of birth, passive smoke exposure, gender, birthweight (< 2500 g and > =2500 g), gestational age (< 37 weeks vs 37+ weeks), age at first food (< 3 months, 3–6 months, 6+ months), child has asthma, child has eczema, and child care (ever) (data not shown). The interaction term of parental-report eczema and parental-report asthma was significant (p = 0.003), with a parental-report of asthma or eczema (+/− asthma) significantly associated with parental-report allergy. These variables were thus combined in the model as one variable according to the magnitude of their effect on self-report allergy, with a coding of neither (reference), parental-report of asthma (but no eczema), and parental-report of eczema (with or without asthma).
The following variables were univariately statistically significantly associated with parental-reported allergy: birthweight (continuous), age at first food, child has asthma, child has eczema, child care (ever). When combined with other potentially predictive variables, Table 5 shows the best model identified included the following significant variables: parental-report of asthma (adjusted Odds Ratio: aOR 2.2, 95% CI 1.4–3.4), parental-report of eczema (aOR 4.3, 95% CI 3.1–6.1) whether the child had attended childcare (aOR 1.4, 95% CI 1.1–1.9), and age of first solid intake > 6 months (aOR 1.3, 95% CI 1.0–1.7).
Table 5.
Logistic regression results: Variables significantly associated with parental report of allergy by 5 years of age in 1942 children from a birth cohort
| Variable | Total children (n) | Self-report allergy (%) | Crude odds ratio (95% CI) | P value | Adjusted odds ratio (95% CI) | P value |
|---|---|---|---|---|---|---|
| Child care status: | ||||||
| Attended childcare | 1283 | 12.9% | 1.4 (1.1, 1.8) | 0.017 | 1.4 (1.1, 1.9) | 0.019 |
| Did not attend childcare | 994 | 9.7% | 1.0a | 1.0a | ||
| Other self-report conditions: | ||||||
| Child has neither eczema nor asthma | 1742 | 8.8% | 1.0a | 1.0a | <.001 | |
| Child has asthma but no eczema | 176 | 16.5% | 2.0 (1.3, 3.1) | <.001 | 2.2 (1.4,3.4) | |
| Child has eczema (+/− asthma) | 248 | 28.6% | 4.1 (3.0, 5.7) | <.000 | 4.3 (3.1,6.1) | |
| Age (months) at first food | ||||||
| < 3 months | 68 | 7.4% | NA | 0.07b | 1.0ac | |
| Between 3 and 6 months | 1403 | 11.3% | 1.0ac | |||
| 6 months and older | 635 | 13.5% | 1.3 (1.0, 1.7)c | 0.05 | ||
aReference category
bchi-square for linear trend
c< 3 and 3–6 months combined as reference group
ED presentations with allergic disorders
There were a total of 5118 ED presentations in this cohort of children aged 0–5 years. Allergic disorders (not including asthma), accounted for 3.6% (182) of these presentations from 160 of the 3404 children in the cohort. The median ED length of stay was 1.9 h. Fifteen children (8.2%) were admitted to hospital; most were assigned an Australian Triage Scale (ATS) category 3 (59%) or 4 (23%), with 14% receiving a more urgent classification (ATS 2; 13% and ATS 1; 1.1%).
Over one-third of presentations (66 of 182) with allergic disorders occurred during the first year of life (Table 6). There were two presentations due to anaphylaxis yielding a prevalence of 0.59 per 1000 PYs for anaphylaxis in the first 5 years of life.
Table 6.
Number and cumulative prevalence rate of presentations to ED with an allergic disorder, by age group
| Allergic disorder - type | By 12 months, n | by 3 years, n | by 5 years, n |
|---|---|---|---|
| Rash | 36 | 62 | 70 |
| Allergic reaction, NOS | 6 | 27 | 40 |
| Urticaria, NOS | 8 | 24 | 30 |
| Adverse reaction to medication | 4 | 10 | 11 |
| Allergic contact dermatitis | 6 | 11 | 16 |
| Allergic rhinitis | 1 | 5 | 8 |
| Atopic dermatitis | 3 | 3 | 3 |
| Anaphylaxis | 1 | 1 | 2 |
| Other | 1 | 2 | 2 |
| Total presentations, n | 66 | 145 | 182 |
| Total person-years | 3404 | 9871 | 14,023 |
| Prevalence per 1000 person-years [95%CI] | 19.4 [15.1, 24.5] | 14.7 [12.4, 17.2] | 13.0 [11.2, 15.0] |
ED Emergency Department, CI Confidence Interval, NOS Not otherwise specified
By 12 months of age, 1.8%, of the cohort had presented to ED with an allergic disorder. There was a decreasing cumulative prevalence of allergy presentation to ED, from 19.4 per 1000 person-years to 13.0 per 1000 person years as the children grew older (Table 6). ED presentation with allergy by 1 year of age occurred at a quarter of the rate of parental report of allergy (19.4 per 1000 PY compared to 78.4 per 1000 PY, Tables 3 and 6).
Univariate analysis showed that children who presented to the ED with an allergy during the first 5 years of life were more likely to be born in spring and have a mother with asthma. (Table 7). These findings persisted in the multivariate analysis as shown in Table 8, with an adjusted odds ratio for ED presentation with allergy (including diagnosis of rash) of 1.7 [95% CI 1.1–2.7] and 2.3 [95% CI 1.1–4.9], respectively. The same variables were found to be independent predictors of similar magnitude if diagnoses of ‘rash’ were excluded (Table 9).
Table 7.
Characteristics of children presenting to ED in the first five years of life: children presenting with allergy compared to all other children presenting
| Characteristic | Child with allergy presentation (n = 160) | Child with other ED presentation (n = 1776) | ||
|---|---|---|---|---|
| n | % | n | % | |
| Gender | ||||
| Male | 83 | 52.9% | 948 | 54.2% |
| Female | 74 | 47.1% | 801 | 45.8% |
| Maternal Indigenous status | ||||
| Not indigenous | 151 | 98.1% | 1665 | 97.8% |
| ATSI | 3 | 1.9% | 37 | 2.2% |
| Birthweight | ||||
| < 2500 g | 3 | 1.9% | 43 | 2.5% |
| ≥ 2500 g | 155 | 98.1% | 1704 | 97.5% |
| Season of birth* | ||||
| Springa | 113 | 70.6% | 1064 | 59.9% |
| Summer | 13 | 8.1% | 267 | 15.0% |
| Autumn | 4 | 2.5% | 56 | 3.2% |
| Winter | 30 | 18.8% | 389 | 21.9% |
| Maternal education | ||||
| Did not complete high school | 41 | 25.6% | 376 | 21.2% |
| Completed high school | 119 | 74.4% | 1400 | 78.8% |
| Household income (annual) | ||||
| < $40,000 | 38 | 27.9% | 335 | 22.7% |
| $40,000 - $70,000 | 40 | 29.4% | 509 | 34.5% |
| > $70,000 | 58 | 42.6% | 632 | 42.8% |
| Mother’s country of birth | ||||
| Australia/ New Zealand | 99 | 61.9% | 1069 | 60.2% |
| Other | 61 | 38.1% | 707 | 39.8% |
| Other children living in household | ||||
| 0 | 37 | 35.9% | 463 | 41.4% |
| 1–2 | 59 | 57.3% | 564 | 50.4% |
| 3 or more | 7 | 6.8% | 91 | 8.1% |
| Mother has asthma* | ||||
| Yesb | 9 | 8.0% | 53 | 3.7% |
| No | 103 | 92.0% | 1365 | 96.3% |
| Child care attendance by 1 yr | ||||
| Yes | 30 | 27.3% | 318 | 27.0% |
| No | 80 | 72.7% | 861 | 73.0% |
| Child care attendance by 3 yrs | ||||
| Yes | 43 | 61.4% | 590 | 69.7% |
| No | 27 | 38.6% | 257 | 30.3% |
| Breast feeding before discharged newborn | ||||
| Yes | 87 | 54.4% | 1022 | 57.5% |
| No | 9 | 5.6% | 117 | 6.6% |
| Not asked | 64 | 40.0% | 637 | 35.9% |
| Breast feeding duration | ||||
| 0–3 months | 16 | 25.0% | 213 | 27.8% |
| 3–6 months | 16 | 25.0% | 185 | 24.1% |
| > 6 months | 32 | 50.0% | 369 | 48.1% |
| Age at first consumption of solids | ||||
| 0–3 months | 3 | 2.9% | 47 | 4.1% |
| 3–6 months | 70 | 68.6% | 754 | 65.9% |
| > 6 months | 29 | 28.4% | 344 | 30.0% |
| Smoking during pregnancy | ||||
| Yes | 44 | 27.8% | 460 | 26.0% |
| No | 114 | 72.2% | 1311 | 74.0% |
| Epi-pen prescribed | ||||
| none | 159 | 99.4% | 1768 | 99.5% |
| 1+ prescriptions | 1 | 0.6% | 8 | 0.5% |
| Use of corticosteroids | ||||
| none | 143 | 89.4% | 1586 | 89.3% |
| 1+ prescriptions | 17 | 10.6% | 190 | 10.7% |
| Use of antibiotics | ||||
| none | 149 | 92.6% | 1613 | 89.9% |
| 1+ prescriptions | 11 | 7.4% | 163 | 10.1% |
ED Emergency Department, ATSI Aboriginal or Torres Strait Islander
aRR (95% CI) for spring compared to all other seasons = 1.6 (1.1–2.2)
bRR (95% CI) for mother with asthma = 2.1 (1.1, 3.9)
*p < 0.05
Table 8.
Logistic regression results: Variables significantly associated with ED presentation with allergy (including rash) vs any other condition, by 5 years of age
| Variable | Total children (n) | Self-report allergy (%) | Crude odds ratio (95% CI) | P value | Adjusted odds ratio (95% CI) | P value |
|---|---|---|---|---|---|---|
| Season of birth | ||||||
| Spring | 1177 | 9.6% | 1.6 (1.1, 2.3) | 0.008 | 1.7 (1.1, 2.7) | 0.011 |
| Other season | 759 | 6.2% | 1.0† | 1.0a | ||
| Mother has asthma | ||||||
| Yes | 62 | 14.5% | 2.3 (1.1,4.7) | 0.026 | 2.3 (1.1,4.9) | 0.025 |
| No | 1468 | 7.0% | 1.0† | 1.0† | ||
aReference category
Table 9.
Logistic regression results. Variables significantly associated with ED presentation with allergy (excluding rash) vs any other condition, by 5 years of age
| Variable | Total children (n) | Self-report allergy (%) | Crude odds ratio (95% CI) | P value | Adjusted odds ratio (95% CI) | P value |
|---|---|---|---|---|---|---|
| Season of birth | ||||||
| Spring | 1131 | 5.9% | 1.7 (1.1, 2.7) | 0.02 | 2.2 (1.2, 4.0) | 0.011 |
| Other season | 738 | 3.5% | 1.0a | 1.0a | ||
| Mother has asthma | ||||||
| Yes | 59 | 10.2% | 2.9 (1.2,6.9) | 0.015 | 3.0 (1.2,7.3) | 0.016 |
| No | 1419 | 3.8% | 1.0a | 1.0a | ||
aReference category
There were no statistically significant differences in gender, mother’s socioeconomic status, the number of children living in the household, breastfeeding duration, or the age at introduction of solids for children presenting with an allergy compared to other ED presentations (Table 7).
Discussion
This study used prospectively collected antenatal, perinatal and follow-up data from an existing birth cohort to study allergic disorders children under the age of 5 years, including their presentations to ED.
Our study was consistent with the existing literature for several other known risk factors for allergy such as male gender [14], birth in spring [15], co-existent eczema and asthma as well as timing of introduction of solids. Consistent with others we also found no association with breast feeding, parental education or household income [16].
The introduction of solids or potentially allergenic foods has received increased attention recently. While earlier recommendations suggested delayed introduction or avoidance of dairy products, fish and nuts in high-risk infants [17, 18], two recent randomised controlled studies have provided convincing data that early introduction does not cause allergy and may even be protective [19, 20]. Our study was consistent with these latter studies, suggesting an increased risk of allergy with later commencement of solids (Table 5). By virtue of the design of our study, we cannot exclude that this association of delayed solid introduction and allergy could be an example of reverse causation, where families at higher risk introduced solid foods later.
The “Hygiene Hypothesis” [21] proposes that increased incidence in allergies are linked to reduced exposure to microorganisms. Exposure to other children [16, 22] as well as attending day-care [23], have been associated with decrease in allergic disorders. Our study considered these potential exposures, but did not find clear support for this hypothesis in univariate and multivariate modelling.
Parental-report of child allergies occurred at 4 times the level of ED presentation. This is likely explained by the chronic or recurrent nature of certain allergic disorders, such as eczema or atopic dermatitis, which may lead to parents to seek medical attention in the setting of a primary care physician (GP) or outpatient paediatrician, or possibly not seek care at all, rather than attend an ED.
Limitations
Not all parents consented to linkage with the PBS database and loss to follow-up occurred. As a result, the study may have been underpowered to find significant associations for known risk factors, although most point estimates findings were consistent with the existing literature. Also, due to the loss to follow-up, selection bias may have been introduced. Nevertheless, we have no reason to believe children with allergic disorders would have a different rate of loss to follow-up than others. We excluded asthma from our analysis, since our focus was on children between 0 and 5 years where diagnosis of asthma is challenging, due to their inability to provide reliable spirometry and the host of competing diagnoses such as bronchiolitis and reactive airway disease [24]. We acknowledge including asthma may have lead to different findings. ED diagnosis of allergy included patients with a diagnosis of ‘rash’, which accounted for half of the ED presentations in the first year of life for allergy and 40% of all presentations. We did not have approval to access patients’ individual medical record and are unable to comment on the exact etiology. A separate audit suggested more than half of these children have an allergic etiology. We conducted a sensitivity analysis by conducting logistic regression with and without patients with ‘rash’ and found a consistent result. As such we have decided to keep patients with rash in our descriptive analyses. We used ICD-10 coding for ED diagnosis which may have led to misclassification. For example, we noted very few cases of anaphylaxis, although our estimated incidence falls within previously reported ranges [25]. Furthermore, we cannot comment on the accuracy of parental report of allergy. Parental-report is considered a valid measurement for allergy, especially as a follow up measurement for a large cohort where patients are not routinely reviewed by a clinician [26].
Parental-report of allergy was unable to be further subdivided to examine specific drug or food associations. We had access to a detailed baseline database, but not all relevant possible predictors may have been included. Lastly, despite having access to multiple datasets, data entry and linkage may have been incomplete.
Conclusion
In this birth cohort from southeast Queensland, more than 10% of children in the frist 5 years of life had an allergic disorder reported, with 3.6% of the cohort presenting to an ED with an allergic disorder. Parental report of eczema and/or asthma as well as introduction of solids after 6 months of age were significantly associated with parental report of allergy. Spring birth and a mother with asthma were independent predictors for an ED presentation for allergy.
Additional file
Extension of background literature in allergy - Factors associated with allergic disorders. (DOC 178 kb)
Acknowledgements
The research reported in this publication is part of the Griffith Study of Population Health: Environments for Healthy Living (EFHL) (Australian and New Zealand Clinical Trials Registry: ACTRN12610000931077). Core funding to support EFHL is provided by Griffith University. The EFHL project was conceived by Professor Rod McClure, Dr. Cate Cameron, Professor Judy Searle, and Professor Ronan Lyons. We are thankful for the contributions of the Project Manager, and current and past Database Managers. We gratefully acknowledge the administrative staff, research staff, and the hospital antenatal and birth suite midwives of the participating hospitals for their valuable contributions to the study, in addition to the expert advice provided by Research Investigators throughout the project. We also would like to acknowledge Rania Shibl (database manager), Dr. Syed Fasihullah, (Pediatrician, Gold Coast University Hospital), Dr. Stuart Young (Director, Emergency department, Logan Hospital), Dr. Rob Davies (Director, Emergency department, The Tweed Hospital) and Dr. Jae Thone (Gold Coast University Hospital) for the support of this project.
Funding
This research was funded by a Queensland Emergency Medicine Research Foundation grant. This not for profit foundation had no role in methodology, design, data collection and analysis nor in the interpretation of data.Dr. Cameron was supported by a Public Health Fellowship (ID 428254) from the National Health and Medical Research Council.
Availability of data and materials
The datasets generated during and/or analysed during the current study are not publicly available due to specific restrictions from the ethics committee(s), but are available from the corresponding author on reasonable request.
Abbreviations
- ATS
Australian Triage Scale
- CI
Confidence Interval
- ED
Emergency Department
- EDIS
Emergency Department Information System
- EFHL
Environments for Healthy Living
- GP
General Practitioner (Family Doctor)
- ICD-10
International Classification of Disease – tenth edition
- MBS
Medicare Benefit Scheme
- NSW
New South Wales
- PBS
Pharmaceutical Benefit Scheme
- PY
Person year
- RR
Relative Risk
Authors’ contributions
GK: Design, ethics, funding, data interpretation, manuscript preparation, AS: Data analysis and manuscript preparation, JC: Design, ethics, funding, data interpretation, manuscript preparation, NG: Statistical analysis, manuscript review, CC: Design, funding, data interpretation, manuscript review, GM: Cohort data and data linkage manager, manuscript review, RS: Cohort project manager, design, funding, manuscript review, PS: Design, ethics, funding, data interpretation, manuscript preparation. All authors have read and approved the final manuscript.
Ethics approval and consent to participate
The Human Research Ethics Committees of the participating health service districts (HREC/06/QPAH/96,HREC/13/QPAH/8, HREC/06/GCH/52, NCAHS/HREC/358/N, Northern NSW LNR 057) and Griffith University approved this study (MED/16/06/HREC, MED/23/11/HREC), including linkage of data. For each participant written informed consent was obtained (from the parent or primary caregiver) for completion of a maternal baseline survey, the release of hospital perinatal data related to the birth of their child and linkage of their child’s inpatient state hospital records.
Competing interests
The authors declare they have no competing interests.
Publisher’s Note
Springer Nature remains neutral with regard to jurisdictional claims in published maps and institutional affiliations.
Footnotes
Electronic supplementary material
The online version of this article (10.1186/s12887-018-1148-1) contains supplementary material, which is available to authorized users.
Contributor Information
Gerben Keijzers, Phone: +61 7 5687 0000, Email: Gerben.Keijzers@health.qld.gov.au.
Amy Sweeny, Email: Amy.Sweeny@health.qld.gov.au.
Julia Crilly, Email: Julia.Crilly@health.qld.gov.au.
Norm Good, Email: Norm.Good@csiro.au.
Cate M. Cameron, Email: Cate.Cameron@health.qld.gov.au
Gabor Mihala, Email: G.Mihala@griffith.edu.au.
Rani Scott, Email: Rani.Scott@griffith.edu.au.
Paul A. Scuffham, Email: P.Scuffham@griffith.edu.au
References
- 1.Yang YW, Tsai CL, Lu CY. Exclusive breastfeeding and incident atopic dermatitis in childhood: a systematic review and meta-analysis of prospective cohort studies. Br J Dermatol. 2009;161:373–383. doi: 10.1111/j.1365-2133.2009.09049.x. [DOI] [PubMed] [Google Scholar]
- 2.Kay AB. Allergy and allergic diseases. First of two parts. N Engl J Med. 2001;344:30–37. doi: 10.1056/NEJM200101043440106. [DOI] [PubMed] [Google Scholar]
- 3.Melville N, Beattie T. Paediatric allergic reactions in the emergency department: a review. Emerg Med J. 2008;25:655–658. doi: 10.1136/emj.2007.054296. [DOI] [PubMed] [Google Scholar]
- 4.Koplin J, Allen K, Gurrin L, Osborne N, Tang ML, Dharmage S. Is caesarean delivery associated with sensitization to food allergens and IgE-mediated food allergy: a systematic review. Pediatr Allergy Immunol. 2008;19:682–687. doi: 10.1111/j.1399-3038.2008.00731.x. [DOI] [PubMed] [Google Scholar]
- 5.Sicherer SH, Leung DY. Advances in allergic skin disease, anaphylaxis, and hypersensitivity reactions to foods, drugs, and insects in 2014. J Allergy Clin Immunol. 2015;135:357–367. doi: 10.1016/j.jaci.2014.12.1906. [DOI] [PubMed] [Google Scholar]
- 6.Kuo CH, Kuo HF, Huang CH, Yang SN, Lee MS, Hung CH. Early life exposure to antibiotics and the risk of childhood allergic diseases: an update from the perspective of the hygiene hypothesis. J Microbiol Immunol Infect. 2013;46:320–9. [DOI] [PubMed]
- 7.Lack G. Update on risk factors for food allergy. J Allergy Clin Immunol. 2012;129:1187–1197. doi: 10.1016/j.jaci.2012.02.036. [DOI] [PubMed] [Google Scholar]
- 8.Campbell DE, Boyle RJ, Thornton CA, Prescott SL. Mechanisms of allergic disease–environmental and genetic determinants for the development of allergy. Clin Exp Allergy. 2015;45:844–858. doi: 10.1111/cea.12531. [DOI] [PubMed] [Google Scholar]
- 9.Bellou A, Manel J, Samman-Kaakaji H, et al. Spectrum of acute allergic diseases in an emergency department: an evaluation of one years’ experience. Emerg Med (Fremantle) 2003;15:341–347. doi: 10.1046/j.1442-2026.2003.00472.x. [DOI] [PubMed] [Google Scholar]
- 10.Cameron CM, Scuffham PA, Spinks A, et al. Environments for healthy living (EFHL) Griffith birth cohort study: background and methods. Matern Child Health J. 2012;16:1896–905. [DOI] [PubMed]
- 11.Cameron CM, Scuffham PA, Shibl R, et al. Environments for healthy living (EFHL) Griffith birth cohort study: characteristics of sample and profile of antenatal exposures. BMC Public Health. 2012;12:1–11. doi: 10.1186/1471-2458-12-1080. [DOI] [PMC free article] [PubMed] [Google Scholar]
- 12.Australasian College for Emergency Medicine. Policy on the Australasian triage scale. 4th ed; 2013. p. P06. Available from URL: https://acem.org.au/getmedia/484b39f1-7c99-427b-b46e-005b0cd6ac64/P06-Policy-on-the-ATS-Jul-13-v04.aspx. Last Accessed 15 May 2018.
- 13.R Development Core Team . R: A language and environment for statistical computing. Vienna: R Foundation for Statistical Computing; 2013. [Google Scholar]
- 14.Savage J, Johns CB. Food allergy: epidemiology and natural history. Immunol Allergy Clin N Am. 2015;35:45–59. doi: 10.1016/j.iac.2014.09.004. [DOI] [PMC free article] [PubMed] [Google Scholar]
- 15.Zeiger R, Heller S, Mellon M, Halsey J, Hamburger R, Sampson H. Genetic and environmental factors affecting the development of atopy through age 4 in children of atopic parents: a prospective randomized study of food allergen avoidance. Pediatr Allergy Immunol. 1992;3:110–127. doi: 10.1111/j.1399-3038.1992.tb00035.x. [DOI] [Google Scholar]
- 16.Schmitz R, Atzpodien K, Schlaud M. Prevalence and risk factors of atopic diseases in German children and adolescents. Pediatr Allergy Immunol. 2012;23:716–723. doi: 10.1111/j.1399-3038.2012.01342.x. [DOI] [PubMed] [Google Scholar]
- 17.American College of Allergy A, & Immunology Food allergy: a practice parameter. Ann Allergy Asthma Immunol. 2006;96:S1–68. [PubMed] [Google Scholar]
- 18.Garcia-Ara C, Boyano-Martinez T, Diaz-Pena JM, Martin-Munoz F, Reche-Frutos M, Martin-Esteban M. Specific IgE levels in the diagnosis of immediate hypersensitivity to cows’ milk protein in the infant. J Allergy Clin Immunol. 2001;107:185–190. doi: 10.1067/mai.2001.111592. [DOI] [PubMed] [Google Scholar]
- 19.Du Toit G, Roberts G, Sayre PH, et al. Randomized trial of peanut consumption in infants at risk for peanut allergy. N Engl J Med. 2015;372:803–813. doi: 10.1056/NEJMoa1414850. [DOI] [PMC free article] [PubMed] [Google Scholar]
- 20.Perkin MR, Logan K, Tseng A, et al. Randomized trial of introduction of allergenic foods in breast-fed infants. N Engl J Med. 2016;374:1733–1743. doi: 10.1056/NEJMoa1514210. [DOI] [PubMed] [Google Scholar]
- 21.Strachan DP. Hay fever, hygiene, and household size. BMJ. 1989;299:1259–1260. doi: 10.1136/bmj.299.6710.1259. [DOI] [PMC free article] [PubMed] [Google Scholar]
- 22.Koplin JJ, Dharmage SC, Ponsonby AL, et al. Environmental and demographic risk factors for egg allergy in a population-based study of infants. Allergy. 2012;67:1415–1422. doi: 10.1111/all.12015. [DOI] [PubMed] [Google Scholar]
- 23.Boneberger A, Haider D, Baer J, et al. Environmental risk factors in the first year of life and childhood asthma in the central south of Chile. J Asthma. 2011;48:464–469. doi: 10.3109/02770903.2011.576740. [DOI] [PubMed] [Google Scholar]
- 24.Khetan R, Hurley M, Neduvamkunnil A, Bhatt JM. Fifteen-minute consultation: AN evidence-based approach to the child with preschool wheeze. Arch Dis Child Educ Pract Ed. 2018;103(1):7–14. doi: 10.1136/archdischild-2016-311254. [DOI] [PubMed] [Google Scholar]
- 25.Piromrat K, Chinratanapisit S, Trathong S. Anaphylaxis in an emergency department: a 2-year study in a tertiary-care hospital. Asian Pac J Allergy Immunol. 2008;26(2–3):121–128. [PubMed] [Google Scholar]
- 26.Gunaratne AW, Makrides M, Collins CT. Maternal prenatal and/or postnatal n-3 long chain polyunsaturated fatty acids (LCPUFA) supplementation for preventing allergies in early childhood. Cochrane Database Syst Rev. 2015;7:Cd010085. doi: 10.1002/14651858.CD010085.pub2. [DOI] [PMC free article] [PubMed] [Google Scholar]
Associated Data
This section collects any data citations, data availability statements, or supplementary materials included in this article.
Supplementary Materials
Extension of background literature in allergy - Factors associated with allergic disorders. (DOC 178 kb)
Data Availability Statement
The datasets generated during and/or analysed during the current study are not publicly available due to specific restrictions from the ethics committee(s), but are available from the corresponding author on reasonable request.