

Abstract
Background:
The extent to which trial-level factors differentially influence accrual to trials has not been comprehensively studied. Our objective was to evaluate the empirical relationship and predictive properties of putative risk factors for low accrual in the National Cancer Institute’s (NCI’s) Cooperative Group Program, now the National Clinical Trials Network (NCTN).
Methods:
Data from 787 phase II/III adult NCTN-sponsored trials launched between 2000 and 2011 were used to develop a logistic regression model to predict low accrual, defined as trials that closed with or were accruing at less than 50% of target; 46 trials opened between 2012 and 2013 were used for prospective validation. Candidate predictors were identified from a literature review and expert interviews; final predictors were selected using stepwise regression. Model performance was evaluated by calibration and discrimination via the area under the curve (AUC). All statistical tests were two-sided.
Results:
Eighteen percent (n = 145) of NCTN-sponsored trials closed with low accrual or were accruing at less than 50% of target three years or more after initiation. A multivariable model of twelve trial-level risk factors had good calibration and discrimination for predicting trials with low accrual (AUC in trials launched 2000–2011 = 0.739, 95% confidence interval [CI] = 0.696 to 0.783]; 2012–2013: AUC = 0.732, 95% CI = 0.547 to 0.917). Results were robust to different definitions of low accrual and predictor selection strategies.
Conclusions:
We identified multiple characteristics of NCTN-sponsored trials associated with low accrual, several of which have not been previously empirically described, and developed a prediction model that can provide a useful estimate of accrual risk based on these factors. Future work should assess the role of such prediction tools in trial design and prioritization decisions.
Low accrual to adult oncology clinical trials is a major barrier to progress in cancer therapy. Clinical trials that do not achieve sufficient accrual are frequently unable to inform clinical practice or benefit patients (1–3). Moreover, low-accruing clinical trials often represent a waste of scarce human and economic resources (4).
A 2010 report by the Institute of Medicine (IOM) stressed the need for a more systematic approach to prioritize the selection of cooperative group–sponsored clinical trials and improve recruitment and trial completion rates (5). The report prompted the transformation of the cooperative group program into the National Clinical Trials Network (NCTN) in March 2014 in an effort to create a more streamlined and efficient system for developing and managing cancer clinical trials (5,6). Although the consolidation and centralization of the group’s activities will likely improve efficiency, many questions still remain about how to transparently and effectively prioritize trials and improve accrual rates.
Identifying factors that predict low accrual in trials before they are launched could help optimize trial design to improve accrual and inform trial design and portfolio prioritization efforts. Although many studies have investigated the perceived barriers to accrual from the patient or provider perspective (7,8), the extent to which differences between trials could predict low accrual has not been comprehensively evaluated. The few prior studies that have explored trial characteristics associated with accrual were importantly limited in the breadth of candidate predictors and number of trials studied (3,9). The purpose of this study was to evaluate the association and predictive properties of a broad set of putative trial-level factors and low accrual within the portfolio of adult cooperative group–sponsored cancer clinical trials.
Methods
Developing a Conceptual Model of Low Trial Accrual
We thematically synthesized evidence regarding trial-level risk factors for low accrual from a literature review (Supplementary Tables 1 and 2, available online) and key informant interviews (n = 3) with nationally recognized clinical trial experts (10). We organized the evidence into a conceptual model, shown in Figure 1, with overarching themes related to: 1) the broader landscape in which the trial is launched, 2) the disease(s) and 3) treatment(s) being evaluated, and 4) the trial’s design.
Figure 1.

Conceptual model of factors associated with low trial accrual. The scientific rationale for a trial can be a disease- and/or treatment-related factor. State-level coverage of clinical trial costs is not applicable prospectively and was therefore excluded from the set of candidate predictors.
Data Sources and Study Population
We used the 2014 AACT (Aggregate Analysis of ClinicalTrials.gov) database, a reformatted database of clinical trials registered in ClinicalTrials.gov (11). We obtained all interventional, late-phase (II or III) adult oncology trials launched between 2000 and 2011 with a cooperative group member listed as a sponsor or collaborator (n = 810) for our model developmental set. The AACT database includes enrollment data for most completed studies. We obtained accrual data for those with missing data and ongoing trials directly from individual cooperative groups and the Clinical Trials Support Unit (CTSU), a system that manages the enrollment process and patient entry onto National Cancer Institute (NCI)–sponsored cancer clinical trials, in May 2014. We used the same approach to obtain a set of trials launched between 2012 and 2013 (n = 50) for an external validation, with ongoing accrual collected in July 2015. This provided at least three years of follow-up for the trials launched between 2000 and 2011 (development set) and at least 1.5 years of follow-up for trials launched between 2012 and 2013 (preliminary validation set).
We combined the AACT database with two additional data sources to explore a broader set of potential risk factors of low accrual. We obtained dates of initial marketing approval and the type of initial FDA review for all drugs and biologicals evaluated in each trial from the FDA database of approved drugs, Drugs@FDA Database (12). We calculated annual US incidence of each cancer condition studied in an NCTN-sponsored clinical trial using data from the Surveillance, Epidemiology, and End Results (SEER) Program (13).
Outcome: Low Trial Accrual
Low trial accrual was defined as a trial that closed with or was experiencing substantially lower-than-planned accrual in May 2014 (trials launched 2000–2011) or July 2015 (trials launched 2012–2013) and was therefore unlikely to generate sufficient evidence to address the primary endpoint. For our primary analyses we classified trials as having low accrual if their actual accrual was less than 50% of the target given prior evidence that few trials with less than 50% at one to two years after launch ultimately attain sufficient accrual and because accrual less than 50% beyond the first year currently triggers a formal review and possible early termination by CTEP (14,15). We also considered alternative thresholds (25% and 75%) in sensitivity analyses. We excluded trials that closed with lower-than-expected enrollment because of interim results or toxicity issues that necessitated stopping the trial early (n = 23 among trials launched 2000–2011 and n = 4 among trials launched 2012–2013).
Selecting and Measuring Predictors of Successful Trial Accrual
We sought to identify or derive measureable candidates for all putative predictors. Some predictors (eg, whether the trial was conducted in a metastatic or adjuvant setting) were straightforward to measure, whereas others (eg, complexity of eligibility criteria or less compelling scientific rationale) were more difficult or unfeasible to quantify with currently available data. The final set of candidate predictors (Table 1) was therefore limited primarily by the availability of data elements.
Table 1.
Summary of trial characteristics for all adult cooperative group–sponsored phase II or III oncology trials registered in ClinicalTrials.gov that started enrollment between 2000 and 2011. All percentages are calculated by row
| Trial characteristics | Trials with successful accrual (n = 642) |
Trials with low accrual (n = 145) |
P* |
|---|---|---|---|
| Number competing trials, per 10 000 eligible patients per year, median (IQR) | 2.9 (1.1–5.8) | 4.4 (1.8–10.4) | <.001 |
| Treatment setting, No. (%) | |||
| Intervention modality† | |||
| Drug or biological | 590 (82) | 131 (18) | .5 |
| Surgery or procedure | 105 (80) | 27 (20) | .5 |
| Radiotherapy | 129 (74) | 46 (26) | .002 |
| Multimodality | 264 (79) | 70 (21) | .14 |
| Therapeutic (vs nontherapeutic) | 568 (82) | 127 (18) | .6 |
| Targeted therapy | 232 (87) | 36 (13) | .009 |
| New investigational agent | 180 (89) | 22 (11) | <.001 |
| Intervention granted priority or fast track review | 310 (82) | 70 (18) | .9 |
| Metastatic setting, No. (%) | 131 (84) | 25 (16) | .4 |
| Clinical setting†, No. (%) | |||
| Blood cancers (leukemia, lymphoma, or myeloma) | 107 (80) | 26 (20) | .7 |
| Prostate, colon, lung, or breast tumors | 250 (83) | 50 (17) | .3 |
| All other solid tumors | 305 (80) | 75 (20) | .4 |
| Annual incidence of eligible patient population, median (IQR) | 76 100 (52 000–232 700) | 64 990 (24 100–170 000) | .011 |
| Enrollment fraction, median (IQR), % | 0.031 (0.013–0.090) | 0.068 (0.022–0.191) | <.001 |
| Sample size, median (IQR) | 82 (51–242) | 110 (60–468) | .5 |
| Randomized design, No. (%) | 264 (77) | 78 (23) | .007 |
| Phase III, No. (%) | 179 (75) | 61 (25) | .001 |
| Placebo control, No. (%) | 62 (86) | 10 (14) | .4 |
| Number of interventions studied, median (IQR) | 2 (1–4) | 3 (2–5) | .027 |
| More than one condition evaluated, No. (%) | 173 (76) | 54 (24) | .015 |
| Intervention assignment blinded, No. (%) | 86 (83) | 18 (17) | .9 |
| Number of sites enrolling patients (n = 677), median (IQR) | 33 (7–80) | 48 (22–100) | .4 |
| Eligibility limited by performance status, No. (%) | 606 (81) | 138 (19) | .8 |
| Eligibility limited by age, No. (%) | 27 (87) | 4 (13) | .6 |
* P values were obtained from univariate logistic regression or Fisher’s exact test. IQR = interquartile range.
† Not mutually exclusive categories.
To estimate the level of competition for patients we first classified the clinical condition(s) studied by each NCTN-sponsored trial and then identified all trials registered on ClinicalTrials.gov that studied the same clinical condition(s) using a text-based algorithm (Supplementary Table 3, available online). Next, within each clinical condition we counted the total number of trials that opened in the year preceding the start date of the index NCTN trial (these were considered “competing” trials) and divided by the total annual incidence of the relevant patient population(s), providing an estimate of the number of competing trials per 10 000 eligible patients per year. Lastly, although there were many incentives to register a trial before 2007, there was not a legal requirement and the portfolio of trials on ClinicalTrials.gov is likely incomplete. We therefore used multiple imputation techniques to recalibrate the total number of competing trials that were launched prior to September 27, 2007 (Supplementary Methods, Accounting for Misclassified Number of Competing Trials Launched prior to 2007, includes additional details and results of alternative definitions of competition, available online).
Enrollment fraction was defined as the percentage of eligible patients who would be enrolled in the trial each year if the trial accrued as designed. We classified interventions as new investigational agents if the start date of the trial preceded the first US Food and Drug Administration (FDA) approval date for the relevant drug or biological product for any indication; surgical or radiotherapy interventions were considered FDA approved for the purposes of these analyses. We classified interventions as targeted therapies if they were listed on the National Cancer Institute’s list of targeted cancer therapies (16).
Statistical Analyses
We used univariate logistic regression models to explore the association between trial accrual success and each main effect listed in Table 1. Predictors were selected using stepwise regression by optimizing the Akaike Information Criteria (AIC), which is a widely used statistical metric used to select the most parsimonious model that minimizes information loss (17). We explored inclusion of interaction terms between trial phase and each of the selected marginal predictors selected by the stepwise algorithm to account for possible multiplicative effects and inclusion of restricted cubic splines with knots at the quartiles to account for possible nonlinear relationships in the continuous variables (18). To check the robustness of our results to the model selection strategy and generate penalized regression coefficients that may provide more accurate out-of-sample predictions, we also explored selecting predictors using the least absolute shrinkage and selection operator (LASSO) (19).
We evaluated the discrimination of the model by calculating the area under the receiver operating characteristic curve (AUC) and calibration by comparing visually the observed and predicted risks across deciles of predicted risk in a calibration plot. Predictive accuracy was corrected for overfit (“optimism”) by bootstrap resampling with 200 replications, wherein the predictors were reselected within each replication. We considered an AUC of greater than 0.7 as “good” (20–22). Bootstrap resampling provides an estimate of the statistical optimism associated with evaluating a prediction model on the same dataset that was used to develop it. This is achieved by obtaining multiple training sets by repeatedly sampling observations from the original dataset with replacement. In each replication, we built a model on the training set, and then calculated the difference in the AUC when the model was applied to the training set and the validation set. Lastly, after the predictive model was finalized using trials launched between 2000 and 2011, we conducted a preliminary evaluation of its prospective validity using a sample of NCTN-sponsored trials launched in 2012 and 2013. All statistical tests were two-sided. All statistical analyses were conducted using Stata 13.0 (StataCorp LP, College Station, TX) and RStudio 0.98 (RStudio Inc., Boston, MA).
Results
Overall, 145 (18%) NCTN-sponsored trials that launched between 2000 and 2011 closed with low accrual or were accruing at less than 50% of targeted accrual three or more years after initiation. The majority of trials (65%) had completed enrollment at the time of these analyses (Table 2).
Table 2.
Summary of outcome classification, stratified by trial completion status
| Enrollment status | Trials with successful accrual (>50% of target) (n = 642) |
Trials with low accrual (<50% of target) (n = 145) |
|---|---|---|
| Trial enrollment ongoing, No. (%) | 242 (38) | 36 (25) |
| Enrollment completed, No. (%) | 400 (62) | 109 (75) |
Factors Associated With Low Accrual
We identified several trial-level factors that were importantly associated with trial accrual within each of the overarching themes from our conceptual model (Table 1). With respect to background factors, low-accruing trials were launched in settings of higher competition (median 4.4 vs 2.9 trials per 10 000 eligible patients per year) than those with successful accrual. We also found that trials with low accrual were more likely to study conditions with a lower annual incidence (median 64 990 vs 76 100 patients) and require a larger enrollment fraction (0.068% vs 0.031% of the eligible patient population each year). In line with our conceptual model, we found that trials in metastatic settings were less likely to be classified as low accruing (16% vs 23% of trials in metastatic vs nonmetastatic settings); however, after adjusting for other risk factors, the association was suggestive of an increased risk of low accrual in metastatic settings (odds ratio [OR] = 1.46, 95% confidence interval [CI] = 0.82 to 2.58) (Table 3).
Table 3.
Multivariable logistic regression model: predictors of low accrual to cooperative group-sponsored phase II and III trials registered in ClinicalTrials.gov and started between 2000 and 2011
| Risk factor | OR (95% CI) |
|---|---|
| Number of competing trials per 10 000 eligible patients per year | 1.88 (1.32 to 2.68) |
| Phase III (vs II) | 1.86 (1.03 to 3.37) |
| Enrollment as % of eligible population, per % | * |
| Targeted therapy | 0.57 (0.36 to 0.89) |
| Radiation therapy | 1.81 (1.16 to 2.81) |
| Annual incidence of clinical condition(s), per 10 000 | 0.99 (0.97 to 1.01) |
| Tissue sample required to assess eligibility | 1.26 (0.84 to 1.87) |
| Investigational new drug | 0.34 (0.17 to 0.69) |
| Metastatic setting | 1.46 (0.82 to 2.58) |
| Sample size, per 100 | 0.95 (0.91 to 0.99) |
| More than one condition evaluated | 1.98 (1.26 to 3.11) |
| Common solid cancer (prostate, breast, lung, or colon) vs liquid or rare solid cancers | 2.32 (1.31 to 4.10) |
| Interaction term (phase III x Investigational new drug) | 2.47 (0.84 to 7.25) |
* We used restricted cubic splines (a mathematical representation of a complex curve) to model the outcome of poor accrual as a function of enrollment fraction. Including these terms in the prediction model allowed us to model nonlinear relationships at the expense of interpretable odds ratios. The beta coefficients for splines and other model variables are provided in Supplementary Table 4 (available online). CI = confidence interval; OR = odds ratio.
We identified several treatment-related risk factors associated with low accrual that were consistent with our conceptual model. In particular, trials with low accrual were less likely to study a new investigational agent (15% vs 28% of trials with successful accrual) or a targeted therapy (25% vs 36%), but were more likely to evaluate multimodality (48% vs 41%), surgery (19% vs 16%), or radiation therapy (32% vs 20%). Because of the lack of data and standardized definitions, we were unable to measure several treatment-related factors from our conceptual model, specifically the relevance of the research question to clinical practice, patient or physician preferences for a specific treatment, or deviation from standard of care.
Several hypothesized factors related to trial design were associated with an increased risk of low accrual, including more burdensome eligibility criteria as measured by the use of a tissue or biopsy sample to assess eligibility, randomized design, and greater trial complexity as measured by the number of interventions evaluated, number of study locations listed on ClinicalTrials.gov, and whether the trial studied more than one clinical condition. We did not observe important associations between risk of low accrual and length of planned follow-up or use of a placebo.
Accrual Prediction
The multivariable logistic model to predict low accrual (Table 3) exhibited good discriminatory performance, both internally (bootstrap corrected AUC on trials launched 2000–2011 = 0.739, 95% CI = 0.696 to 0.783) and when applied to trials launched between 2012 and 2013 (AUC = 0.732, 95% CI = 0.547 to 0.917). Predicted risks of low accrual were in good agreement with observed risks across the range of predicted risks, indicating good calibration (Figure 2). Trials in the top 10% of predicted risk had an average 52% predicted (52% actual) risk of low accrual compared with a mean of 16% predicted (16% actual) among the remaining 90%.
Figure 2.
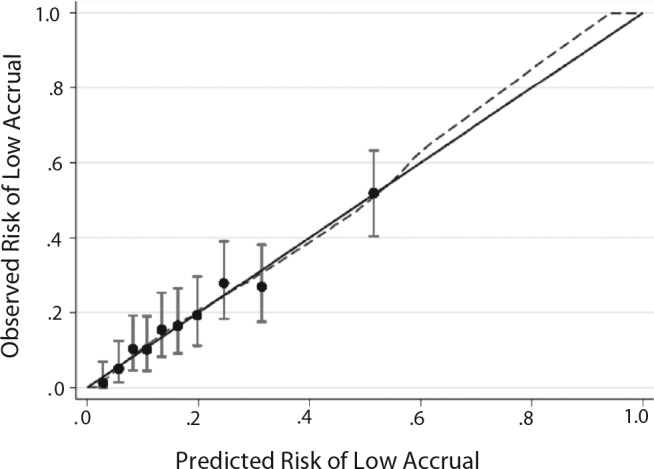
Calibration plot for cooperative group-sponsored trials registered in ClinicalTrials.gov and started between 2000 and 2011. The calibration figure shows the average risk of poor accrual for trials grouped into deciles by their predicted risk (x-axis) compared with the actual percentage of trials in these groups that experienced poor accrual (y-axis). Vertical lines correspond to 95% confidence intervals. Perfect calibration would fall on the 45-degree diagonal line where predicted risks equal observed rates of poor accrual. χ2 for Hosmer-Lemeshow goodness-of-fit test was 3.36 (P = .97)
Sensitivity Analyses
Our results were robust to different definitions of low accrual. The cutoff of 50% accrual is most relevant because it is commonly used to determine trial termination. Of note, however, a model built to predict a stricter definition of low accrual (<25% of target planned enrollment) included similar, but five fewer predictors than our main analysis (Supplementary Table 5, available online) and exhibited slightly improved discriminatory ability (AUC = 0.755). In contrast, a model built to predict a less strict definition of low accrual (<75% of target planned enrollment) included two additional variables (Supplementary Table 6, available online) and exhibited a slightly lower discriminatory ability (AUC = 0.710). Our model was also robust to different predictor selection strategies. For example, the LASSO selected a comparable set of predictors as the model shown in Table 3 (Supplementary Table 7, available online) and resulted in a predictive model with similar discriminatory ability (AUC = 0.745).
Discussion
Summary
We conducted an extensive analysis of trial-level risk factors associated with low accrual across the NCI Cooperative Group’s portfolio of late-phase clinical trials launched in the last decade. We identified multiple factors that were associated with low accrual. Several have not been empirically characterized previously, including the estimated number of patients available relative to the trial’s accrual target and impact of trials recently launched for the same patient population. Taken collectively, we found that these trial-level risk factors were important and potentially useful predictors of a trial failing to achieve more than 50% of its targeted accrual.
Implications
Although the size of the eligible patient population and the level of competition from other trials are known to influence accrual to cooperative group cancer clinical trials (23), these associations have not previously been characterized empirically. Given the importance of these factors to accrual risk, future work should explore how these factors impact accrual in more detail. For example, it would be helpful to understand if trials launched amidst more competitive landscapes have a more difficult time recruiting individual patients or securing enrollment sites, or if competing trials primarily influence accrual of other trials by generating evidence that changes standard of care and/or obviates the need to continue other ongoing trials.
Future research will also be necessary to evaluate the role of a prediction tool of low accrual for prospective clinical trial accrual predictions and feasibility evaluations. Current accrual predictions are usually based on cooperative group experience in a particular disease setting; however, we identified several trial-level factors that could importantly affect projections based on past accrual experience. When previous accrual experience is not available, a prediction tool could also help inform educated judgments regarding the likelihood of achieving certain accrual targets.
We envision a prediction tool also being potentially useful in aiding in the selection and prioritization of clinical trials and perhaps helping target limited resources to support accrual where it is most needed. Importantly, we identified a small subset of trials at very high risk of low accrual: Those in the top 10% of predicted risk (n = 79) achieved greater than 50% target accrual less than half the time. Whether such high-risk trials should be pursued is a complex question that involves consideration of several criteria beyond feasibility; however, a quantitative measure of feasibility could help inform the sometimes necessary tradeoffs between accrual feasibility and other outcomes. Moreover, if high-risk trials are launched, a quantitative metric of accrual risk could help target limited resources to these trials to support accrual where it is most needed.
Comparison With Other Studies
Although numerous studies have investigated reasons for low accrual to clinical trials, only a few have empirically evaluated predictors of accrual success. Schroen et al. evaluated potential predictors of accrual feasibility using a convenience sample of cooperative group trials launched between 1991 and 2004. Although they evaluated several of the same predictors as in our analysis, they did not identify any factors conclusively associated with achieving sufficient accrual (14). Their inconclusive findings were likely because of a very small sample size—only 82 trials—compared with our sample of nearly 800 trials.
Cheng et al. identified several early warning signals of accrual that may be useful for trial redesigns or decisions to terminate a trial that has already launched; however, these measures are not useful in the prioritization or planning of trials as such data are not available until after a trial has started (1). In contrast, we evaluated factors that are available when trials are being designed and could therefore be used in both the planning and prioritization of trial proposals.
Korn et al. also found better accrual among NCTN trials that evaluated an investigational new agent compared with those that did not (3). Among phase III trials activated between 2000 and 2007, they found that 18.5% with an investigational new agent and 26.7% without failed to achieve sufficient accrual. Surprisingly, the authors concluded that there was no substantial difference in the proportion of poorly accruing trials according to whether or not the trial involved an investigational new agent, despite a seemingly large difference. Our findings regarding the impact of studying an investigational new agent on accrual were similar, but our conclusions differ: We contend that they are important because accrual predictions from trials of new investigational agents may not provide the best available prediction of accrual for trials of FDA-approved interventions and vice versa.
Limitations
This study has several important limitations. First, we classified trials as having low accrual using a threshold of less than 50% target accrual. This definition was informed by prior studies and current clinical trial stopping rules. We found that a more or less strict definition of low accrual would not importantly change many of the predictors included in our multivariable model and would result in similar discriminatory abilities. Although the model to predict a stricter definition of low accrual was simpler and had a higher predictive accuracy than our main analyses, this is largely because the model relied on fewer and more extreme outcomes. Importantly, the model to predict less than 50% accrual had a similar discriminatory ability (albeit poor calibration) in predicting the outcome of less than 25% accrual (AUC = 0.74), whereas the model to predict less than 25% of target accrual had worse discriminatory ability at predicting less than 50% accrual (0.70).
We also found that there was a higher rate of low accrual among completed trials than ongoing studies. It is therefore possible that our definition of low accrual for ongoing trials may not capture the complete set of trials that will eventually terminate with less than 50% of targeted accrual; however, we felt that this was the most robust and least biased approach to classify trials with low accrual. Prior studies have avoided this challenge by restricting analyses to completed trials (1); however, this approach is subject to sampling bias because trials that terminate early because of poor accrual are more likely to be included. Another recent study used time-to-event analyses to study the cumulative incidence of failing to complete (24); however, this approach is not well suited for identifying risk factors for accrual of different trials that operate on very different time scales (eg, trials in metastatic vs prevention settings) where censoring is likely to be informative and could therefore potentially bias the results. Our approach does not exclude or censor trials with incomplete accrual follow-up and therefore is not subject to potential bias from sampling or informative censoring. We may misclassify trials as having low or successful accrual; however, this potential misclassification would be nondifferential and is therefore only expected to bias our results towards the null, if at all. Our initial investigation of accrual over time suggests that it is extremely rare for trials experiencing poor (successful) accrual three or more years after initiation to ultimately change course and end with successful (poor) accrual.
Second, it is important to emphasize that the prediction model is not intended to replace decision makers’ judgment in assessing a trial’s feasibility for several reasons. Some key factors, such as the scientific rationale of the trial or relevance to clinical practice, are likely critical to accrual success but are not currently measured in a systematic or standardized way and were therefore not included in our prediction model. Furthermore, some of the differences in risk factors between trials with successful and poor accrual were small in absolute terms and may not be considered meaningful on their own, such as the annual incidence of the eligible patient population; other risk factors, such as a trial’s complexity or burden, are only reflected imperfectly using available data. In other words, our model is not perfect. That said, our model consolidates twelve key measurable factors that are associated with low accrual into a single, objective metric that has a promising discriminatory ability. Perhaps most importantly, it provides a framework and rationale for more research on the measurement and evaluation of additional trial-level risk factors associated with low accrual.
We identified multiple characteristics of cooperative group–sponsored trials that were importantly associated with low accrual, several of which have not been previously empirically described. We developed a prediction model that could provide a rigorous and transparent measure to calculate the risk of low accrual based on theses factors. Systematically considering the overall influence of these factors could aid in the design and prioritization of future clinical trials and therefore provides a direct response to the IOM’s call for efforts to improve the selection, support, and completion of publicly funded cancer clinical trials.
Funding
This work was supported by grant 1R36HS023340-01 from the Agency for Healthcare Research and Quality (AHRQ) and by a Doctoral Dissertation Improvement Grant from the National Science Foundation (DDIG: 1424250).
Supplementary Material
We thank our key informants for sharing their time and expertise and Dr. Lawrence Baker for his critical review and comments on the manuscript.
References
- 1. Cheng SK, Dietrich MS, Dilts DM. Predicting accrual achievement: monitoring accrual milestones of NCI-CTEP-sponsored clinical trials. Clin Cancer Res. 2011;17 (7):1947–1955. [DOI] [PMC free article] [PubMed] [Google Scholar]
- 2. Dilts DM, Cheng SK. The importance of doing trials right while doing the right trials. Clin Cancer Res. 2012;18 (1):3–5. [DOI] [PMC free article] [PubMed] [Google Scholar]
- 3. Korn EL, Freidlin B, Mooney M, Abrams JS. Accrual experience of National Cancer Institute Cooperative Group phase III trials activated from 2000 to 2007. J Clin Oncol. 2010;28 (35):5197–5201. [DOI] [PMC free article] [PubMed] [Google Scholar]
- 4. Kitterman DR, Cheng SK, Dilts DM, Orwoll ES. The prevalence and economic impact of low-enrolling clinical studies at an academic medical center. Acad Med. 2011;86 (11):1360–1366. [DOI] [PMC free article] [PubMed] [Google Scholar]
- 5. A National Cancer Clinical Trials System for the 21st Century: Reinvigorating the NCI Cooperative Group Program. Institute of Medicine (IOM). http://iom.edu/Reports/2010/A-National-Cancer-Clinical-Trials-System-for-the-21st-Century-Reinvigorating-the-NCI-Cooperative.aspx. Accessed April 15, 2010. [DOI] [PMC free article] [PubMed]
- 6. An Overview of NCI’s National Clinical Trials Network. National Cancer Institute. http://www.cancer.gov/clinicaltrials/nctn. Accessed October 14, 2014.
- 7. Mills EJ, Seely D, Rachlis B, et al. Barriers to participation in clinical trials of cancer: a meta-analysis and systematic review of patient-reported factors. Lancet Oncol. 2006;7 (2):141–148. [DOI] [PubMed] [Google Scholar]
- 8. Vickers AJ. Clinical trials in crisis: Four simple methodologic fixes. Clin Trials. 2014;11 (6):615–621. [DOI] [PMC free article] [PubMed] [Google Scholar]
- 9. Schroen AT, Petroni GR, Wang H, et al. Achieving sufficient accrual to address the primary endpoint in phase III clinical trials from U.S. Cooperative Oncology Groups. Clin Cancer Res. 2012;18 (1):256–262. [DOI] [PMC free article] [PubMed] [Google Scholar]
- 10. Thomas J, Harden A. Methods for the thematic synthesis of qualitative research in systematic reviews. BMC Med Res Methodol. 2008;8:45. [DOI] [PMC free article] [PubMed] [Google Scholar]
- 11. Hirsch BR, Califf RM, Cheng SK, et al. Characteristics of oncology clinical trials: insights from a systematic analysis of ClinicalTrials.gov. JAMA Intern Med. 2013;173 (11):972–979. [DOI] [PubMed] [Google Scholar]
- 12. Drugs@FDA Database. http://www.fda.gov/Drugs/InformationOnDrugs/ucm135821.htm. Accessed March 12, 2014.
- 13. Surveillance, Epidemiology, and End Results (SEER) Program Research Data (1973–2011), National Cancer Institute, DCCPS, Surveillance Research Program, Surveillance Systems Branch, released April 2014, based on the November 2013 submission.
- 14. Schroen AT, Petroni GR, Wang H, et al. Preliminary evaluation of factors associated with premature trial closure and feasibility of accrual benchmarks in phase III oncology trials. Clin Trials. 2010;7 (4):312–321. [DOI] [PMC free article] [PubMed] [Google Scholar]
- 15. CTEP-Sponsored Cooperative Group Phase III trials: Early Stopping Guidelines for Slow Accruing Trials. Cancer Therapy Evaluation Program. http://ctep.cancer.gov/protocolDevelopment/docs/slow_accrual.pdf Accessed September 10, 2014.
- 16. Targeted Cancer Therapies. National Cancer Institute. http://www.cancer.gov/about-cancer/treatment/types/targeted-therapies/targeted-therapies-fact-sheet. Accessed September 10, 2014
- 17. Sakamoto Y, Ishiguro M, Kitagawa G. Akaike information criterion statistics. Dordrecht, The Netherlands: D. Reidel; 1986. [Google Scholar]
- 18. Harrell FE. Regression Modeling Strategies: with Applications to Linear Models, Logistic Regression, and Survival Analysis. New York, NY: Springer; 2001. [Google Scholar]
- 19. Tibshirani R. Regression Shrinkage and Selection via the Lasso. J Royal Stat Soc. 1996;58 (1):267–288. [Google Scholar]
- 20. Rudloff U, Jacks LM, Goldberg JI, et al. Nomogram for predicting the risk of local recurrence after breast-conserving surgery for ductal carcinoma in situ. J Clin Oncol. 2010;28 (23):3762–3769. [DOI] [PubMed] [Google Scholar]
- 21. Graesslin O, Abdulkarim BS, Coutant C, et al. Nomogram to predict subsequent brain metastasis in patients with metastatic breast cancer. J Clin Oncol. 2010;28 (12):2032–2037. [DOI] [PubMed] [Google Scholar]
- 22. Snell KI, Hua H, Debray TP, et al. Multivariate meta-analysis of individual participant data helped externally validate the performance and implementation of a prediction model. J Clin Epidemiol. 2015; In press. [DOI] [PMC free article] [PubMed] [Google Scholar]
- 23. Schroen AT, Petroni GR, Wang H, et al. Challenges to accrual predictions to phase III cancer clinical trials: a survey of study chairs and lead statisticians of 248 NCI-sponsored trials. Clin Trials. 2011;8 (5):591–600. [DOI] [PMC free article] [PubMed] [Google Scholar]
- 24. Stensland KD, McBride RB, Latif A, et al. Adult cancer clinical trials that fail to complete: an epidemic? J Natl Cancer Inst. 2014;106 (9):dju229 doi:10.1093/jnci/dju229. [DOI] [PubMed] [Google Scholar]
Associated Data
This section collects any data citations, data availability statements, or supplementary materials included in this article.