Abstract
Peanut allergy can be life-threatening and is mediated by allergen-specific immunoglobulin E (IgE) antibodies. Investigation of IgE antibody binding to allergenic epitopes can identify specific interactions underlying the allergic response. Here, we report a surface plasmon resonance imaging (SPRi) immunoassay for differentiating IgE antibodies by epitope-resolved detection. IgE antibodies were first captured by magnetic beads bearing IgE ε-chain-specific antibodies and then introduced into an SPRi array immobilized with epitopes from the major peanut allergen glycoprotein Arachis hypogaea h2 (Ara h2). Differential epitope responses were achieved by establishing a binding environment that minimized cross-reactivity while maximizing analytical sensitivity. IgE antibody binding to each Ara h2 epitope was distinguished and quantified from patient serum samples (10 μL each) in a 45 min assay. Excellent correlation of Ara h2-specific IgE values was found between Immuno-CAP assays and the new SPRi method.
Keywords: immunoassays, immunoglobulin E, magnetic bead, peanut allergy, surface plasmon resonance (SPR) imaging
Predicting peanut allergies: For the first time, epitope-resolved detection of peanut-specific IgE antibodies was achieved on a surface plasmon resonance imaging (SPRi) immunoarray using superparamagnetic bead-antibody conjugates (MB-Ab2). The level of IgE antibodies specific for a prominent peptide epitope, Ara h2–3, showed promise for predicting peanut sensitization.

The prevalence of food allergies, particularly among children, is on the rise, and it constitutes a growing health concern worldwide.[1-3] Peanut allergy is among the most common food allergies, and it is the leading cause of food allergy deaths.[4] Exposure to even trace amounts of peanut-derived materials can induce a serious reaction—including anaphylactic shock—in a sensitized individual who is allergic to peanut storage proteins. Treatment requires immediate administration of epinephrine, followed by an emergency room visit. There is a persistent and critical need for improved diagnostic methods that can accurately predict a patient’s severity of allergic reactions to peanuts Although the gold standard method in peanut allergy diagnosis is the double-blind, placebo-controlled food challenge, it is expensive, time-consuming, and potentially dangerous. The current state-of-the-art procedure is to perform a clinical history and then confirm sensitization with IgE anti-peanut serology. ImmunoCAP, which is a widely employed diagnostic IgE antibody assay, uses allergosorbents to which both peanut extract and a number of individual allergenic peanut (Arachis hypogaea) proteins (Ara h1, h2, h3, h8, and h9) are immobilized.[5, 6] Several studies have shown that the presence and quantity of IgE antibodies specific for the major peanut storage proteins (e.g., Ara h1, h2, and h3) are particularly useful in confirming clinically relevant sensitization and predicting the relative severity of a reaction following peanut exposure.[7, 8]
Higher-resolution information about specific sequences of Ara h2 recognized by IgE antibodies has been obtained by peptide array methods.[9-11] In these studies, IgE antibodies selectively and differentially bind to the peptides with overlapping sequences based on the epitopes recognized. Certain regions of a protein, therefore, are inherently more immunogenic than others. The properties of the IgE repertoire logically have a direct impact on the degree of allergic symptoms that an individual will experience. Parameters, such as the total IgE concentration, the diversity of epitopes recognized, the IgE antibody affinity for those epitopes, and the ratio of allergen-specific IgE to total IgE, are the most important in this regard.[12] Our long-term goal is to collect concentration and affinity data on circulating IgE antibodies in an epitope-resolved manner. This will allow for fundamental investigation of the link between IgE antibody repertoire, as measured in serum and objective clinical manifestation of an allergic response. It may also provide information about the severity of allergic response. Here, we focused on the differential recognition of Ara h2 epitopes by IgE antibodies using surface plasmon resonance imaging (SPRi).
We previously reported the use of an Ara h2 peptide as a defined epitope to detect a peanut-specific antibody by electrochemical impedance spectroscopy[13] and resistive pulse sensing.[14] More recently, we reported the first immunoarray for IgE antibodies utilizing both peptide and carbohydrate epitopes. However, the measured concentrations of IgE antibodies that bound to each epitope were statistically indistinguishable.[15] In this study, we have modified the experimental design to improve the selectivity of IgE antibody binding to different epitopes. We present a simple method that is able to differentiate IgE antibody populations in an epitope-resolved manner using superparamagnetic beads (MB), a commercial SPRi array system, and an offline IgE capture strategy. Secondary antibodies (Ab2) specific for the IgE ε-chain were immobilized onto the MB to bind IgE antibodies from serum. This tended to lower the nonspecific binding of other serum proteins to the array surface.[16-18] Differential epitope responses to allergen-specific IgE antibodies were achieved by providing a binding environment designed to detect low IgE concentrations with minimal cross-reactivity. Using this approach, IgE antibodies from peanut-sensitized patient sera were distinguishable in their binding to each of the Ara h2 epitopes and correlated well with results from ImmunoCAP assays using Ara h2 allergosorbent. Statistical analysis of limited patient sample data showed good peanut allergy diagnostic potential and provided epitope- specific immunogenic information that could be correlated with observed IgE-mediated allergy reactions.
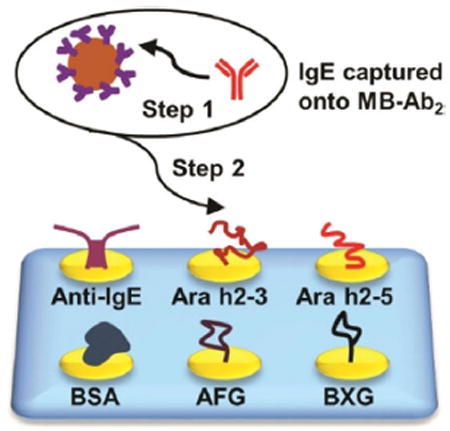
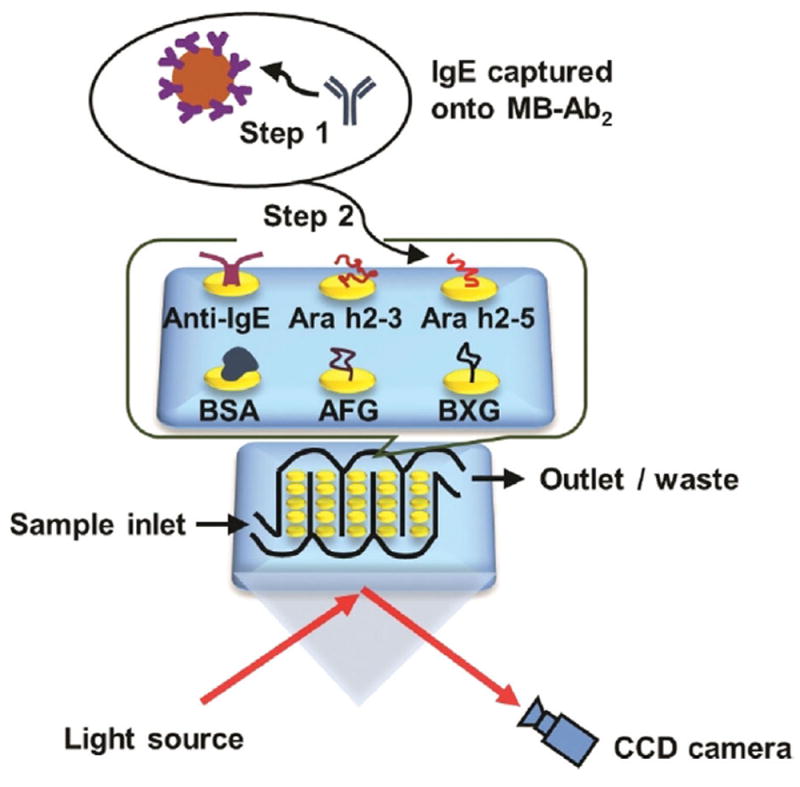
The mixture of IgE antibodies was captured offline from serum using 1 μm Ab2-coated magnetic beads (MB-Ab2). The resulting MB-Ab2-IgE complexes were washed and injected into an SPRi array (SpotReady 25, GWC Technologies), where they bound to Ara h2 epitopes on individual gold SPRi spots (Scheme 1). The Ara h2 epitopes included two immunogenic peptides, namely Ara h2–3 and Ara h2–5, and two carbohydrate epitopes, that is, α(1,3)-fucosyl glycoside (AFG) and β(1,2)-xylosyl glycoside (BXG). A monoclonal anti-IgE positive control and bovine serum albumin (BSA) negative control were also included. Epitope motifs and control proteins were covalently immobilized onto 25 carboxylate-functionalized gold spots of the SPRi array using 1-ethyl-3-(3-dimethylaminopropyl) carbodiimide (EDC) and N-hydroxysulfosuccinimide (sulfo-NHS) bioconjugation.[19] The SPRi array was equipped with a 3D-printed serpentine flow channel to address the epitope-coated gold spots (Figure S1 in the Supporting Information) and interfaced with a syringe pump and a sample injector. Before analysis, the gold array was treated with ethanolamine and equilibrated with phosphate-buffered saline (PBS) containing 0.05% Tween-20. The array could be regenerated using a 60 s pulse of 10 mm NaOH ≈ 10–16 times.[20]
Scheme 1.

Detection of epitope-specific IgE antibodies using surface plasmon resonance imaging (SPRi). IgE antibodies were first captured by MB-Ab2, washed, and injected into an SPRi array; SPRi responses were then measured on individual array spots that had been immobilized with specific allergenic epitopes.
SPR images were collected in real time for the whole array. Bright spots in the SPR difference image indicated the specific binding of MB-Ab2-IgE complexes onto those spots coated with epitopes and anti-IgE, while negligible responses were observed for BSA spots (Figure S3 A). Meanwhile, the image pixel intensities were plotted as SPRi responses against time, generating sensorgrams that were used for quantitative analysis (Figure S3 B). The conditions for IgE antibody binding to MB-Ab2 and SPRi spots were optimized to achieve the best differential epitope responses (Figures S2, S4, and S5).
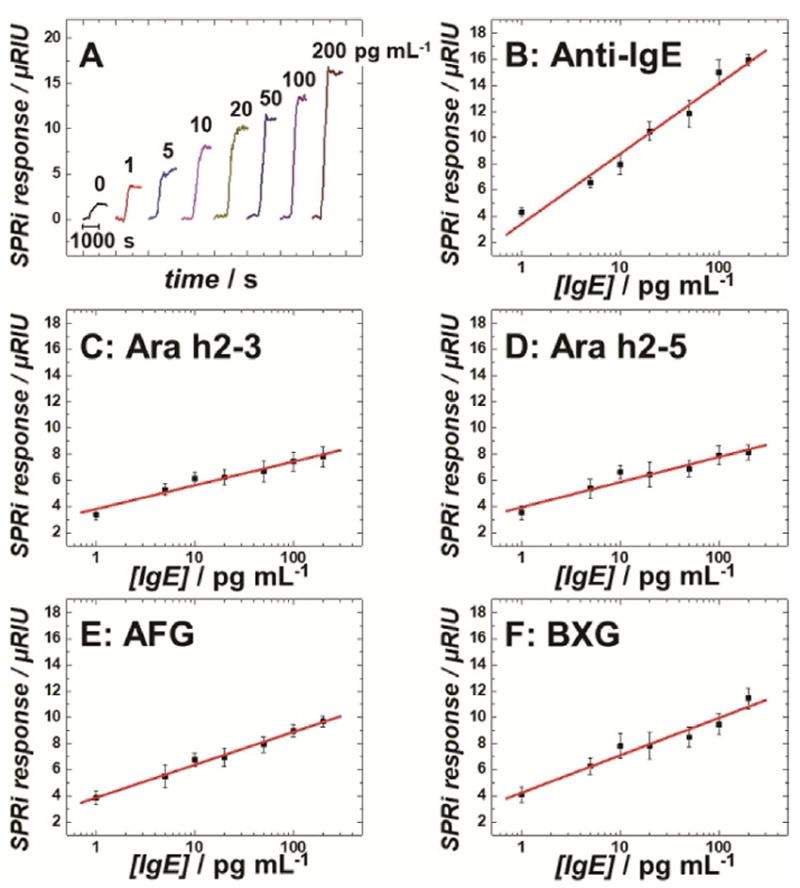
Different concentrations of a human IgE antibody standard (Thermo Fisher) diluted in calf serum were analyzed to create dose–response curves (Figure 1). Limits of detection (LODs) for IgE antibody were 0.5 pgmL−1 on anti-IgE spots, 5.0 pgmL−1 on peptide spots, and 2.0 pgmL−1 on carbohydrate spots, all of which were more than 50-fold improvements over the LODs of the ImmunoCAP assay. The analytical sensitivity, as defined by the slope of the calibration curve on anti-IgE spots, differed significantly from those on peptide and carbohydrate spots, according to Student’s t-test (p<0.01). The dynamic ranges of calibration plots were over two orders of magnitude for all the epitope spots. These results illustrate the potential of SPRi to differentiate epitope-specific IgE antibodies in patient samples.
Figure 1.

Calibration assays for human IgE antibodies spiked in calf serum: A) background-subtracted SPRi responses for IgEs captured on MB-Ab2 and injected into anti-IgE immobilized SPRi spots. Calibration plots of human IgE antibodies measured on SPRi spots coated with B) anti-IgE, C) Ara h2–3, D) Ara h2–5, E) AFG, and F) BXG. Error bars represent standard deviations for n=4. μRIU: micro-refractive index unit.
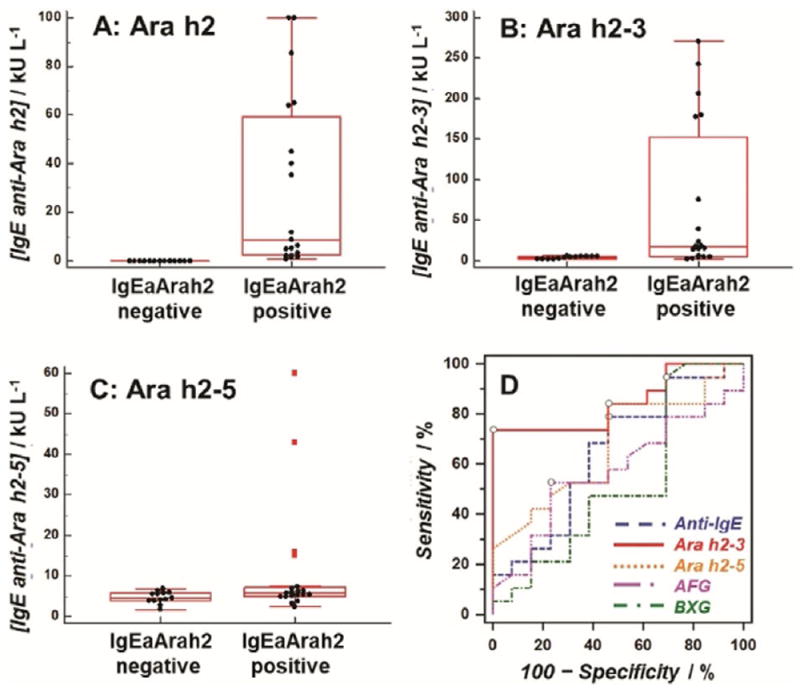
Thirty-two coded sera from peanut-sensitized patients were provided from the serum bank at the Johns Hopkins University Dermatology, Allergy, and Clinical Immunology (DACI) Reference Laboratory. The sera were analyzed in the SPRi array after a 100- to 10000-fold dilution to bring their SPRi responses into the linear range of the assay. The measured concentrations in ngmL−1 were converted to kUL−1 (1 kUL−1=2.42 ngmL−1)[21] and further compared with those from ImmunoCAP assays (peanut extract and Ara h1, h2, h3, h8, and h9 specificities). The historical threshold (0.35 kUL−1) was used as a cutoff for positive and negative results.[22] As IgE antibodies specific for Ara h2 are considered by many to be the most accurate predictor of risk for a severe reaction in peanut-sensitized individuals, two groups were categorized based on having negative (n=13) and positive (n=19) results in levels of IgE anti-Ara h2 (Figure 2A). Significant differences in the level of IgE anti-Ara h2–3 peptide epitope were observed between those two groups (Figure 2B, p<0.01, Table S1). On the other hand, measured IgE antibody levels between negative and positive groups were found to be statistically indistinguishable (p>0.01, Table S1) when using array spots containing peptide epitope Ara h2–5, two carbohydrate epitopes, or anti-IgE antibody (Figure 2C and Figure S7). These results confirmed that our new immunoassay strategy resulted in differentiation of IgE antibody binding to each epitope.
Figure 2.

Distributions of IgE antibody levels in individuals having negative (n=13) and positive (n=19) levels of IgE anti-Ara h2 (IgEaAra h2): IgE antibodies against A) Ara h2; B) Ara h2–3; C) Ara h2–5; and D) ROC curves for peanut sensitization confirmation using levels of IgE antibodies against four peanut epitopes and anti-IgE.
Receiver operating characteristic (ROC) analyses[23] examined the ability of each epitope to confirm the sensitization to peanuts. ROC curves for levels of IgE antibodies against four Ara h2 epitopes and anti-IgE are shown in Figure 2D. The IgE anti-Ara h2–3 exhibited the best prediction for peanut sensitization, with area under the curve (AUC) of 0.85, 73.7% sensitivity, and 100.0% specificity (Table 1).
Table 1.
AUC, sensitivity, and specificity for peanut sensitization confirmation by ROC analysis.
| Level of IgE antibodies specific for | AUC ±SE[a] | Sensitivity [%] | Specificity [%] |
|---|---|---|---|
| Anti-IgE | 0.64±0.11 | 79.0 | 53.9 |
| Ara h2–3 | 0.85±0.07 | 73.7 | 100.0 |
| Ara h2–5 | 0.68±0.10 | 84.2 | 53.9 |
| AFG | 0.51±0.12 | 100.0 | 53.9 |
| BXG | 0.57±0.11 | 52.6 | 69.2 |
Standard error (SE).
Our epitope-resolved analytical system depends on minimizing cross-reactivity while maintaining high analytical sensitivity. Its ability to measure IgE levels in the pgmL−1 range with relatively low epitope surface coverage minimizes the cross-reactivity of other IgE antibody specificities. Using MB enables the SPRi to detect pgmL−1 levels of IgE antibodies by increasing both the refractive index of the binding moiety and the apparent binding constant of IgE antibody.[24] Around 60000 Ab2 molecules were estimated on one MB-Ab2 bioconjugate (Figure S2), which facilitates efficient IgE capture by driving the Ab2+IgE⇋[Ab2·IgE] equilibrium toward association. Using the offline capture approach, IgE antibodies were separated from nonspecific serum proteins, resulting in a higher analytical sensitivity and a clearer signal differentiation with each epitope. Importantly, this capture strategy rules out the binding of other anti-peanut antibodies (e.g., IgG4) to Ara h2 epitopes.[9]
As Ara h2-specific IgE antibody levels are important in the evaluation of a patient for peanut allergy, two peptides bearing Ara h2 anti-peanut IgE-binding epitopes were evaluated in this study (Ara h2–3 and Ara h2–5). The IgE antibodies specific for Ara h2–3 provided enhanced correlation with sensitization to peanuts over those for Ara h2–5 epitope (Figure 2 and Table 1). It indicated that Ara h2–3 is a more immunogenic epitope of the Ara h2 protein. These data agree with other epitope mapping studies.[9-11] Such differences in IgE antibody levels might result from their different positions and secondary structures in the Ara h2 protein (Figure S8).[25] Ara h2–3 presents a protruding, flexible surface loop which is easily accessible for IgE antibody binding, while Ara h2–5 maintains a rigid α-helix structure that is buried behind Ara h2–3 in Ara h2 protein. Thus, most Ara h2-specific IgE antibodies may bind to the immunodominant epitope of Ara h2–3 rather than Ara h2–5.
In addition, two carbohydrate epitopes (AFG and BXG) were investigated to examine the effect of cross-reactive carbohydrate determinants (CCDs), as xylose and core-3-linked fucose residues from CCDs can also contribute to peanut-specific IgE antibody binding.[26, 27] The presence of these sugars on glycoproteins from numerous plant species is thought to be responsible for sensitization profiles due to cross-reactivity. Our results indicate that the level of IgE antibodies specific for AFG or BXG gave poor correlation with sensitization profiles from ImmunoCAP using either Student’s t-test or ROC analysis (Figure 2D and Figure S7, Table 1 and Table S1). Our findings, together with those of others,[28] question the relevance of CCDs in the allergic response.
A model initially proposed by Aalberse et al.[29] and later demonstrated experimentally by Christensen et al.[30] was likely operative in our system. In this model, an allergen is initially captured by one IgE antibody anchored on the mast cell surface, followed by binding to another IgE in close proximity. The co-binding of IgE antibodies to the allergen is sufficient to induce degranulation, a key process that can lead to anaphylaxis if it is sufficiently massive. Similarly, in the SPRi assay, IgE antibodies are first anchored onto MB-Ab2, the size of which is comparable to a cell. The anchored IgE antibody is then allowed to interact with epitopes on the array spots. The interaction between epitopes of low surface coverage and IgE antibodies of pgmL−1 level reflects the fact that only a subset of circulating allergen proteins can interact with a subset of IgE antibodies and trigger the immune responses.[31] Throughout the assay, the flow rate creates a dynamic, non-static condition, similar to the circulatory system.
In summary, we describe an epitope-resolved assay system for the detection of peanut-allergen-specific IgE antibodies using SPRi technology. The assay achieved LODs of 0.5–5.0 pgmL−1 using MB and produced differential IgE responses to different Ara h2 epitopes. The SPRi array results correlated well with ImmunoCAP results from repository-based sera and provided insights into the molecular epitopes involved in sensitization to peanuts. This analytical approach is applicable to future microarrays that employ an expanded cohort of allergenic epitopes to achieve a clear fingerprint of a patient’s sensitization profile and risk for a severe reaction to peanuts.
Supplementary Material
Acknowledgments
Financial support this project was from a University of Connecticut Research Excellence Program grant to C.V.K., J.F.R., and M.W.P. Partial support from the National Institute of Biomedical Imaging and Bioengineering (NIBIB, grant no. EB016707 to J.F.R.) and a National Science Foundation (NSF) EAGER grant (DMR-1441879 to C.V.K.) is also acknowledged.
Footnotes
Supporting information for the authors of this article can be found under https://doi.org/10.1002/cbic.201700513.
Conflict of Interest
The authors declare no conflict of interest.
References
- 1.Sicherer SH, Sampson HA. J Allergy Clin Immunol. 2010;125:S116–S125. doi: 10.1016/j.jaci.2009.08.028. [DOI] [PubMed] [Google Scholar]
- 2.Sicherer SH, Muñoz-Furlong A, Godbold JH, Sampson HA. J Allergy Clin Immunol. 2010;125:1322–1326. doi: 10.1016/j.jaci.2010.03.029. [DOI] [PubMed] [Google Scholar]
- 3.Bunyavanich S, Rifas-Shiman SL, Platts-Mills TAE, Workman L, Sordillo JE, Gillman MW, Gold DR, Litonjua AA. J Allergy Clin Immunol. 2014;134:753–755. doi: 10.1016/j.jaci.2014.05.050. [DOI] [PMC free article] [PubMed] [Google Scholar]
- 4.Bock SA, Muñoz-Furlong A, Sampson HA. J Allergy Clin Immunol. 2007;119:1016–1018. doi: 10.1016/j.jaci.2006.12.622. [DOI] [PubMed] [Google Scholar]
- 5.De Knop KJ, Bridts CH, Verweij MM, Hagendorens MM, De Clerck LS, Stevens WJ, Ebo DG. Adv Clin Chem. 2010;50:87–101. doi: 10.1016/s0065-2423(10)50005-2. [DOI] [PubMed] [Google Scholar]
- 6.Nicolaou N, Poorafshar M, Murray C, Simpson A, Winell H, Kerry G, Härlin A, Woodcock A, Ahlstedt S, Custovic A. J Allergy Clin Immunol. 2010;125:191–197. doi: 10.1016/j.jaci.2009.10.008. [DOI] [PubMed] [Google Scholar]
- 7.Ebisawa M, Movérare R, Sato S, Maruyama N, Borres MP, Komata T. Pediatr Allergy Immunol. 2012;23:573–581. doi: 10.1111/j.1399-3038.2012.01332.x. [DOI] [PubMed] [Google Scholar]
- 8.Zhuang Y, Dreskin SC. Immunol Res. 2013;55:125–134. doi: 10.1007/s12026-012-8355-x. [DOI] [PMC free article] [PubMed] [Google Scholar]
- 9.Shreffler WG, Lencer DA, Bardina L, Sampson HA. J Allergy Clin Immunol. 2005;116:893–899. doi: 10.1016/j.jaci.2005.06.033. [DOI] [PubMed] [Google Scholar]
- 10.Otsu K, Guo R, Dreskin SC. Clin Exp Allergy. 2015;45:471–484. doi: 10.1111/cea.12407. [DOI] [PMC free article] [PubMed] [Google Scholar]
- 11.Han Y, Lin J, Bardina L, Grishina GA, Lee C, Seo WH, Sampson HA. Molecules. 2016;21:622. doi: 10.3390/molecules21050622. [DOI] [PMC free article] [PubMed] [Google Scholar]
- 12.Hamilton RG, MacGlashan DW, Saini SS. Immunol Res. 2010;47:273–284. doi: 10.1007/s12026-009-8160-3. [DOI] [PubMed] [Google Scholar]
- 13.Liu H, Malhotra R, Peczuh MW, Rusling JF. Anal Chem. 2010;82:5865–5871. doi: 10.1021/ac101110q. [DOI] [PMC free article] [PubMed] [Google Scholar]
- 14.Wang Y, Kececi K, Mirkin MV, Mani V, Sardesai N, Rusling JF. Chem Sci. 2013;4:655–663. doi: 10.1039/C2SC21502K. [DOI] [PMC free article] [PubMed] [Google Scholar]
- 15.Joshi AA, Peczuh MW, Kumar CV, Rusling JF. Analyst. 2014;139:5728–5733. doi: 10.1039/c4an01544d. [DOI] [PMC free article] [PubMed] [Google Scholar]
- 16.Krishnan S, Mani V, Wasalathanthri D, Kumar CV, Rusling JF. Angew Chem Int Ed. 2011;50:1175–1178. doi: 10.1002/anie.201005607. [DOI] [PMC free article] [PubMed] [Google Scholar]; Angew Chem. 2011;123:1207–1210. [Google Scholar]
- 17.Singh V, Rodenbaugh C, Krishnan S. ACS Sens. 2016;1:437–443. doi: 10.1021/acssensors.5b00273. [DOI] [PMC free article] [PubMed] [Google Scholar]
- 18.Singh V, Nerimetla R, Yang M, Krishnan S. ACS Sens. 2017;2:909–915. doi: 10.1021/acssensors.7b00124. [DOI] [PMC free article] [PubMed] [Google Scholar]
- 19.Lahiri J, Isaacs L, Tien J, Whitesides GM. Anal Chem. 1999;71:777–790. doi: 10.1021/ac980959t. [DOI] [PubMed] [Google Scholar]
- 20.Wang Y, Dostalek J, Knoll W. Anal Chem. 2011;83:6202–6207. doi: 10.1021/ac200751s. [DOI] [PubMed] [Google Scholar]
- 21.Bazaral M, Hamburger RN. J Allergy Clin Immunol. 1972;49:189–191. doi: 10.1016/0091-6749(72)90113-3. [DOI] [PubMed] [Google Scholar]
- 22.Siles RI, Hsieh FH. Cleveland Clin J Med. 2011;78:585–592. doi: 10.3949/ccjm.78a.11023. [DOI] [PubMed] [Google Scholar]
- 23.Zweig MH, Campbell G. Clin Chem. 1993;39:561–577. [PubMed] [Google Scholar]
- 24.Mani V, Wasalathanthri DP, Joshi AA, Kumar CV, Rusling JF. Anal Chem. 2012;84:10485–10491. doi: 10.1021/ac3028257. [DOI] [PMC free article] [PubMed] [Google Scholar]
- 25.Mueller GA, Gosavi RA, Pomés A, Wünschmann S, Moon AF, London RE, Pedersen LC. Allergy. 2011;66:878–885. doi: 10.1111/j.1398-9995.2010.02532.x. [DOI] [PMC free article] [PubMed] [Google Scholar]
- 26.van Ree R, et al. J Biol Chem. 2000;275:11451–11458. doi: 10.1074/jbc.275.15.11451. [DOI] [PubMed] [Google Scholar]
- 27.Commins SP. Curr Allergy Asthma Rep. 2015;15:492. doi: 10.1007/s11882-014-0492-y. [DOI] [PubMed] [Google Scholar]
- 28.Holzweber F, Svehla E, Fellner W, Dalik T, Stubler S, Hemmer W, Altmann F. Allergy. 2013;68:1269–1277. doi: 10.1111/all.12229. [DOI] [PMC free article] [PubMed] [Google Scholar]
- 29.Aalberse RC, Budde IK, Stapel SO, van Ree R. Allergy. 2001;56:27–29. doi: 10.1034/j.1398-9995.2001.00909.x. [DOI] [PubMed] [Google Scholar]
- 30.Christensen LH, Holm J, Lund G, Riise E, Lund K. J Allergy Clin Immunol. 2008;122:298–304. doi: 10.1016/j.jaci.2008.05.026. [DOI] [PubMed] [Google Scholar]
- 31.Lupinek C, Wollmann E, Baar A, Banerjee S, Breiteneder H, Broecker BM, Bublin M, Curin M, Flicker S, Garmatiuk T. Methods. 2014;66:106–119. doi: 10.1016/j.ymeth.2013.10.008. [DOI] [PMC free article] [PubMed] [Google Scholar]
Associated Data
This section collects any data citations, data availability statements, or supplementary materials included in this article.


