

Abstract
Objective
Cortical spreading depression (CSD) has long been implicated in migraine attacks with aura. The process by which CSD, a cortical event that occurs within the blood brain barrier (BBB), results in nociceptor activation outside the BBB is likely mediated by multiple molecules and cells. The objective of this study was to determine whether CSD activates immune cells inside the BBB (pia), outside the BBB (dura), or in both, and if so, when.
Methods
Investigating cellular events in the meninges shortly after CSD, we used in-vivo 2-photon imaging to identify changes in macrophages and dendritic cells (DC) that reside in the pia, arachnoid, and dura, and their anatomical relationship to TRPV1 axons.
Results
We found that activated meningeal macrophages retract their processes and become circular, and that activated meningeal DC stop migrating. We found that CSD activates pial macrophages instantaneously, pial, subarachnoid and dural DC 6-12 minutes later, and dural macrophages 20 minutes later. Dural macrophages and DC can appear in close proximity to TRPV1-positive axons.
Interpretation
The findings suggest that activation of pial macrophages may be more relevant to cases where aura and migraine begin simultaneously, that activation of dural macrophages may be more relevant to cases where headache begins 20-30 minutes after aura, and that activation of dural macrophages may be mediated by activation of migratory DC in the SAS and dura. The anatomical relationship between TRPV1-positive meningeal nociceptors, and dural macrophages and dendritic cells support a role for these immune cells in the modulation of head pain.
Introduction
Migraine is a recurrent neurological disorder characterized as a unilateral, throbbing headache that affects about 27 million women and 10 million men in the US 1. In about 30% of the cases, the headache is preceded by aura, a host of focal cortically-mediated neurological symptoms that appear before and/or during the headache phase 2-5. Clinical and pre-clinical studies suggest that migraine aura is caused by cortical spreading depression (CSD), a slowly propagating wave of depolarization/excitation followed by hyperpolarization/inhibition in cortical neurons and glia 3, 6-8. While it is possible that CSD may have some direct effect on sensory neurons within the central nervous system 9, 10, specificity to migraine headache is almost certain to arise in activation of peripheral pain receptors in the meninges originating in the trigeminal or spinal ganglia 11. Along this line, studies in animal models of migraine aura have shown that CSD activates meningeal nociceptors and central trigeminovascular neurons in two distinct ways—as soon as the CSD wave reaches the cortex underneath the dural receptive field of the recorded neuron, or at a delay of 20-45 minutes 12, 13. Despite this research, little is known about the mechanisms by which aura can activate pain fibers in the meninges, as no CSD-associated process has been identified yet whose time course approximates that of the immediate or delayed nociceptor activation.
Aiming to identify events that occur in the meninges during the 40-minute period that follows CSD, we sought to study the behavior of two populations of immune cells that reside in the pia, arachnoid and dura—macrophages and dendritic cells (DC). The rationale for studying macrophages and dendritic cells is that both are located at a strategic position along the blood brain barrier where they can monitor environmental changes in the CNS by sampling the CSF inside the barrier, while also promoting an inflammatory response outside the barrier 14. Macrophages, which are highly numerous in the pia and in dura 15-17, are usually the quickest to react to inflammatory stimuli and, consequently, considered a first line of defense18. In the absence of pathology, they play an important role in maintaining homeostasis in the environment in which they reside 19, 20. On the other hand, DC, which are fewer in number but can be found in the pia and dura as well 15, 16, are antigen-presenting cells capable of transferring inflammatory reactions from inside the BBB to the outside, where they stimulate and attract T cells 19, 21, 22. The rationale for studying events that relate to inflammation is that NSAIDs, due to their efficacy in attacks of mild and moderate severity 23, are the most commonly used migraine abortive drugs 24, 25, and that prostaglandins are involved in migraine pathophysiology 26. Accordingly, the main rationale of the current study is that if CSD, a CNS event, activates macrophages and DC in meningeal layers outside the BBB, the findings may help explain the process by which aura can trigger headache, especially as these immune cells are capable of activating nociceptors in the meninges 27.
In this study, we determined the effects of CSD on the behavior of macrophages and DC in all layers of the meninges using in vivo 2-photon microscopy to take time-lapse three-dimensional image stacks through the skull of anesthetized fluorescently tagged transgenic mice. This technique allowed us to monitor macrophages and DC near-simultaneously in the dura, subarachnoid space, pia, and brain before, during and after the induction of CSD.
Materials and Methods
Animals
All procedures involving animals were in compliance with the experimental protocol approved by the Institutional Animal Care and Use Committee of Beth Israel Deaconess Medical Center and Harvard Medical School and adhered to the guidelines of the Committee for Research and Ethical Issues of the International Association for the Study of Pain. Mice genotypic lines include wild type, CX3CR1-GFP, CD11C-YFP, Trpv1-cre, and Ai14 (Jackson Labs: 5582, 8829, 17769, and 7914). Mice were all on C57BL/6J background. Equal numbers of male and female mice were used throughout the experiments, at 5-10 months old. Mice were kept in 12 hr light/dark cycles and were housed 2-5 per cage.
Anesthesia
Mice were deeply anesthetized using intraperitoneal injection of urethane (1.5 g/kg) and atropine (.15 mg/kg). Using this method, we routinely kept mice at normal physiological levels (heart-rate 550-700, arterial O2 saturation: 90-100%, breathing-rate: 120-200; monitored with a MouseOx, Starr Life Science Corp, Oakmont, PA) throughout the length of the experiment.
Skull thinning
A modified thin skull procedure was used for acute trans-cranial imaging based on those described previously 28, 29. Briefly, the scalp was shaved and sterilized, a midline scalp incision was made, and a metal plate was affixed to the skull using cyanoacrylate. An area of 1.5mm in diameter was thinned on the right parietal skull plate 1/3 the distance from lambda to bregma posteriorly. We used a high speed drill and a microsurgical blade to thin the skull to a thickness of 50-60 μm for the thin skull preparation. We found that this thickness still allows good resolution of superficial structures but disturbs the dura minimally, as determined by intact dural blood vessels free from clotting or bleeding.
In vivo imaging
Fully anesthetized mice were imaged in an Olympus FV1000MPE-E multiphoton Imaging System using a Spectra-Physics Maitai Deepsee laser (∼70fs pulse width) and a PLAN 25× 1.05 NA objective. Three color channels were collected simultaneously (420-460nm blue in a PMT; 495-540 green and 575-630 red in GaAsP detectors). A wavelength of 890 was used to excite all fluorophores, and produce second harmonic generation at 445nm (blue). After skull thinning, mice were placed in the microscope with head plate still attached. Time-lapse three-dimensional image stacks were taken covering a space from the skull through the meninges to the brain. Image resolution was 1024×1024 pixels wide with about 20-25 slices covering an area of 509×509 μm wide and 60-90 μm deep. For quantification of shape or position, images were taken every 3 minutes for macrophages or every 2 minutes for dendritic cells.
CSD initiation
CSD was initiated similar to previously described methods30. For both CSD and sham surgery mice, a small (<1mm2) area was thinned on the frontal skull plate 1 mm anterior from bregma and equidistant medial-laterally from the edges of the frontal plate. This area was chosen as it was far enough away from the imaging site that craniotomy did not affect imaged cells. The underlying dura was then exposed with a 31 gauge needle. For CSD initiation, a glass electrode tapered to about 30um at the tip was inserted through the dura to about 500 μm into the cortex for 20 seconds before removal.
Injections
Texas-red conjugated 3kDalton dextran (TRD) (Thermo Fisher Scientific) was injected via tail vein or retroorbitally for intravenous injection (50 μl of 2mg/ml in saline). For intraparenchymal injection, one microliter of 2mg/ml TRD in synthetic interstitial fluid was slowly injected 700-1000μm beneath the dura through a glass micropipette (tip diameter of about 10μm) attached to a micromanipulator. The dye was injected into a small craniotomy created using a 31 gauge needle on the corner of the imaging window (within 1mm of the location imaged). Lipopolysacharride (LPS, O26:B6 from Sigma) at 1mg/kg (1mg/ml in saline) was administered via tail vein injection. All injections were performed under anesthesia.
Image analysis
Images were analyzed using Fiji (www.fiji.sc), a version of ImageJ.
Determination of Arrival of CSD Wave
As described in our recent study [Schain 2017], the time of the arrival of the CSD wave under the imaging window was determined by changes in blood vessel width that occurred 1-2 minutes post CSD initiation. Time point 0 for “Time post CSD” was chosen as the time point previous to the time point with the strongest blood vessel constriction. In sham mice, an arbitrary time point 0 was set at 15 minutes for macrophages, 20 minutes for DC to match the duration of baseline imaging in the respective CSD mice. See Results.
Quantification of macrophage and dendritic cell position and shape
Image stacks containing macrophages or dendritic cells were aligned over time based on background or blood vessel positions. The brightness of the stack was normalized over time to adjust for small brightness changes due to objective immersion water evaporation or photobleaching. Cell cross-sectional areas were then determined by thresholding maximum intensity projections through 1-4 slices. A custom Fiji macro using the wand tool was used to aid visual guidance in creating a selection for each individual cell over time. From the selection of each cell at each time point, XY-position, area, perimeter and circularity were measured. Circularity is defined as ((4*pi*area)/perimeter2), which is a ratio of the perimeter of a perfect circle with the shape's area and the shape's actual perimeter. In this ratio, a perfect circle would have the highest possible value of 1.0, while less circular shapes will have lower values. Dendritic cell speed was calculated as the distance traveled in the XY-plane from one time point to the next (2 minutes), and averaged over three 2-minute time periods (6 minutes).
Statistics
Multiple two-tailed paired student's t-tests with Bonferroni correction were used to compare individual time points after CSD (or similar time period in sham) to baseline for macrophage or dendritic cell circularity, and dendritic cell speed. Multiple two-tailed student's t-tests with Bonferroni correction were used to compare pial and dural macrophage circularity after CSD or pial and subarachnoid dendritic cell speed after CSD.
Results
Baseline characteristics of CX3CR1-positive macrophages
To determine whether CSD alters the behavior of meningeal macrophages, we first studied their baseline anatomical appearance and behavior when undisturbed using in vivo 2 photon microscopy. Images were taken through a thin skull of at least 50 μm thickness, which minimized incidence of ruptured or clotted dural blood vessels. The skull and dura were identified by second harmonic generation (SHG) generated naturally by their high levels of collagen31. Intravenous Texas-Red dextran was used to label the blood, which also allowed us to distinguish between the separate dural and pial vascular networks 32. The pial vascular network helps to distinguish the pia from the brain because pial blood vessels run parallel to the pial surface, with branches that penetrate orthogonally into the brain. Using heterozygous CX3CR1-GFP knock-in mice 33, macrophages were identified among GFP-positive cells by their shape, phagocytic properties, such as the uptake of Texas-Red dextran injected intravenously (Fig. 1A) or intraparenchymally (in separate experiments) (Fig. 1B), and their macropinocytotic cellular membrane movements (Fig. 1C). Of note, very few GFP-negative cells took up dye into vesicles in the brain or the dura within one hour (Fig. 1A-B). A small percentage of cells per mouse were excluded using this criteria (Fig. 1A,D). Dural and pial CX3CR1-positive macrophages in the meninges were easily distinguishable from brain microglia by shape. Macrophages are flat, with a few thick membrane extensions from their cell body, whereas microglia have many thin-branched processes and a small cell body (Fig 1B, arrowhead, 2A). No CX3CR1-positive macrophages fitting this description were seen in the brain parenchyma below the level of the pia. (Images representative of n=16 mice.)
Figure 1. Identification of macrophages in CX3CR1-GFP mice.

(A) Representative in vivo 2-photon image slice at the level of the dura through the thinned skull of a mouse expressing GFP (green) under the CX3CR1 promoter after IV injection of Texas-Red Dextran (TRD) (red). Skull second harmonic generation is blue. TRD in the dura is taken up into vesicles by most GFP-positive cells (arrows), likely by macropinocytosis, a behavior exhibited by macrophages. GFP is also expressed by some small, round cells (arrowhead) that do not take up TRD. (B) An image slice though the pia in a CX3CR1-GFP mouse that has been injected intraparenchymally with TRD. Pial macrophages take up TRD (arrows) within an hour, while microglia have not (arrowhead). (C) TRD-positive, GFP-positive cells also have an irregular shape and exhibit dynamic process extension and retraction over minutes (possibly macropinocytosis). The few small, round, TRD-negative, GFP-positive cells (D) do not. Images are shown at one minute intervals. Scale bar 15 μm.
CX3CR1-positive macrophages were found in two distinct layers in the meninges: on the outer surface of the dura, just beneath the skull, and within the pia (Fig. 2a-b). Macrophages were defined as dural if they were in contact with the skull, above the SHG of the dura, and at the level of the dura vasculature, and as pial if they were at the level of the pial vasculature, as visible in orthogonal reconstructions (Fig. 2B). A crucial difference between dural and pial macrophages is that dural macrophages are outside the blood brain barrier and pial macrophages are inside. In a wild-type mouse injected intravenously with 3kDalton FITC dextran and intraparenchymally with 3kDalton Texas-Red dextran, only dural macrophages had taken up the intravenous FITC dextran, and only pial macrophages had taken up intraparenchymal Texas-Red dextran after one hour (Fig. 2d) (representative of n=3 mice).
Figure 2. Macrophages form monolayers in the dura and pia.

(A-B) Representative three-dimensional image stack of the dura, pia, and brain in a CX3CR1-GFP mouse in horizontal, XY view (A) and in an orthogonally reconstructed XZ side-view (B). The spatial relationship of two dural macrophages (d1 and d2), two pial macrophages (p1 and p2), and one microglia (mg) are shown in both XY (A), and XZ (B). (C) Plot of the number of macrophages counted per image field (260k μm2) in the dura and pia, as well as the number of microglial cell bodies counted in an equivalent volume of the top layer of the brain (20um of depth). No macrophages were seen in the subarachnoid space (SAS). (D) Horizontal XY views at the level of the dura and pia, and reconstructed XZ view from a wild-type mouse injected intravenously with 3k-Dalton FITC dextran (FD, green) as well as intraparenchymally with 3k-Dalton Texas-Red dextran (TRD, red). FD leaks only into the dura, which lacks a blood-brain barrier, and is taken up only by dural macrophages, while TRD remains only in the brain, and is taken up only by pial macrophages. Scale bar 50 μm for XY views (A,D) and 25 μm for XZ views (B,D).
There were about 113±4 macrophages in the dura and 81±8 in the pia, as well as 56±3 microglia cell bodies in the superficial cortex per 260k μm2 × 20 μm imaged volume (n=16 mice) (Fig. 2C). No significant differences in macrophage numbers between male and female mice were detected (195±17 total male vs 180±9 total female, p(4.4)=0.50). At baseline, macrophages were dynamic, exhibiting phagocytosis and macropinocytosis (as in Fig. 1B), but not mobile (they were anchored to their location at least over 1-2 hours). Of note, intraparenchymal dye injections were only performed in the experiments above. In the experiments below, pial macrophages were identified morphologically.
Effect of CSD on macrophages
Because CX3CR1-positive macrophages are present both at the pial surface, near the neurons that propagate cortical spreading depression, and on the dura, where most meningeal nociceptors are located, we determined the effects of CSD on both dural and pial macrophages. In the experimental group, we observed macrophage cellular behavior for 20 minutes before and 60 minutes after the arrival of a single CSD wave induced via pinprick. In the sham group, we observed macrophage behavior for 80 minutes after drilling a cranial window for the pinprick—but not using it to induce CSD. The most distinct change we observed was morphological. The occurrence of CSD caused macrophages to retract their cellular processes/pseudopodia (Fig. 3a-b). We were able to quantify these shape changes by determining the circularity of the cells' shape in thresholded images, with more cellular process withdrawal resulting in more circular cells (Fig. 3c-f). Whereas macrophages became significantly more circular than baseline in the pia as soon as the CSD wave arrived (Fig. 3b,d), in the dura they became significantly more circular 20 minutes later (Fig. 3a,c). In the period of 3-24 min post CSD, pial macrophages were significantly more circular than dural macrophages (Fig.3f, p<0.0025, multiple t-tests with Bonferroni correction). This increased circularity was observed for 40 min in the pia and 20 min in the dura, after which their processes begin to extend again. In contrast, in sham-operated mice, no significant changes from baseline circularity in dural or pial macrophages were observed over the same amount of time. The single time point at which sham dural macrophage circularity was significantly different then baseline was considered anomalous because it was inconsistent with all other time points (Fig.3E). In a comparison between CSD and Sham groups, there was a significant interaction of group (CSD/Sham) over time (baseline-40 minutes post CSD) determined by two-way repeated measures ANOVA (p=2*10-3, F(14,2548)=2.9 for dura; p=3.1*10-5, F(14,1708)=3.3). Additionally, we did not observe any apoptotic/proliferative changes over this time. No cells were observed dividing, disappearing, or infiltrating from the blood. (n=7-9 mice, 237-277 total macrophages per group.)
Figure 3. Macrophages pull in processes and become more circular after cortical spreading depression (CSD).

(A-B) Representative images of macrophages in the dura (A) and pia (B) 15 minutes before, 15 minutes after, and 45 minutes after CSD (bottom) or in control, sham-operated mice (top). Scale bar 10 μm. (C-F) Quantification of the change in circularity of their thresholded shape after arrival of a wave of CSD induced by pinprick or in control, sham-operated mice. Macrophages become more circular as they pull in their elongated processes (arrow in A,B). (C) Dural macrophages become significantly more circular than baseline starting at 21 minutes post CSD to 48 minutes contiguously. (D) Pial macrophages become significantly more circular than baseline immediately following CSD through 42 minutes later, contiguously. (E) In sham operated mice with no pinprick (0 time represents 15 minutes of imaging), the macrophages in both pia and dura do not become more circular than baseline except at one time point, 42 minutes (p=4.4*10-4), for dural macrophages only. (C-E, * indicates p<0.0025 multiple t-tests with Bonferroni correction, comparing each time point to baseline) (F) Pial macrophages were significantly more circular compared to dural macrophages from 3 minutes to 24 minutes post CSD (* indicates p<0.0025 multiple t-tests with Bonferroni correction, comparing dura to pia for each time point). In sham mice, the dura and pial change in circularity was not significantly different at any time point.
Critical to the interpretation of observed changes in macrophage and dendritic cell (see below) behavior in response to CSD was our ability to identify the time point at which the CSD wave reached the imaging window. As demonstrated in Figure 4, the occurrence of CSD, characterized by the classical constriction of pial arteries, was documented in each experiment.
Figure 4. Determination of arrival of CSD wave under the imaging window.
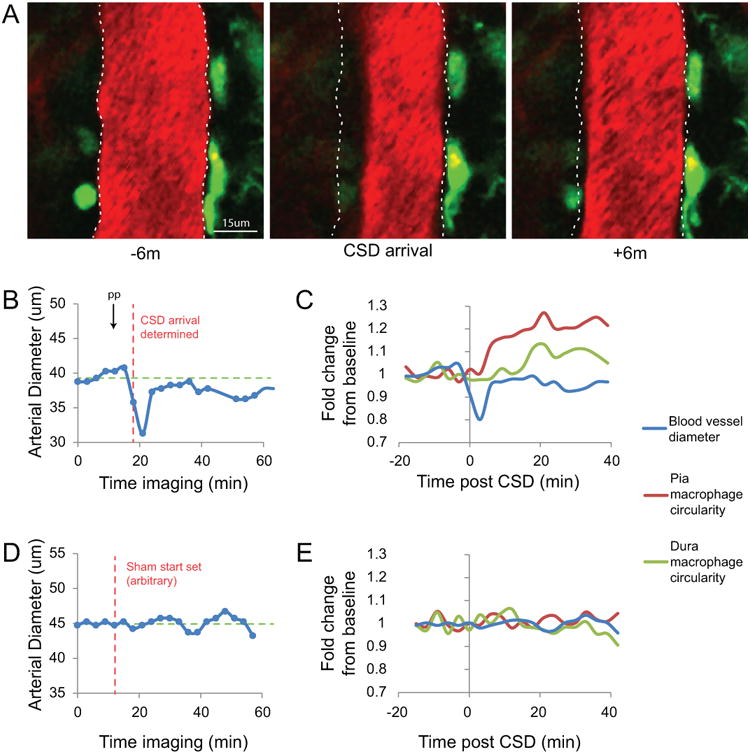
(A-C) Representative images and data from a single mouse that show the determination of when the CSD wave arrived at the imaging window. (A) Images of a Texas-Red Dextran-labeled blood vessel in the pia of a CX3CR1-GFP mouse at baseline (6 minutes before CSD), when the CSD arrives, and 6 minutes after. (B) Plot of the arterial diameter of the blood vessel in (A) since the start of imaging. The time of pinprick (arrow, PP) is shown along with the time point determined as the time point 0 for arrival of CSD in this mouse (red dashed line). The green dashed line is the calculated average baseline diameter of the time points before the determined arrival. (C) Plot of the fold change in circularity of pial and dural macrophages along with the fold change in blood vessel diameter for reference. (D) Example plot similar to (B) of blood vessel diameter from a control mouse that received craniotomy but no pinprick. (E) The same blood vessel diameter plotted as fold change along with accompanying circularity changes in dural and pial macrophages in this control mouse.
Baseline characteristics of dendritic cells
Dendritic cells (DC) were imaged as above in CD11c-YFP mice 34. Their distribution, number, pinocytotic properties and mobility differed from those observed in the macrophages. Dendritic cells were found not only in the pia and dura, but also in the subarachnoid space (SAS) (Fig. 5A-B). Dural DC were defined as those with cell bodies touching the skull and above the dura, near the dural vasculature; SAS DC were defined as those touching both the bottom of the dura and the top of the pia, and pia cells were those that appeared at the level of the pial vasculature, as visible in the orthogonal view (Fig. 5B). Note the clearly separate parallel dural and pial vasculature as well as penetrating blood vessels in the brain in Figure 5B. There were far fewer DCs than macrophages. In the same image volume (260k μm2 × 20 μm) we counted 4.0+-0.6 in the dura, 6.7+-1.0 in the SAS, and 8.6+-1.3 in the pia (n=12 mice) (Fig.5C). DC did not take up injected TRD in either the dural or pial compartments (n=3 mice) (Fig. 5d-e). Two distinct classes of DC were observed, one was anchored in place (61.7%) and the other was mobile (38.3%), migrating within (Fig. 5f) and possibly between (Fig. 5g) the different meningeal layers. Mobile cells were defined as those moving faster than 1.4 μm/min (1 standard deviation above the mean velocity for all cells). Most migrating cells were found in the pia and SAS, and only few were seen in the dura (Fig. 5h). Although DC have been reported in the brain, we did not observe any DC below the pial vasculature in the area of brain imaged.
Figure 5. CD11c-YFP dendritic cells are found in all layers of the meninges and can migrate.

(A-B) Representative in vivo 2-photon images of dendritic cells (DC) from CD11c-YFP mice in both XY (A) and orthogonally reconstructed XZ (B) views show DC in the dura (“d”), subarachnoid space (“sa”), and pia (“p”), and no YFP-positive cells within the brain. (C) Quantification of the number of DC found per image field (260k μm2) in each meningeal layer. (D-E) DC do not phagocytose TRD. An hour after 3k Dalton TRD (red) intravenous (D) or intraparenchymal (E) injection, CD11c-YFP DC (green) in the dura (D) or pia (E) have not taken up TRD while nearby cells (likely macrophages) are brightly labeled. (F-H) A subset of DC were migratory at baseline. (F) Time lapse images (2m between frames) of a CD11c-YFP mouse injected i.v. with Texas-Red dextran (TRD) shows two DC, one anchored to its location (orange markers) over 8 minutes, and one migrating (white markers and lines show cell's path). (G) Some migrating cells can travel from the pia to the dura. An example time lapse image of the same location at the level of the dura (top), pia (middle), and in orthogonal XZ view (bottom) shows a DC in contact with the pia in the first frame migrate up through the subarachnoid space in the middle two frames until it is in contact with the dura in the final frame. The cell is not visible at the dura layer in the first frame, and not visible in the pial layer in the final frame. (H) Number of DC found in each meningeal layer that were migrating (moving faster than 1.4 μm/m) at baseline in each meningeal layer. Note that initially migrating DC are mostly found in the pia. Scale bar 50 μm for A-B, 20 μm for D-G.
Effect of CSD on DC
To determine the effect of CSD on dural, SAS, and pial DCs, we obtained time lapse 2-photon images at 2-minute intervals for 20 minutes before and 40 minutes after the arrival of a single CSD wave, or for 60 minutes in sham operated animals. The most noticeable change in response to CSD was seen in the mobile DC group. Regardless of their location in the different layers of the meninges, those who were mobile before CSD came almost to a halt after the CSD (Fig. 6). Compared to their average speed at baseline, CSD slowed the average velocity of the migrating DC starting at 12m post CSD through at least 36 min (averaging speed over 6 min intervals, calculated from 3 periods of 2 mins) (Fig.6C). The speed of the migrating DC was 2.2±0.1 μm/min at baseline, and CSD slowed the cells to 0.91±0.1 μm/min post-CSD, which was very close to the typical speed of the DC we classified as anchored (0.77±0.03 μm/min). This slowing was significant starting 12 min post CSD (6 min intervals, calculated from 3 periods of 2 min), and happened simultaneously in all layers of the meninges (Fig. 6D). In contrast, no significant slowing was seen in the sham operated mice (Fig. 6C). In a comparison of CSD and Sham groups, there was a significant interaction of group (CSD/Sham) and time (baseline - 36 minutes) according to a two-way repeated measures ANOVA (p=.0011, F(9,378)=3.2). DC also exhibited pseudopodia extensions that were likely not involved in phago- or macropino-cytosis, as they did not take up injected dyes, but were perhaps linked to their motility, as they also withdrew these extensions and became more circular with a similar time frame to their cessation (Fig. 6E) (n=5-7 mice, 22-32 DC per group.)
Figure 6. Migrating dendritic cells stop moving post CSD.

(A-B) Representative time lapse images of a DC from 20 minutes before to 20 minutes after the arrival of a wave of CSD induced by pinprick (A) or in sham mice (B), along with the path the cell has taken in that time (right panels, white markers). Scale bar 20 μm. (C) Plot of the speed of DC averaged over 6-minute intervals in sham and CSD-induced mice. DC significantly slow compared to baseline starting at 12m post CSD through 36m, with no significant changes in speed in sham mice. (* p<0.0083 multiple paired t-test with Bonferonni correction) (D) Plot of the speed of pial DC and DC located in both the subarachnoid space (SAS) and the dura (SAS and dura groups were combined as too few initially migrating cells were found in the dura to consider them as their own group). No significant differences were found at any time point between DC based on meningeal layer. (E) Plot of DC circularity as fold change from baseline. Circularity of DC was increased from 12m through 36m post CSD compared to baseline (* p<0.0083 multiple paired t-test with Bonferonni correction), with no significant changes in sham mice. Only cells that were migrating at baseline were included in these analyses.
Effect of LPS on macrophages and DC
To help us interpret CSD effects on meningeal macrophages and DC, we injected the CX3CR1-GFP and CD11c-YFP mice with the pro-inflammatory bacterial chemical lipopolysaccharide (LPS) via the tail vein. LPS is known to cause inflammation inside and outside the blood brain barrier after systemic injection35, and here we use it as a positive control of macrophage and DC activation. Like CSD, intravenous injection of 1 mg/kg LPS increased the circularity of both pial and dural macrophages, and slowed the speed of the mobile DC group. Macrophage circularity increased at about the same time (27-30 min) in both the pia and dura (n=2 mice, 75 macrophages) (Fig. 7A-C), and the speed of DC slowed 33-36 min after LPS injection (n=2 mice, 11 DC) (Fig. 7D-E).
Figure 7. Lipopolysaccharide (LPS) mimics the effects of CSD.

(A-C) LPS causes macrophages to become more circular. (A) Representative images of dural and pial macrophages 15 minutes before, 15 minutes after, and 40 minutes after i.v. injection of LPS. (B-C) Quantification of change in circularity post- LPS (i.v.) for macrophages in dura (B) and pia (C). Circularity is increased relative to baseline at 27-39 minutes in dural macrophages, and at 30-39 minutes in pial macrophages (p< 3.5*10-3 multiple t-tests with Bonferroni correction). (D-E) DC slow 20-40 minutes after LPS injection. (D) Representative images and path of dendritic cell (white markers and lines) over 20 minutes at baseline, 1-20 minutes, and 21-40 minutes post LPS (i.v.). (E) Quantification of speed of DC averaged over 6 minute intervals in LPS-injected or sham mice. DC are significantly slowed 33-36 minutes after injection (* p<0.0083, multiple paired t-test with Bonferonni correction). DC in sham mice did not slow significantly over the same time frames. Scale bars 15 μm.
Proximity to Trpv1-positive nociceptors
To map the anatomical relationship between meningeal macrophages, meningeal DC, and meningeal nociceptors, we cross-bred CX3CR1-GFP mice and CD11c-YFP mice with mice expressing tdTomato under the Trpv1 promoter (Trpv1-cre × Ai14-tdTomato mice). These triple-transgenic mice express GFP or YFP in macrophages or DC, respectively, and tdTomato red fluorescent protein in Trpv1-positive sensory axons in the dura. As demonstrated in Fig. 8, both macrophages and DC can appear in close apposition to Trpv1-positive axons in the dura. Using these mice, we were not able to observe any Trpv1-positive axons in the pia. (Images representative of n=5 mice.)
Figure 8. Dural macrophages and dendritic cells can be near or in contact with Trpv1-positive axons.

(A) A representative image of dural macrophages (green) near or in contact with a Trpv1-positive axon (red) in a triple-transgenic CX3CR1-GFP × Trpv1-cre × Ai14-tdTomato mouse. (B) Lower magnification view of the area imaged in A (white box) showing relative number of macrophages in contact with Trpv1+ axons (arrows) and those that are not (27 out of 80 macrophages in contact with the TRPV-1 axon in this mouse). (C)Two representative images of DC (yellow) near or in contact with a trpv1-positive axon (red) in a triple-transgenic CD11c-YFP × Trpv1-cre × Ai14-tdTomato mouse. (D) Lower magnification view showing cells in C (white boxes) with additional cells not in contact (6 out of 14 DC in contact with the TRPV1-axon in this mouse). Scale bars 15 μm for A,C, and 50 μm for B,D.
Discussion
Using in vivo two-photon imaging, we tracked two populations of immune cells that reside in the pia, subarachnoid space (SAS) and dura before and after occurrence of CSD. We found that pial macrophages retracted their processes immediately after the CSD wave propagated through the cortical area just beneath them, whereas dural macrophages begin to retract their processes nearly 20 minutes later. Existing literature supports the notion that macrophages adopt a rounded shape when activated 36, 37. Based on this body of evidence and on our observation that exposure to lipopolysaccharide (LPS) also caused the meningeal macrophages to retract their processes, we interpret the findings as suggesting that CSD activates pial macrophages earlier than it activates dural macrophages. We also observed a subgroup of CD11c+ DC in the pia, SAS and dura that were highly mobile before CSD and then either came to a halt, or slowed down significantly after the CSD. In contrast to the immediate activation of pial macrophages and delayed activation of dural macrophages, the DC reaction to CSD was triggered almost simultaneously in all layers of the meninges, after a delay of 6-12 minutes. Here again, existing evidence from the literature 38, 39 and our control LPS results suggest that mobile DC cells stop migrating when they switch from inactive to active state. Accordingly, we interpret the findings as suggesting that CSD activates DC in the pia, SAS and dura after the activation of pial macrophages but before the activation of dural macrophages. A synthesis of these findings raises the following possibilities: (a) activation of pial macrophages may be more relevant to cases in which aura and migraine begin simultaneously; (b) activation of dural macrophages 20 minutes after CSD may be more relevant to cases in which the headache begins 20-30 minutes after the aura; (c) activation of DC in the pia, dura and SAS may depend on (be mediated by) the activation of pial macrophages; and (d) activation of dural macrophages may be mediated by activation of migratory DC in the SAS and dura. And finally, based on the anatomical proximity between dural macrophages, dural DC and dural nociceptors (i.e., TRPV1-positive axons), and on macrophages and DC known ability to produce or promote production of mediators (such as TNFα, IL-1β, and reactive oxygen species) that are capable of sensitizing or activating meningeal40-42 and non-meningeal nociceptors22, 43, it is reasonable to suggest that when activated by CSD, these immune cells can prime, sensitize or activate the meningeal nociceptors.
As described before 16, 44, meningeal macrophages observed in our study lined blood vessels and connective tissues in the dura and pia. These constitutive resident macrophages are likely to maintain pia and dura homeostasis by continuously performing immune surveillance, and clearance of lipoproteins, cellular debris or dead cells using sophisticated phagocytic machinery 18. Two distinct observations noted in the critical 40-minute period that followed the occurrence of CSD have led us to propose that aura can activate those resident macrophages that guard the steady state of the dura and pia, presumably in response to the arrival of certain proteins or cellular debris in the CSF excreted by neurons, but that it does not inflame the meninges to the extent seen in response to bacterial or viral invasion 45, 46. The first observation noted for macrophages, which we interpreted as activation 36, 37, was the dramatic pulling of their processes and adoption of a round shape (Fig. 3), behaviors typically associated with increased phago- or pino-cytosis 20 and the release of pro- or anti-inflammatory factors 37. Activation of macrophages could be associated with both induction and resolution of inflammation. If one accepts the notion that the principle role of resident macrophages is to preserve tissue homeostasis, it may be logical to suggest that the activation seen in our study involves mainly macrophages that release anti-inflammatory factors, presumably in response to increased levels of inflammatory factors after the CSD 47, 48. This scenario is supported by in vitro studies showing that it is the anti-inflammatory macrophages that become more circular after exposure to LPS 49, and the view that pro-inflammatory macrophages are newly recruited cells 36, rather than classical resident cells that exist in the meninges and renew themselves throughout life 15, 50, 51. The complexity of distinguishing between activation of pro- or anti-inflammatory macrophages is that in vivo, any given macrophage can switch its activation state (from releasing pro-inflammatory factors such as IL-1, IL-6 and Il-23 to releasing anti-inflammatory factors such as IL-10) to the extent that it can facilitate both induction and resolution of inflammation 52. Given the latter, it may be over-simplistic to propose that activated meningeal macrophages trigger an inflammatory cascade that eventually activates the nociceptors (see below). We interpreted the second observation, that the number of macrophages in the imaged tissues did not increase after CSD, as suggesting that the meninges themselves are not inflamed to the extent that one would see after bacterial or viral meningitis, where the dura and pia are invaded by monocytes (including macrophages), neutrophils and T cells 45, 46. Synthesizing this information, we propose that the inflammatory/anti-inflammatory cascade that takes place in the meninges within the 40-minute period in which the headaches typically begin after aura/CSD, is limited to upregulation of pro-inflammatory and anti-inflammatory cytokines and chemokines capable of both facilitation and inhibition of the nociceptive drive, rather than the initiation of an adaptive immune response involving recruitment of cells from the blood.
Previous anatomical studies suggested that pial, dural and arachnoid DCs are located in areas that garner them access to CSF and to brain parenchyma 53. These studies gave rise to the notion that unlike dura macrophages, DCs sample the CSF, and that their activation may be triggered by their ability to detect endogenous and exogenous CSF-borne proteins such as myelin, toxins, or debris of damaged cells 22. Although we agree with the anatomical data that show that DCs are located in areas that give them access to the CSF, we are somewhat at odds with the view that their activation is triggered by the CSF sampling as dextran injections into the CSF did not appear to label DC in the pia, and likewise, dextran injections into the vascular system did not label DC in the dura. In the current study, pial macrophages, which are located in areas that give them access to sample the CSF, and pinocytose dextran injected into the CSF or cortex, were activated immediately after occurrence of CSD whereas pial, and arachnoid/dura DCs were all activated 12 minutes later. These observations raise the possibility that the activation of DC is secondary to the activation of pial macrophages by the CSD, a proposal supported by previous studies showing that activated macrophages can in turn activate DCs 54. Typically, activated DCs exit the tissue where they live and enter lymph nodes, where they stimulate naïve T cells 22. In the current experiment, however, activated DC did not seem to exit the meninges as they became immobile (and remained in the tissue they were in at the time the CSD wave had occurred) during the 40-minute period in which dural nociceptors usually become activated by CSD (Fig 6). We interpret their immobilization as a sign of activation 38, 39, and in agreement with previous studies 46, 55, suggest that a DC-mediated recruitment of T cells may take place locally in the meninges, although at a much later time than the brief period we observed. In the context of migraine aura, it is tempting to suggest that the activated DC stimulate the accumulation of T cells in the meninges, and in turn facilitate the ‘build-up’ of inflammatory response that may last for the 24-72 hours that a typical migraine attack lasts – a scenario we could not test in the current study.
Given that CSD activates, rather than inhibits meningeal nociceptors, it is more reasonable to assume that the activation of macrophages and dendritic cells create conditions that facilitate rather than resolve inflammation. If one accepts the notion that the maintenance of tissue homeostasis (such as phagocytosis of cellular debris generated during normal tissue remodeling) is performed by unstimulated macrophages (i.e., independent of immune-cell signaling), and that activated macrophages, which are classically considered part of a cell-mediated immune response, typically secrete a high-level of pro-inflammatory factors, one would be more inclined to adopt the view that the CSD-induced activation of pial and dural macrophages is more likely to increase inflammatory conditions in the exact environment in which meningeal nociceptors live. As explained above, we cannot rule out the possibility that some of the macrophage activation we observed included the anti-inflammatory alternative-activated macrophages. This intriguing idea, that CSD may give rise to reduced, rather than enhanced inflammatory conditions in the meninges, although judged less likely to play a role in the headache phase of migraine aura, deserves further attention. First, it may reflect the meninges' effort to maintain normalcy. Second it may play an inhibitory role in the development of chemical and/or mechanical sensitivity by the nociceptors—a concept never tested before. A therapeutic approach that promotes activation of alternative- over classically-activated macrophages in the meninges may be beneficial for counteracting the activation of the nociceptors by CSD.
In future studies, it may be important to determine whether activation of meningeal macrophages and DC by CSD is affected by sleep deprivation or stress, and even further, whether such activation can be induced independent of the aura or CSD, especially since these migraine triggers are commonly associated with reduced immunity and increased inflammation.
Acknowledgments
This research was supported by NIH grants R37 NS079678 and RO1 NS069847 (RB), and K24 NS064050 (DB) and by and a grant from R. Chemers Neustein to support Dr. Schain.
Footnotes
Author Contributions: AJS, AMC, DB, JG, AMS, and RB were responsible for study concept and design. AJS was responsible for acquisition and analyses of data. AJS, AM-C, and RB drafted the manuscript and figures.
Potential Conflicts of Interest: Authors have no conflicts of interest.
References
- 1.Stewart WF, Lipton RB, Celentano DD, Reed ML. Prevalence of migraine headache in the United States. Relation to age, income, race, and other sociodemographic factors. JAMA. 1992;267(1):64–9. [PubMed] [Google Scholar]
- 2.Lashley KS. Patterns of cerebral integration indicated by the scotomas of migraine. Arch Neurol Psychiatry. 1941;46:259–64. [Google Scholar]
- 3.Cutrer FM, Sorensen AG, Weisskoff RM, et al. Perfusion-weighted imaging defects during spontaneous migrainous aura. Annals of Neurology. 1998 Jan;43(1):25–31. doi: 10.1002/ana.410430108. [DOI] [PubMed] [Google Scholar]
- 4.Hansen JM, Lipton RB, Dodick DW, et al. Migraine headache is present in the aura phase: a prospective study. Neurology. 2012 Nov 13;79(20):2044–9. doi: 10.1212/WNL.0b013e3182749eed. [DOI] [PMC free article] [PubMed] [Google Scholar]
- 5.The International Classification of Headache Disorders re. The International Classification of Headache Disorders, 3rd edition (beta version) Cephalalgia. 2013 Jul;33(9):629–808. doi: 10.1177/0333102413485658. [DOI] [PubMed] [Google Scholar]
- 6.Leao A. Spreading depression of activity in cerebral cortex. J Neurophysiol. 1944;7:359–90. doi: 10.1152/jn.1947.10.6.409. [DOI] [PubMed] [Google Scholar]
- 7.Hadjikhani N, Sanchez Del Rio M, Wu O, et al. Mechanisms of migraine aura revealed by functional MRI in human visual cortex. Proc Natl Acad Sci U S A. 2001 Apr 10;98(8):4687–92. doi: 10.1073/pnas.071582498. [DOI] [PMC free article] [PubMed] [Google Scholar]
- 8.Sugaya E, Takato M, Noda Y. Neuronal and glial activity during spreading depression in cerebral cortex of cat. J Neurophysiol. 1975 Jul;38(4):822–41. doi: 10.1152/jn.1975.38.4.822. [DOI] [PubMed] [Google Scholar]
- 9.Andreou AP, Holland PR, Akerman S, Summ O, Fredrick J, Goadsby PJ. Transcranial magnetic stimulation and potential cortical and trigeminothalamic mechanisms in migraine. Brain. 2016 Jul;139(Pt 7):2002–14. doi: 10.1093/brain/aww118. [DOI] [PMC free article] [PubMed] [Google Scholar]
- 10.Eikermann-Haerter K, Yuzawa I, Qin T, et al. Enhanced subcortical spreading depression in familial hemiplegic migraine type 1 mutant mice. J Neurosci. 2011 Apr 13;31(15):5755–63. doi: 10.1523/JNEUROSCI.5346-10.2011. [DOI] [PMC free article] [PubMed] [Google Scholar]
- 11.Burstein R, Noseda R, Borsook D. Migraine: multiple processes, complex pathophysiology. J Neurosci. 2015 Apr 29;35(17):6619–29. doi: 10.1523/JNEUROSCI.0373-15.2015. [DOI] [PMC free article] [PubMed] [Google Scholar]
- 12.Zhang X, Levy D, Noseda R, Kainz V, Jakubowski M, Burstein R. Activation of meningeal nociceptors by cortical spreading depression: implications for migraine with aura. J Neurosci. 2010 Jun 30;30(26):8807–14. doi: 10.1523/JNEUROSCI.0511-10.2010. [DOI] [PMC free article] [PubMed] [Google Scholar]
- 13.Zhang X, Levy D, Kainz V, Noseda R, Jakubowski M, Burstein R. Activation of central trigeminovascular neurons by cortical spreading depression. Ann Neurol. 2011 May;69(5):855–65. doi: 10.1002/ana.22329. [DOI] [PMC free article] [PubMed] [Google Scholar]
- 14.Ousman SS, Kubes P. Immune surveillance in the central nervous system. Nat Neurosci. 2012 Jul 26;15(8):1096–101. doi: 10.1038/nn.3161. [DOI] [PMC free article] [PubMed] [Google Scholar]
- 15.Chinnery HR, Ruitenberg MJ, McMenamin PG. Novel characterization of monocyte-derived cell populations in the meninges and choroid plexus and their rates of replenishment in bone marrow chimeric mice. J Neuropathol Exp Neurol. 2010 Sep;69(9):896–909. doi: 10.1097/NEN.0b013e3181edbc1a. [DOI] [PubMed] [Google Scholar]
- 16.McMenamin PG, Wealthall RJ, Deverall M, Cooper SJ, Griffin B. Macrophages and dendritic cells in the rat meninges and choroid plexus: three-dimensional localisation by environmental scanning electron microscopy and confocal microscopy. Cell Tissue Res. 2003 Sep;313(3):259–69. doi: 10.1007/s00441-003-0779-0. [DOI] [PubMed] [Google Scholar]
- 17.McMenamin PG. Distribution and phenotype of dendritic cells and resident tissue macrophages in the dura mater, leptomeninges, and choroid plexus of the rat brain as demonstrated in wholemount preparations. Journal of Comparative Neurology. 1999;405(4):553–62. 3/22/1999. [PubMed] [Google Scholar]
- 18.Lavin Y, Mortha A, Rahman A, Merad M. Regulation of macrophage development and function in peripheral tissues. Nat Rev Immunol. 2015 Dec;15(12):731–44. doi: 10.1038/nri3920. [DOI] [PMC free article] [PubMed] [Google Scholar]
- 19.Brendecke SM, Prinz M. Do not judge a cell by its cover--diversity of CNS resident, adjoining and infiltrating myeloid cells in inflammation. Semin Immunopathol. 2015 Nov;37(6):591–605. doi: 10.1007/s00281-015-0520-6. [DOI] [PubMed] [Google Scholar]
- 20.Mosser DM, Edwards JP. Exploring the full spectrum of macrophage activation. Nat Rev Immunol. 2008 Dec;8(12):958–69. doi: 10.1038/nri2448. [DOI] [PMC free article] [PubMed] [Google Scholar]
- 21.Reis e Sousa C. Dendritic cells in a mature age. Nat Rev Immunol. 2006 Jun;6(6):476–83. doi: 10.1038/nri1845. [DOI] [PubMed] [Google Scholar]
- 22.Colton CA. Immune heterogeneity in neuroinflammation: dendritic cells in the brain. Journal of neuroimmune pharmacology: the official journal of the Society on NeuroImmune Pharmacology. 2013 Mar;8(1):145–62. doi: 10.1007/s11481-012-9414-8. [DOI] [PMC free article] [PubMed] [Google Scholar]
- 23.Pardutz A, Schoenen J. NSAIDs in the Acute Treatment of Migraine: A Review of Clinical and Experimental Data. Pharmaceuticals (Basel) 2010 Jun 17;3(6):1966–87. doi: 10.3390/ph3061966. [DOI] [PMC free article] [PubMed] [Google Scholar]
- 24.Lipton RB, Diamond S, Reed M, Diamond ML, Stewart WF. Migraine diagnosis and treatment: results from the American Migraine Study II. Headache. 2001 Jul-Aug;41(7):638–45. doi: 10.1046/j.1526-4610.2001.041007638.x. [DOI] [PubMed] [Google Scholar]
- 25.Lipton RB, Scher AI, Steiner TJ, et al. Patterns of health care utilization for migraine in England and in the United States. Neurology. 2003 Feb 11;60(3):441–8. doi: 10.1212/wnl.60.3.441. [DOI] [PubMed] [Google Scholar]
- 26.Antonova M, Wienecke T, Olesen J, Ashina M. Prostaglandins in migraine: update. Curr Opin Neurol. 2013 Jun;26(3):269–75. doi: 10.1097/WCO.0b013e328360864b. [DOI] [PubMed] [Google Scholar]
- 27.Franceschini A, Nair A, Bele T, van den Maagdenberg AM, Nistri A, Fabbretti E. Functional crosstalk in culture between macrophages and trigeminal sensory neurons of a mouse genetic model of migraine. BMC Neurosci. 2012 Nov 21;13:143. doi: 10.1186/1471-2202-13-143. [DOI] [PMC free article] [PubMed] [Google Scholar]
- 28.Yang G, Pan F, Parkhurst CN, Grutzendler J, Gan WB. Thinned-skull cranial window technique for long-term imaging of the cortex in live mice. Nature protocols. 2010 Feb;5(2):201–8. doi: 10.1038/nprot.2009.222. [DOI] [PMC free article] [PubMed] [Google Scholar]
- 29.Grutzendler J, Kasthuri N, Gan WB. Long-term dendritic spine stability in the adult cortex. Nature. 2002;420(6917):812–6. doi: 10.1038/nature01276. [DOI] [PubMed] [Google Scholar]
- 30.Charles AC, Baca SM. Cortical spreading depression and migraine. Nature reviews Neurology. 2013 Nov;9(11):637–44. doi: 10.1038/nrneurol.2013.192. [DOI] [PubMed] [Google Scholar]
- 31.Cox G. Biological applications of second harmonic imaging. Biophys Rev. 2011 Sep;3(3):131. doi: 10.1007/s12551-011-0052-9. [DOI] [PMC free article] [PubMed] [Google Scholar]
- 32.Gao YR, Drew PJ. Effects of Voluntary Locomotion and Calcitonin Gene-Related Peptide on the Dynamics of Single Dural Vessels in Awake Mice. J Neurosci. 2016 Feb 24;36(8):2503–16. doi: 10.1523/JNEUROSCI.3665-15.2016. [DOI] [PMC free article] [PubMed] [Google Scholar]
- 33.Jung S, Aliberti J, Graemmel P, et al. Analysis of fractalkine receptor CX(3)CR1 function by targeted deletion and green fluorescent protein reporter gene insertion. Mol Cell Biol. 2000 Jun;20(11):4106–14. doi: 10.1128/mcb.20.11.4106-4114.2000. [DOI] [PMC free article] [PubMed] [Google Scholar]
- 34.Bulloch K, Miller MM, Gal-Toth J, et al. CD11c/EYFP transgene illuminates a discrete network of dendritic cells within the embryonic, neonatal, adult, and injured mouse brain. The Journal of comparative neurology. 2008 Jun 10;508(5):687–710. doi: 10.1002/cne.21668. [DOI] [PubMed] [Google Scholar]
- 35.Larson SJ, Dunn AJ. Behavioral effects of cytokines. Brain Behav Immun. 2001 Dec;15(4):371–87. doi: 10.1006/brbi.2001.0643. [DOI] [PubMed] [Google Scholar]
- 36.Vereyken EJ, Heijnen PD, Baron W, de Vries EH, Dijkstra CD, Teunissen CE. Classically and alternatively activated bone marrow derived macrophages differ in cytoskeletal functions and migration towards specific CNS cell types. J Neuroinflammation. 2011 May 26;8:58. doi: 10.1186/1742-2094-8-58. [DOI] [PMC free article] [PubMed] [Google Scholar]
- 37.Vogel DY, Heijnen PD, Breur M, et al. Macrophages migrate in an activation-dependent manner to chemokines involved in neuroinflammation. J Neuroinflammation. 2014 Feb 01;11:23. doi: 10.1186/1742-2094-11-23. [DOI] [PMC free article] [PubMed] [Google Scholar]
- 38.Lindquist RL, Shakhar G, Dudziak D, et al. Visualizing dendritic cell networks in vivo. Nat Immunol. 2004 Dec;5(12):1243–50. doi: 10.1038/ni1139. [DOI] [PubMed] [Google Scholar]
- 39.Ng LG, Hsu A, Mandell MA, et al. Migratory dermal dendritic cells act as rapid sensors of protozoan parasites. PLoS Pathog. 2008 Nov;4(11):e1000222. doi: 10.1371/journal.ppat.1000222. [DOI] [PMC free article] [PubMed] [Google Scholar]
- 40.Yan J, Melemedjian OK, Price TJ, Dussor G. Sensitization of dural afferents underlies migraine-related behavior following meningeal application of interleukin-6 (IL-6) Mol Pain. 2012;8:6. doi: 10.1186/1744-8069-8-6. [DOI] [PMC free article] [PubMed] [Google Scholar]
- 41.Zhang XC, Kainz V, Burstein R, Levy D. Tumor necrosis factor-alpha induces sensitization of meningeal nociceptors mediated via local COX and p38 MAP kinase actions. Pain. 2011 Jan;152(1):140–9. doi: 10.1016/j.pain.2010.10.002. [DOI] [PMC free article] [PubMed] [Google Scholar]
- 42.Zhang X, Burstein R, Levy D. Local action of the proinflammatory cytokines IL-1beta and IL-6 on intracranial meningeal nociceptors. Cephalalgia. 2012 Jan;32(1):66–72. doi: 10.1177/0333102411430848. [DOI] [PMC free article] [PubMed] [Google Scholar]
- 43.Ji RR, Chamessian A, Zhang YQ. Pain regulation by non-neuronal cells and inflammation. Science (New York, NY. 2016 Nov 04;354(6312):572–7. doi: 10.1126/science.aaf8924. [DOI] [PMC free article] [PubMed] [Google Scholar]
- 44.Nayak D, Zinselmeyer BH, Corps KN, McGavern DB. In vivo dynamics of innate immune sentinels in the CNS. Intravital. 2012;1(2):95–106. doi: 10.4161/intv.22823. [DOI] [PMC free article] [PubMed] [Google Scholar]
- 45.Coles JA, Stewart-Hutchinson PJ, Myburgh E, Brewer JM. The mouse cortical meninges are the site of immune responses to many different pathogens, and are accessible to intravital imaging. Methods. 2017 Mar 27; doi: 10.1016/j.ymeth.2017.03.020. [DOI] [PMC free article] [PubMed] [Google Scholar]
- 46.Kim JV, Kang SS, Dustin ML, McGavern DB. Myelomonocytic cell recruitment causes fatal CNS vascular injury during acute viral meningitis. Nature. 2009 Jan 08;457(7226):191–5. doi: 10.1038/nature07591. [DOI] [PMC free article] [PubMed] [Google Scholar]
- 47.Reuter U, Bolay H, Jansen-Olesen I, et al. Delayed inflammation in rat meninges: implications for migraine pathophysiology. Brain. 2001;124(Pt 12):2490–502. doi: 10.1093/brain/124.12.2490. [DOI] [PubMed] [Google Scholar]
- 48.Karatas H, Erdener SE, Gursoy-Ozdemir Y, et al. Spreading depression triggers headache by activating neuronal Panx1 channels. Science (New York, NY. 2013 Mar 1;339(6123):1092–5. doi: 10.1126/science.1231897. [DOI] [PubMed] [Google Scholar]
- 49.Vogel DY, Glim JE, Stavenuiter AW, et al. Human macrophage polarization in vitro: maturation and activation methods compared. Immunobiology. 2014 Sep;219(9):695–703. doi: 10.1016/j.imbio.2014.05.002. [DOI] [PubMed] [Google Scholar]
- 50.Ajami B, Bennett JL, Krieger C, Tetzlaff W, Rossi FM. Local self-renewal can sustain CNS microglia maintenance and function throughout adult life. Nat Neurosci. 2007 Dec;10(12):1538–43. doi: 10.1038/nn2014. [DOI] [PubMed] [Google Scholar]
- 51.Mildner A, Schmidt H, Nitsche M, et al. Microglia in the adult brain arise from Ly-6ChiCCR2+ monocytes only under defined host conditions. Nat Neurosci. 2007 Dec;10(12):1544–53. doi: 10.1038/nn2015. [DOI] [PubMed] [Google Scholar]
- 52.Porcheray F, Viaud S, Rimaniol AC, et al. Macrophage activation switching: an asset for the resolution of inflammation. Clinical and experimental immunology. 2005 Dec;142(3):481–9. doi: 10.1111/j.1365-2249.2005.02934.x. [DOI] [PMC free article] [PubMed] [Google Scholar]
- 53.Prodinger C, Bunse J, Kruger M, et al. CD11c-expressing cells reside in the juxtavascular parenchyma and extend processes into the glia limitans of the mouse nervous system. Acta Neuropathol. 2011 Apr;121(4):445–58. doi: 10.1007/s00401-010-0774-y. [DOI] [PubMed] [Google Scholar]
- 54.Mazzini E, Massimiliano L, Penna G, Rescigno M. Oral tolerance can be established via gap junction transfer of fed antigens from CX3CR1(+) macrophages to CD103(+) dendritic cells. Immunity. 2014 Feb 20;40(2):248–61. doi: 10.1016/j.immuni.2013.12.012. [DOI] [PubMed] [Google Scholar]
- 55.Bartholomaus I, Kawakami N, Odoardi F, et al. Effector T cell interactions with meningeal vascular structures in nascent autoimmune CNS lesions. Nature. 2009 Nov 05;462(7269):94–8. doi: 10.1038/nature08478. [DOI] [PubMed] [Google Scholar]