Abstract
Objective:
To evaluate the intravoxel incoherent motion (IVIM) diffusion-weighted (DW) MRI for differentiating between benign and malignant musculoskeletal tumours at 3 T.
Methods:
65 patients with treatment-naïve musculoskeletal tumours (47 malignant and 23 benign lesions) who underwent 3 T MRI including IVIM DW imaging were included. IVIM-derived parameters included pure diffusion coefficient (D), perfusion related incoherent microcirculation (D*, pseudodiffusion coefficient), and perfusion fraction (f). IVIM parameters and mono-exponential apparent diffusion coefficient (ADC) were retrospectively measured by two independent musculoskeletal radiologists.
Results:
D and ADC values of malignant tumours (923 ± 360, 965 ± 353 µm2 s–1, respectively) were significantly lower than those of benign tumours (1668 ± 546, 1689 ± 526 µm2 s–1) (p < 0.001). F values of malignant tumours (9.6%) were significantly higher than those of benign tumours (7.2%) (p = 0.021), whereas D* values showed no significant difference (p > 0.05). The area under the receiver operating characteristic (ROC) curve of D, ADC and f were 0.874, 0.880 and 0.671, respectively. Using cut-off values of D and ADC of 1200 µm2 s–1, the sensitivity, specificity and accuracy were 92, 83, 89%, 92, 87 and 90%, respectively.
Conclusion:
D and ADC may be more accurate and reliable for differentiation of malignant from benign musculoskeletal tumours than f and D* at 3 T IVIM DW imaging.
Advances in knowledge:
Among IVIM-derived parameters, D is more accurate and reliable in differentiating malignant from benign musculoskeletal tumours than f and D* at 3.0T IVIM DW imaging. There was no significant difference in the diagnostic performance of D and ADC.
INTRODUCTION
It is not uncommon that we encounter the problematic cases in differentiation between benign and malignant musculoskeletal tumours in daily practice. There have been inconsistent reports using diffusion-weighted (DW) MRI for differentiating malignant from benign musculoskeletal tumours at 1.5 T.1–6 However, apparent diffusion coefficient (ADC) can be influenced not only by molecular diffusion but also through microcirculation; therefore, ADC might have a limitation in charactering the lesions.7,8 Recently, the intravoxel incoherent motion (IVIM) DW imaging has drawn attention. Using the IVIM model and sufficiently low multiple b-values (<200 s mm–2), microcirculation or perfusion related effects can be separated from pure tissue diffusion (D), and then perfusion characteristics (pseudodiffusion coefficient, D*) and their volume fraction (perfusion fraction, f) can be derived.8–11 Several previous studies7,11–17 have introduced the feasibility or diagnostic capacity of IVIM DW imaging in malignant tumours of pancreas, liver, kidney, prostate, salivary gland and breast. In the previous report5 using early IVIM DW imaging with five b-values (0, 176, 351, 526 and 701 s mm–2) at 1.5T was investigated in malignant and benign soft tissue tumours and suggested the significance of true diffusion coefficient. After a decade, according to the report by Koh et al,18 at least 6–8 b-values were recommended in total for practically optimal distribution: four or more b-values being recommended within the perfusion-sensitive range (<100–200 s mm–2) and fewer high b-values due to its stability and reproducibility. Thus, perfusion-sensitive information might be insufficient using two b-values less than 200 s mm–2. 19 There have been few reports regarding IVIM DW imaging with sufficient b-values for differentiating malignant from benign musculoskeletal tumours at 3 T MRI.
The purpose of our study was to evaluate the IVIM DW MRI for differentiating between benign and malignant musculoskeletal tumour at 3 T.
METHODS AND MATERIALS
Study population
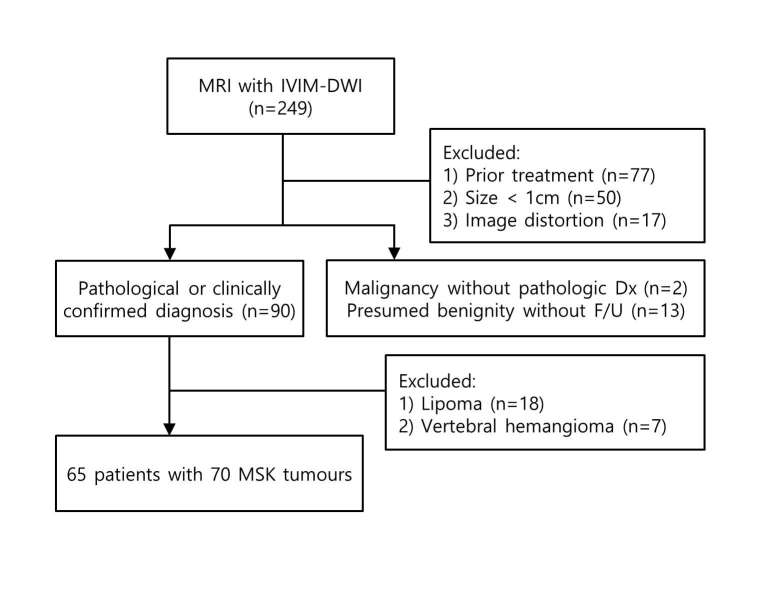
Our institutional review board approved this retrospective study and waived the patient informed consent. As a study coordinator, one musculoskeletal radiologist (J.Y.J.) with 6 years of musculoskeletal image interpretation experience collected the MRI and reviewed clinical history. Between August 2013 and March 2014, a total of 249 patients underwent 3 T MRI with IVIM-DW imaging for suspected musculoskeletal tumours in our institution (Figure 1). MR images of 184 patients were excluded according to the following exclusion criteria: (1) patients treated by chemotherapy or radiation therapy (n = 77); (2) patients with musculoskeletal tumours less than 1.0 cm in diameter (n = 50); (3) patients with unsatisfactory image quality or artefacts (n = 17); (4) patients with presumed benign tumours without more than 6 months follow-up (n = 13); (5) patients with presumed malignancy but who did not have pathological confirmation (n = 2); (6) patients with lipoma (n = 18) or vertebral haemangioma (n = 7), which are known as having poor outcome of DW imaging due to a fat portion.1, 11, 20 If presumed benign tumours without pathological confirmation showed no change on 6 months follow-up imaging and no occurrence of symptom, it was considered benign. Finally, 65 patients (mean age, 48.4 years; age range, 12–75 years) with 70 musculoskeletal tumours were included in our study. They were 35 males (mean age, 47.5 years; age range, 12–75 years) and 30 females (mean age, 49.4 years; age range, 19–74 years). All tumours had pathological confirmation except one case of fibrous dysplasia in femur.
Figure 1.
Flowchart showing the selection of the study population. DWI, diffusion-weighted imaging; Dx, diagnosis; F/U, follow up; IVIM, intravoxel incoherent motion; MSK, musculoskeletal.
MRI protocols
All patients underwent MR examination with 3 T MR imagers (MAGNETOM Verio, Siemens Healthcare, Erlangen, Germany). Standard MRI was obtained following our clinical protocol with phased-array coils or an eight-channel extremity coils depending on the anatomic regions: longitudinal fat-suppressed T2 weighted turbo spin-echo (TSE) sequence, axial T1 weighted TSE sequence, axial T2 weighted TSE sequences with and without fat-suppression and longitudinal and axial fat-suppressed contrast-enhanced T1 weighted TSE sequences (Table 1).
Table 1.
MRI parameters
| Parameters | Standard sequences | DWI (single shot) |
| Field of view | 80–220 mm | 80–220 mm |
| Matrix size | 512 × 256 | 64 × 45–120 × 128 |
| TR (ms)/ | T1 weighted images: 680 - 870/11–21 | 5000 - 8700/71–85 |
| TE (ms) | T2 weighted images: 4000 - 5600/63–83 | |
| Fat suppression | CHESS pulse | CHESS pulse |
| Section thickness | 2–5 mm | 2–5 mm |
| Intersection gap | No | No |
| Turbo factor or | T1weighted image: 3 | 56 |
| EPI factor | T2 weighted image: 13 | |
| Number of excitation | 1 | 3–5 |
CHESS, chemical shift selective; DWI, diffusion-weighted imaging; EPI, echo-planar imaging; TR/TE, relaxation time/echo time.
DW images were obtained prior to the contrast material administration by using a single-shot spin-echo echo-planar imaging pulse sequence prototype. The parallel imaging technique (generalized autocalibrating partially parallel acquisitions) with a two-fold acceleration factor was used to shorten echo train length. Encoding was performed in three orthogonal directions. A series of nine b-values (0, 25, 50, 75, 100, 200, 300, 500 and 800 s mm–2) was applied. The acquired DW imaging data was post-processed to obtain ADC and the IVIM-derived parameters including D, D* and f by using prototype software provided by the manufacturer (Siemens Healthcare, Erlangen, Germany). IVIM-derived parameters were calculated on a voxel-by-voxel basis by a fully bi-exponential non-linear fit according to the following equation proposed by Le Bihan et al:8
Each variable of this equation was defined as follows: S, mean signal intensity according to b-value; f, perfusion fraction or proportion of protons linked to microcirculation; D, diffusion coefficient; D*, pseudodiffusion.
MRI analysis
MR images were retrospectively assessed by two independent musculoskeletal radiologists (W,H,J., H.K.L. with 17 and 5 years of experience of musculoskeletal radiology, respectively). IVIM-derived parameters and ADC were retrospectively measured based on standard MRI to confirm the location and size of the lesion. Region of interest (ROI) was traced manually within the solid portion of the tumour based on standard MRI images, which showed hyperintense signal on high b-value DW images to encompass as much of the lesion as possible excluding the area of haemorrhage or necrosis on the representative section of ADC map. Most peripheral portion, artefacts, image distortions, and a partial volume effect were avoided. And then, the ROI was copied and pasted to the corresponding images of IVIM parameters. The average values of the two ROIs from two readers were respectively calculated to represent the lesion in IVIM-derived parameters and ADC maps. The bi-exponential signal decay curves were obtained using Matlab (MathWorks, Natick, MA).
Statistical analysis
Shapiro–Wilk test was performed for normality. ADC, D and f were non-parametric data, and Mann–Whitney U test was performed for comparison between benign and malignant musculoskeletal tumours, while two sample t-test were performed for comparison of D* that was parametric data. The diagnostic performance of the parameters was evaluated by using receiver operating characteristic (ROC) analysis. The areas under the ROC curve (AUC) were compared for significant difference between ADC and IVIM parameters. Interobserver agreement for the measurement was evaluated by the intraclass correlation coefficient (ICC) using a two-way mixed model with absolute agreement.21 ICC of less than 0.40 was indicative of poor agreement; 0.40–0.75, fair to good agreement; and more than 0.75, excellent agreement.22 P-value less than 0.05 was considered statistically significant. The statistical analyses were performed using SPSS v. 20.0 (SPSS Inc., Chicago, IL) and MedCalc v. 14.8.1.0 (MedCalc, Mariakerke, Belgium).
RESULTS
Among 70 musculoskeletal tumours, 47 tumours were malignant and 23 were benign. They were located in bone (n = 46), bone and soft tissue (n = 1) and soft tissue (n = 23). Distribution of pathological diagnosis is listed in Table 2.
Table 2.
Distribution of pathological diagnosis in musculoskeletal tumours
| Benign (23) | Malignant (47) | |
| Bone tumour (46) | Enchondroma (6) | Metastasis (25) |
| Aneurysmal bone cyst (1) | Multiple myeloma/plasmacytoma (5) | |
| Fibrous dysplasia (1) | Lymphoma (3) | |
| Chondrosarcoma (2) | ||
| Osteosarcoma (1) | ||
| Leukaemia (1) | ||
| Undifferentiated sarcoma (1) | ||
| Bone and soft tissue tumour (1) | Precursor B lymphoblastic leukaemia/Lymphoma (1) | |
| Soft tissue tumour (23) | Haemangioma (4) | Leiomyosarcoma (2) |
| Schwannoma (3) | Fibromyxoid sarcoma (1) | |
| Neurofibroma (3) | Malignant solitary fibrous tumour (1) | |
| Tenosynovial giant cell tumour (2) | Metastasis (1) | |
| Giant cell tumour of soft tissue (1) | Chronic myeloid leukaemia (1) | |
| Leiomyoma (1) | Squamous cell carcinoma (1) | |
| Intramuscular myxoma (1) | Undifferentiated sarcoma (1) |
The values are the number of tumours in parentheses.
IVIM analysis for the differentiation between benign and malignant musculoskeletal tumours
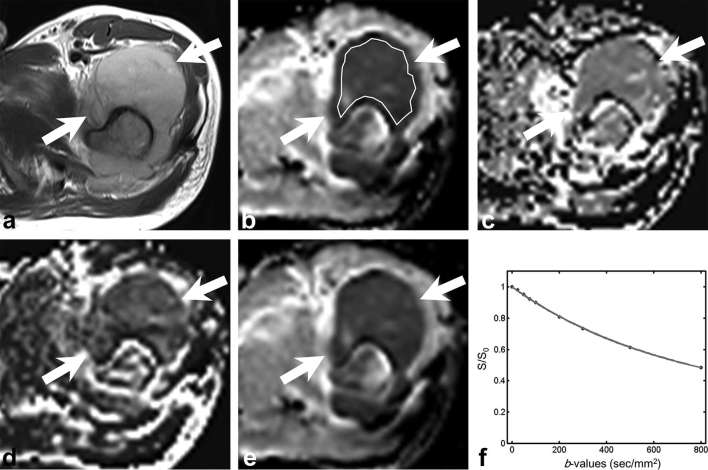
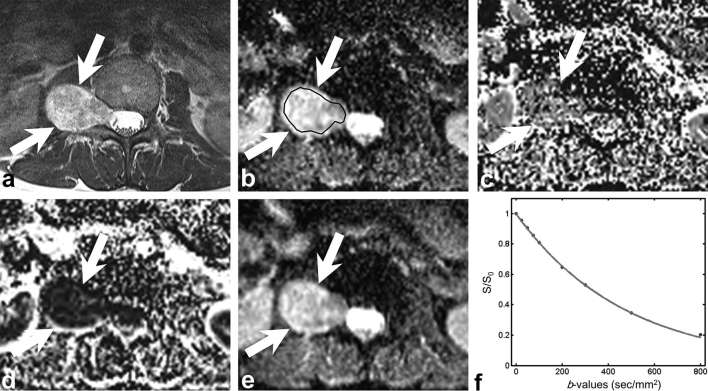
D and ADC values of malignant tumours (923 ± 360, 965 ± 353 µm2 s–1, respectively) were significantly lower than those of benign tumours (1668 ± 546, 1689 ± 526 µm2 s–1, respectively) (p < 0.001, p < 0.001, respectively) (Table 3). F values of malignant tumours (9.6%) were significantly higher than those of benign tumours (7.2%) (p = 0.021), whereas D* values showed no significant difference between the malignant and benign tumours (p = 0.651). Figures 2 and 3 show exemplary images and signal curves for malignant and benign musculoskeletal tumours, respectively.
Table 3.
Comparison of ADC and IVIM parameters between benign and malignant musculoskeletal tumours
| Parameter | Benign | Malignant | p-value |
| ADC (μm2 s–1) | 1689 ± 526 | 965 ± 353 | <0.001 |
| D (μm2 s–1) | 1668 ± 546 | 923 ± 360 | <0.001 |
| D* (μm2 s–1) | 2629 ± 556 | 2552 ± 719 | 0.651 |
| f (%) | 7.18 ± 3.60 | 9.56 ± 4.16 | 0.021 |
ADC, apparent diffusion coefficient; D, pure diffusion coefficient; D*, pseudodiffusion coefficient; f, perfusion fraction; IVIM, intravoxel incoherent motion.
Figure 2.
A 28-year-old male with undifferentiated sarcoma. (a) Axial T2 weighted image shows the hyperintense mass (arrow) with large soft tissue component in the left proximal femur. (b–e) Parametric maps (D map, D* map, f map and ADC map, respectively). Mean D, D*, f and ADC values of the lesion were 823 µm2 s–1, 2325 µm2 s–1, 5.8% and 854 µm2 s–1, respectively. ROI was traced manually within the solid portion of the tumour to encompass as much of the lesion as possible avoiding the area of haemorrhage or necrosis. (f) Signal decay curve shows rather gentle signal decay on both low and high b-values. ADC, apparent diffusion coefficient; ROI, region of interest.
Figure 3.
A 43-year-old female with schwannoma. (a) Axial fat-suppressed contrast-enhanced T1 weighted image shows the right paravertebral mass (arrow) with intense enhancement. (b–e) Parametric maps (D map, D* map, f map and ADC map, respectively). Mean D, D*, f and ADC values of the lesion were 2100 µm2 s–1, 2495 µm2 s–1, 6.5% and 2089 µm2 s–1, respectively. ROI was traced manually within the solid portion of the tumour to encompass as much of the lesion as possible avoiding the area of haemorrhage or necrosis. (f) Signal decay curve shows rather steep signal decay on high b-values. ADC, apparent diffusion coefficient; ROI, region of interest.
In the differential diagnosis of malignant from benign tumours, D and ADC showed good diagnostic performance {AUC, 0.874 [95% CI (0.776–0.972)], 0.880 (0.781–0.979), respectively} and f showed poor diagnostic performance [AUC 0.671 (0.535–0.806)]. There was no significant difference in the diagnostic performance of D and ADC (p = 0.53) (Figure 4). Using cut-off value of 1200 µm2 s–1 in D, the sensitivity, specificity and accuracy were 91.5, 82.6 and 88.6%, respectively. Using cut-off value of 1200 µm2 s–1 in ADC, the sensitivity, specificity and accuracy were 91.5, 87.0 and 90.0%, respectively. Table 4 shows the diagnostic performance using cut-off value of 1200 µm2 s–1 in both D and ADC in each reader. Figure 5 shows the scatter plot of D values in both benign and malignant musculoskeletal tumours.
Figure 4.
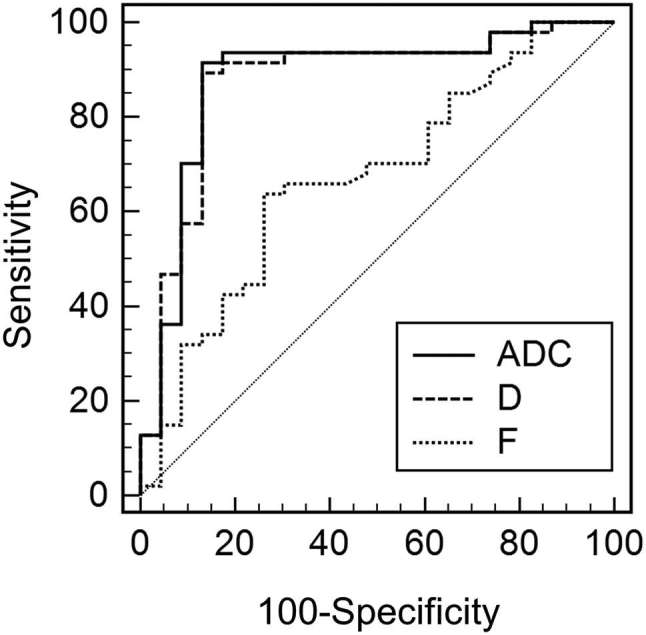
The ROC curves of Dand f, and ADC for differentiating malignant from benign musculoskeletal tumours. The areas under the curves were 0.880, 0.874 and 0.671, for ADC, D and f, respectively. There was no significant difference in the diagnostic performance of D and ADC (p = 0.53). ADC, apparent diffusion coefficient; ROI, region of interest.
Table 4.
Diagnostic performance for differentiating benign and malignant musculoskeletal tumours
| Parameter | Cut-off value | Reader | Sensitivity (%) | Specificity (%) | Accuracy (%) | |||
| ADC (μm2 s–1) | 1200 | R1 | 89 (42/47) | [81, 98] | 83 (19/23) | [67, 98] | 87 (61/70) | [79, 95] |
| R2 | 91 (43/47) | [84, 99] | 87 (20/23) | [73, 100] | 90 (63/70) | [83, 97] | ||
| D (μm2 s–1) | 1200 | R1 | 87 (41/47) | [78, 97] | 83 (19/23) | [67, 98] | 86 (60/70) | [78, 94] |
| R2 | 91 (43/47) | [84, 99] | 87 (20/23) | [73, 100] | 90 (63/70) | [83, 97] |
ADC, apparent diffusion coefficient; D, pure diffusion coefficient.
Data are percentages, with raw data in parentheses and 95% confidence intervals in brackets.
Figure 5.
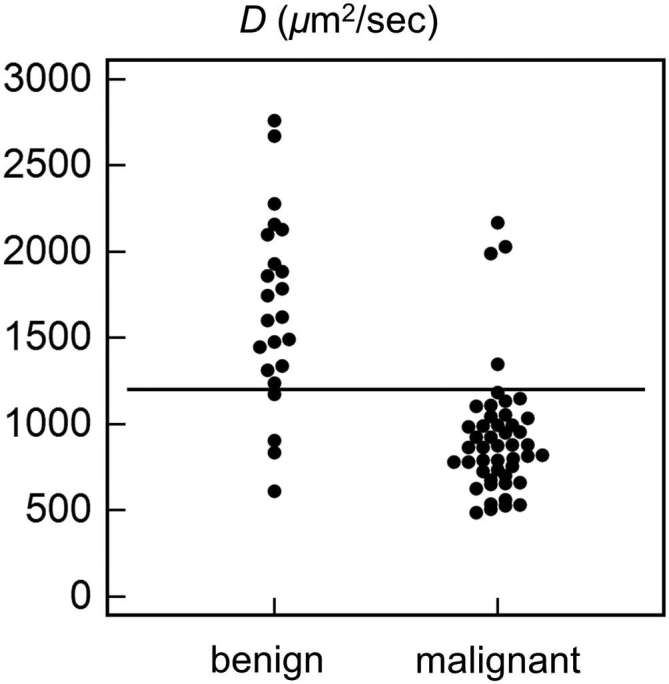
Dot plot showing the distribution of D values in benign and malignant musculoskeletal tumours. Using cut-off value of 1200 µm2 s–1 (horizontal line), the sensitivity, specificity and accuracy were 91.5, 82.6 and 88.6%, respectively.
Interobserver agreement of ADC and D were excellent: ICC = 0.972–0.989 for ADC, and ICC = 0.965–0.987 for D. Interobserver agreement of D* was poor to excellent: ICC = 0.386–0.764. Interobserver agreement of f was good to excellent: ICC = 0.588–0.841.
Subgroup analysis for the differentiation between benign and non-metastatic malignant musculoskeletal tumours
Among 47 malignant musculoskeletal tumours, 26 tumours were metastases and 21 were non-metastatic tumours. D and ADC values of non-metastatic malignant tumours (1008 ± 481, 1048 ± 472 µm2 s–1, respectively) were significantly lower than those of benign tumours (1668 ± 546, 1689 ± 526 µm2 s–1, respectively) (p < 0.001). D* and f values showed no significant difference between the nonmetastatic malignant and benign tumours (p = 0.666 and 0.329, respectively).
Analysis of false negative and false positive cases
Using cut-off value of 1200 µm2 s–1 in D, there were four false negative cases in malignant tumours: chondrosarcoma (n = 2), low-grade fibromyxoid sarcoma (n = 1) and metastasis (n = 1). Except one case of metastasis from hepatocellular carcinoma (D value, 1349 µm2 s–1), three false negative cases had myxoid or cartilaginous components with a mean D value of 2063 µm2 s–1 (2168, 1992 and 2028 µm2 s–1, respectively). Among benign and malignant musculoskeletal tumours, the highest D values more than 1800 µm2 s–1 were obtained from myxoid tumours (neurofibroma, schwannoma, fibromyxoid sarcoma, intramuscular myxoma, mean D value of 2218 µm2 s–1), cartilaginous tumours (enchondroma, chondrosarcoma, mean D value of 2047 µm2 s–1) and aneurysmal bone cyst (D value, 2763 µm2 s–1). Among four benign tumours with mean D values below the cut-off values of 1200 µm2 s–1, three lesions were giant cell tumours (mean D value, 785 µm2 s–1) and the other was fibrous dysplasia (1176 µm2 s–1).
DISCUSSION
Our study showed that IVIM-derived D and ADC were useful for differentiating malignant from benign musculoskeletal tumours at 3 T IVIM DW MRI. D and ADC showed the highest diagnostic performance in the differentiation of malignant from benign tumours, and no significant differences in diagnostic performance. There have been reports6, 23 that the ADC values of benign and malignant soft tissue tumours overlap and are therefore not useful to differentiate them, and this overlap is caused not only by contamination from vascular component but also by extracellular matrix component. On the other hand, other studies2, 5, 24 reported that DW imaging can differentiate malignant from benign musculoskeletal tumours, because the malignant tumours tend to have more impeded water diffusivity due to more cellularity than benign tumours. In addition, the extracellular matrix component affects D value, which reflects tissue diffusivity, and therefore there might be overlap in D values between malignant and benign musculoskeletal tumours.
Rijswijk et al5 investigated the soft tissue tumours (10 malignant and 12 benign soft tissue masses) using early IVIM DW imaging with five b-values (0, 176, 351, 526 and 701 s mm–2) at 1.5 T. They reported that the D values of malignant tumours (1080 ± 230 µm2 s–1) were significantly lower than those of benign tumour (1710 ± 260 µm2 s–1), whereas ADC values between these groups were not significantly different (1300 ± 220 µm2 s–1 vs 1780 ± 240 µm2 s–1). They suggested that the contribution of perfusion to ADC values could be the reason for the difference. They presented the overlap of D values in the cases of myxoid malignant tumours or aggressive fibromatosis. However, in our study, ADC values showed a significant difference between malignant and benign musculoskeletal tumours. We assume that early IVIM DW imaging with five b-values and fewer b-values within the perfusion-sensitive range might be one of the reasons for the difference. However, in the scope of this study, it was not investigated whether the ADC computed from a reduced number of b-values would also result in similar diagnostic performance as the ADC based on the IVIM DW imaging scan protocol, which, therefore, remains to be examined in future works. It could be related to the small patient number with malignant soft tissue tumours including three myxoid malignant tumours (two myxoid liposarcomas and one low grade myxofibrosarcoma) out of 10 malignant soft tissue tumours in their study.5
Similar to our false negative cases for the malignant tumours, the previous studies2, 23, 24 reported that diffusion coefficients of myxoid tumours were higher than those of benign tumours because of high mucin and low collagen contents of the tumour. In addition, cartilaginous tumours have high true diffusion coefficient values due to high chondroid matrix content of the tumour in both malignant and benign tumours.2 In our study, the false positive cases for the malignant tumours were giant cell tumours and fibrous dysplasia. Giant cell tumours contain histiocytes, multinucleated giant cells, hemosiderin granules and collagenous strands, which result in reducing the extracellular space with a concomitant decrease in true diffusion coefficient values and ADC.2, 25, 26 Fibrous dysplasia has varying T2 signal intensities depending on the amount of bony trabeculae, cystic components, haemorrhage, cellularity and collagen.27, 28 Like the previous study by Hayashida et al,28 in our study, fibrous dysplasia showed a cystic portion as well as T2 hypointense solid portion, which seems to attribute to the impeded water diffusivity. Two readers of our study showed a discrepancy in measurement of D value according to ROI location with and without inclusion of cystic and fibrous tissues portion on standard MRI (1284 vs 1068 µm2 s–1). Thus, ROI should be located in the corresponding portion with high signal on high b-value images and the solid area on standard MRI. However, these false positive and false negative cases could be easily diagnosed based on standard MRI. Since IVIM DW images are interpreted combined with standard MRI in practice, the overlaps could be overcome. Aneurysmal bone cyst was the benign tumour that had the highest ADC and D values in our study like the previous study.28, 29
Our study showed that D was a useful parameter in differentiating malignant from benign musculoskeletal tumours. Impeded water diffusivity due to high cellularity of malignant tumours seemed to be well-reflected except the false positive and false negative cases. However, f and D* were not significant diagnostic values in differentiation. In the previous study by Kang et al,14 f and D* were more valuable parameters in the differentiation of pancreatic adenocarcinomas from neuroendocrine tumours than were ADC and D. In the previous study by Yoon et al,30 D* showed better diagnostic performance than ADC for differentiating significant hepatic fibrosis from normal or early hepatic fibrosis. The reason that f and D* were not useful parameters in our study may be heterogeneity of the benign and malignant musculoskeletal tumours because our study group could include not only hypervascular malignant and hypovascular benign tumours but also hypovascular malignant and hypervascular benign tumours. There is a need for further studies on availability of distinguishing disease from its mimickers in the cases of challenging differential diagnosis or prediction of histological grading.
Our study has several limitations. First, because this was a retrospective study, there might have been selection bias. We recruited consecutive patients who satisfied the inclusion criteria to avoid selection bias. Second, the study population was small, particularly in benign musculoskeletal tumours. This was related that our orthopaedic surgeons favour the conservative treatment for the definite benign tumours based on MRI. Third, pathological confirmation was not available in one case of fibrous dysplasia. However, we believe that clinical and imaging follow-up of fibrous dysplasia would be sufficient to conclude the benignity of the tumour. Fourth, the ROIs might include tiny mineralization or calcifications that affect ADC or IVIM-related parameters.
In conclusion, IVIM-derived D and ADC may be more accurate and reliable for the differentiation of malignant from benign musculoskeletal tumours than f and D* at 3 T IVIM DW imaging.
ACKNOWLEDGMENTS
The authors thank Siemens Healthcare for providing the prototype software that was used for IVIM and ADC analysis.
Contributor Information
Hyun Kyong Lim, Email: dearyouni@gmail.com.
Won-Hee Jee, Email: whjee12@gmail.com.
Joon-Yong Jung, Email: messengr@catholic.ac.kr.
Mun Young Paek, Email: munyoung.paek@siemens.com.
InSeong Kim, Email: inseong.kim@siemens.com.
Chan-Kwon Jung, Email: ckjung@catholic.ac.kr.
Yang-Guk Chung, Email: ygchung@catholic.ac.kr.
REFERENCES
- 1.Khoo MM, Tyler PA, Saifuddin A, Padhani AR. Diffusion-weighted imaging (DWI) in musculoskeletal MRI: a critical review. Skeletal Radiol 2011; 40: 665–81. doi: https://doi.org/10.1007/s00256-011-1106-6 [DOI] [PubMed] [Google Scholar]
- 2.Costa FM, Ferreira EC, Vianna EM. Diffusion-weighted magnetic resonance imaging for the evaluation of musculoskeletal tumors. Magn Reson Imaging Clin N Am 2011; 19: 159–80. doi: https://doi.org/10.1016/j.mric.2010.10.007 [DOI] [PubMed] [Google Scholar]
- 3.Sung JK, Jee WH, Jung JY, Choi M, Lee SY, Kim YH, et al. Differentiation of acute osteoporotic and malignant compression fractures of the spine: use of additive qualitative and quantitative axial diffusion-weighted MR imaging to conventional MR imaging at 3.0 T. Radiology 2014; 271: 488–98. doi: https://doi.org/10.1148/radiol.13130399 [DOI] [PubMed] [Google Scholar]
- 4.Baur A, Stäbler A, Brüning R, Bartl R, Krödel A, Reiser M, et al. Diffusion-weighted MR imaging of bone marrow: differentiation of benign versus pathologic compression fractures. Radiology 1998; 207: 349–56. doi: https://doi.org/10.1148/radiology.207.2.9577479 [DOI] [PubMed] [Google Scholar]
- 5.van Rijswijk CS, Kunz P, Hogendoorn PC, Taminiau AH, Doornbos J, Bloem JL. Diffusion-weighted MRI in the characterization of soft-tissue tumors. J Magn Reson Imaging 2002; 15: 302–7. doi: https://doi.org/10.1002/jmri.10061 [DOI] [PubMed] [Google Scholar]
- 6.Einarsdóttir H, Karlsson M, Wejde J, Bauer HC. Diffusion-weighted MRI of soft tissue tumours. Eur Radiol 2004; 14: 959–63. doi: https://doi.org/10.1007/s00330-004-2237-0 [DOI] [PubMed] [Google Scholar]
- 7.Chandarana H, Lee VS, Hecht E, Taouli B, Sigmund EE. Comparison of biexponential and monoexponential model of diffusion weighted imaging in evaluation of renal lesions: preliminary experience. Invest Radiol 2011; 46: 285–91. doi: https://doi.org/10.1097/RLI.0b013e3181ffc485 [DOI] [PubMed] [Google Scholar]
- 8.Le Bihan D, Breton E, Lallemand D, Aubin ML, Vignaud J, Laval-Jeantet M. Separation of diffusion and perfusion in intravoxel incoherent motion MR imaging. Radiology 1988; 168: 497–505. doi: https://doi.org/10.1148/radiology.168.2.3393671 [DOI] [PubMed] [Google Scholar]
- 9.Le Bihan D, Breton E, Lallemand D, Grenier P, Cabanis E, Laval-Jeantet M. MR imaging of intravoxel incoherent motions: application to diffusion and perfusion in neurologic disorders. Radiology 1986; 161: 401–7. doi: https://doi.org/10.1148/radiology.161.2.3763909 [DOI] [PubMed] [Google Scholar]
- 10.Wirestam R, Borg M, Brockstedt S, Lindgren A, Holtås S, Ståhlberg F. Perfusion-related parameters in intravoxel incoherent motion MR imaging compared with CBV and CBF measured by dynamic susceptibility-contrast MR technique. Acta Radiol 2001; 42: 123–8. doi: https://doi.org/10.1080/028418501127346459 [PubMed] [Google Scholar]
- 11.Iima M, Le Bihan D. Clinical Intravoxel Incoherent Motion and Diffusion MR Imaging: Past, Present, and Future. Radiology 2016; 278: 13–32. doi: https://doi.org/10.1148/radiol.2015150244 [DOI] [PubMed] [Google Scholar]
- 12.Andreou A, Koh DM, Collins DJ, Blackledge M, Wallace T, Leach MO, et al. Measurement reproducibility of perfusion fraction and pseudodiffusion coefficient derived by intravoxel incoherent motion diffusion-weighted MR imaging in normal liver and metastases. Eur Radiol 2013; 23: 428–34. doi: https://doi.org/10.1007/s00330-012-2604-1 [DOI] [PubMed] [Google Scholar]
- 13.Iima M, Yano K, Kataoka M, Umehana M, Murata K, Kanao S, et al. Quantitative non-Gaussian diffusion and intravoxel incoherent motion magnetic resonance imaging: differentiation of malignant and benign breast lesions. Invest Radiol 2015; 50: 205–11. doi: https://doi.org/10.1097/RLI.0000000000000094 [DOI] [PubMed] [Google Scholar]
- 14.Kang KM, Lee JM, Yoon JH, Kiefer B, Han JK, Choi BI. Intravoxel incoherent motion diffusion-weighted MR imaging for characterization of focal pancreatic lesions. Radiology 2014; 270: 444–53. doi: https://doi.org/10.1148/radiol.13122712 [DOI] [PubMed] [Google Scholar]
- 15.Sumi M, Van Cauteren M, Sumi T, Obara M, Ichikawa Y, Nakamura T. Salivary gland tumors: use of intravoxel incoherent motion MR imaging for assessment of diffusion and perfusion for the differentiation of benign from malignant tumors. Radiology 2012; 263: 770–7. doi: https://doi.org/10.1148/radiol.12111248 [DOI] [PubMed] [Google Scholar]
- 16.Woo S, Lee JM, Yoon JH, Joo I, Han JK, Choi BI. Intravoxel incoherent motion diffusion-weighted MR imaging of hepatocellular carcinoma: correlation with enhancement degree and histologic grade. Radiology 2014; 270: 758–67. doi: https://doi.org/10.1148/radiol.13130444 [DOI] [PubMed] [Google Scholar]
- 17.Yoon JH, Lee JM, Yu MH, Kiefer B, Han JK, Choi BI. Evaluation of hepatic focal lesions using diffusion-weighted MR imaging: comparison of apparent diffusion coefficient and intravoxel incoherent motion-derived parameters. J Magn Reson Imaging 2014; 39: 276–85. doi: https://doi.org/10.1002/jmri.24158 [DOI] [PubMed] [Google Scholar]
- 18.Koh DM, Collins DJ, Orton MR. Intravoxel incoherent motion in body diffusion-weighted MRI: reality and challenges. AJR Am J Roentgenol 2011; 196: 1351–61. doi: https://doi.org/10.2214/AJR.10.5515 [DOI] [PubMed] [Google Scholar]
- 19.Noij DP, Martens RM, Marcus JT, de Bree R, Leemans CR, Castelijns JA, et al. Intravoxel incoherent motion magnetic resonance imaging in head and neck cancer: a systematic review of the diagnostic and prognostic value. Oral Oncol 2017; 68: 81–91. doi: https://doi.org/10.1016/j.oraloncology.2017.03.016 [DOI] [PubMed] [Google Scholar]
- 20.Mulkern RV, Schwartz RB. In re: characterization of benign and metastatic vertebral compression fractures with quantitative diffusion MR imaging. AJNR Am J Neuroradiol 2003; 24: 1489–90. [PMC free article] [PubMed] [Google Scholar]
- 21.Koo TK, Li MY. A guideline of selecting and reporting intraclass correlation coefficients for reliability research. J Chiropr Med 2016; 15: 155–63. doi: https://doi.org/10.1016/j.jcm.2016.02.012 [DOI] [PMC free article] [PubMed] [Google Scholar]
- 22.Fleiss JL. The design and analysis of clinical experiments. New York, NY: The British Institute of Radiology.; 1986. [Google Scholar]
- 23.Maeda M, Matsumine A, Kato H, Kusuzaki K, Maier SE, Uchida A, et al. Soft-tissue tumors evaluated by line-scan diffusion-weighted imaging: influence of myxoid matrix on the apparent diffusion coefficient. J Magn Reson Imaging 2007; 25: 1199–204. doi: https://doi.org/10.1002/jmri.20931 [DOI] [PubMed] [Google Scholar]
- 24.Lee SY, Jee WH, Jung JY, Park MY, Kim SK, Jung CK, et al. Differentiation of malignant from benign soft tissue tumours: use of additive qualitative and quantitative diffusion-weighted MR imaging to standard MR imaging at 3.0 T. Eur Radiol 2016; 26: 743–54. doi: https://doi.org/10.1007/s00330-015-3878-x [DOI] [PubMed] [Google Scholar]
- 25.Nagata S, Nishimura H, Uchida M, Sakoda J, Tonan T, Hiraoka K, et al. Diffusion-weighted imaging of soft tissue tumors: usefulness of the apparent diffusion coefficient for differential diagnosis. Radiat Med 2008; 26: 287–95. doi: https://doi.org/10.1007/s11604-008-0229-8 [DOI] [PubMed] [Google Scholar]
- 26.Lee MY, Jee WH, Jung CK, Yoo I, Chung YG. Giant cell tumor of soft tissue: a case report with emphasis on MR imaging. Skeletal Radiol 2015; 44: 1039–43. doi: https://doi.org/10.1007/s00256-015-2140-6 [DOI] [PubMed] [Google Scholar]
- 27.Jee WH, Choi KH, Choe BY, Park JM, Shinn KS. Fibrous dysplasia: MR imaging characteristics with radiopathologic correlation. AJR Am J Roentgenol 1996; 167: 1523–7. doi: https://doi.org/10.2214/ajr.167.6.8956590 [DOI] [PubMed] [Google Scholar]
- 28.Hayashida Y, Hirai T, Yakushiji T, Katahira K, Shimomura O, Imuta M, et al. Evaluation of diffusion-weighted imaging for the differential diagnosis of poorly contrast-enhanced and T2-prolonged bone masses: Initial experience. J Magn Reson Imaging 2006; 23: 377–82. doi: https://doi.org/10.1002/jmri.20512 [DOI] [PubMed] [Google Scholar]
- 29.Pekcevik Y, Kahya MO, Kaya A. Diffusion-weighted magnetic resonance imaging in the diagnosis of bone tumors: preliminary results. J Clin Imaging Sci 2013; 3: . doi: https://doi.org/10.4103/2156-7514.124094 [DOI] [PMC free article] [PubMed] [Google Scholar]
- 30.Yoon JH, Lee JM, Baek JH, Shin CI, Kiefer B, Han JK, et al. Evaluation of hepatic fibrosis using intravoxel incoherent motion in diffusion-weighted liver MRI. J Comput Assist Tomogr 2014; 38: 110–6. doi: https://doi.org/10.1097/RCT.0b013e3182a589be [DOI] [PubMed] [Google Scholar]


