Abstract
Recent advances in multivariate statistical analysis of blood oxygen level dependent (BOLD) functional magnetic resonance imaging (fMRI) have provided novel insights into the network organization of the human brain. Here, we applied group independent component analysis, a well-established approach for detecting brain intrinsic connectivity networks, to examine the spontaneous BOLD fluctuations in patients with fibromyalgia and healthy controls before and after exposure to a stressor. The BOLD spectral power characteristics of component time courses were calculated using the fast Fourier transform (FFT) algorithm, and group comparison was performed at six frequency bins between 0 and 0.24 Hz at 0.04 Hz intervals. Relative to controls, patients with fibromyalgia displayed significant BOLD spectral power differences in the default-mode, salience, and subcortical networks at the baseline level (PBonferroni–corrected < 0.05). Multivariate analysis of covariance (MANCOVA) further revealed significant effects of the cold water temperature, and pain rating on the spectral power of the sensorimotor, salience, and prefrontal networks, while the diagnosis of fibromyalgia influenced the BOLD spectral power of the salience and subcortical networks (PFDR–corrected < 0.05). Since the BOLD spectral power reflects the degree of fluctuations within a network, future studies of the correlation between BOLD spectral power and pain processing can cast additional light on the nature of the central nervous system dysfunction in patients with chronic pain syndromes.
I. INTRODUCTION
Fibromyalgia is a debilitating condition characterized by chronic widespread musculoskeletal pain and tenderness, fatigue and cognitive impairments. It affects on average 2.7% of the global population [1]. Previous fMRI studies of fibromyalgia have demonstrated alteration in brain activity in specific cerebral regions related to pain processing including the sensorimotor, insular, and cingulate cortices [2], [3]. However, studies are ongoing to fully elucidate the neural correlates subserving allodynia and hyperalgesia in fibromyalgia.
The aim of the present study was to characterize the differences in the spectral properties of the BOLD signals within the brain networks between patients with fibromyalgia and healthy controls. We devised a unique resting-state fMRI paradigm based on a standard cold pressor test and applied group independent component analysis (ICA) [4] to unravel brain’s intrinsic connectivity networks (ICNs) [5]. Since fibromyalgia symptoms have been widely hypothesized to be associated with dysfunction of the autonomic nervous system, and sensitization of the central nervous system, we hypothesized that BOLD spectral power of ICN time courses would be significantly different in patients with fibromyalgia and healthy controls in brain areas involved in monitoring the salience of interoceptive [6] and external events including the insula, anterior cingulate, and other limbic areas.
II. MATERIALS AND METHODS
A. Participants
Twenty-four right-handed female participants took part in this study after providing a written informed consent approved by the Institutional Review Board of the Stanford School of Medicine, and in accordance with the Declaration of Helsinki. Data from five participants were excluded due to excessive head motion or MR image artifacts. Of the nineteen remaining participants, eight were patients with fibromyalgia (mean age ± SD = 40.36 ± 9.91 years) and eleven were healthy controls (mean age ± SD = 43.13 ± 13.70 years). Patients with fibromyalgia met the American College of Rheumatology criteria for fibromyalgia [7], had symptoms more than 6 months, and experienced average pain intensity greater than 2 on a 0 – 10 scale, where 0 was “no pain” and 10 was “pain as bad as could be”. Exclusion criteria were the use of opioid medications, severe psychiatric conditions, previous head injury, and any MRI incompatibility.
B. Neuroimaging Data Acquisition
Neuroimaging data were acquired on a General Electric (GE) Discovery MR750 whole-body 3.0 Tesla MRI scanner (GE Healthcare, WI, USA) at the Stanford Lucas Center with a standard 8-channel receive-only head coil. Resting-state scans with the cold pressor test (CPT; see below) were collected using a T2*-sensitive gradient echo spiral in/out pulse sequence (TR 2000 ms, TE 30 ms, flip angle 76°, FOV 26.0 cm, 31 oblique slices with 4.0 mm slice thickness and 0.5 mm interslice gap parallel to the AC-PC line and covering the whole brain). Collected fMRI data from each participant were split into three data sets: (i) prior to CPT, (11) CPT, and (iii) post CPT. The pre- and post-CPT data (each containing 155 volumes; 310 time points) were used for analysis. Additionally, whole-brain T1-weighted high-resolution structural images were obtained with 3D IR-prepared FSPGR BRAVO sequence (TR 6.76 ms, TE 2.58 ms, slice thickness 1.0 mm, flip angle 11°, FOV 22.0 cm, matrix 256 × 256, and NEX 2) to coregister and normalize functional images with a standardized template.
C. Cold Pressor Test Experimental Procedure
Participants were instructed to rest with their eyes closed, to try not to fall asleep and to remain still in the scanner during the 12-minute scan. One of the study staff remained in the scanner room during the scan to facilitate the placement of the subject’s foot into cold water at the mid-point of the scan. Prior to the scan, a rigid plastic container (approximate dimensions: 30 cm long, 20 cm wide and 15 cm deep) was filled with cold water. The temperature of the water (target temperature 10°C) was measured and recorded before bringing the container of water into the scanner room. The study staff used the scanner time to know when to initiate the cold water immersion. During the cold water immersion, the study staff lift the participant’s bent right leg and placed the right foot into the cold water of the container resting on the scanner bed. At the end of the one-minute immersion, the study staff lifted the foot out of the cold water, placed it back on the scanner bed and draped a dry towel around the foot. The passive motion of the leg into the cold water was demonstrated prior to the scan by the study staff to prevent any confusion during the scan. At the end of the scan, the participants rated their pain during the CPT on a 0 (no pain) to 10 (unbearable pain) scale.
D. Neuroimaging Data Analysis
Neuroimaging data were preprocessed using the Statistical Parametric Mapping software package (SPM12, Wellcome Department of Cognitive Neurology, London, UK). The preprocessing procedure consisted of the realignment and unwrapping to correct for head motions and MR susceptibility artifacts, slice-timing correction, coregistration with the T1-weighted high-resolution structural images and spatial normalization to the standard stereotactic Montreal Neurological Institute (MNI) space, spatial smoothing with a Gaussian kernel of FWHM of 6 mm, and intensity normalization to improve ICA accuracy [8].
Group independent component analysis was carried out on the preprocessed functional data using the Group ICA of fMRI Toolbox software package (GIFT 4.0a, Medical Image Analysis Lab, University of New Mexico, USA). Optimal dimensionality of the components was estimated with the minimum description length (MDL) criterion [9]. ICA Infomax algorithm was repeated 100 times in ICASSO with random iterations and the cluster quality index (Iq) was used to validate the stability of decomposition. To extract subject-specific spatial maps and their corresponding time courses, GICA3 back-reconstruction was performed on the group components in GIFT. Non-artifactual components were identified in the following manner. First, components with Iq < 0.9 were excluded. Second, artifactual components were discarded based on their head movement-related spatial maps, or domination of their time courses by high frequency spectral power [8]. The remaining components were identified by cross-correlation (multiple regression) with reference network template [8] and previously-established large-scale intrinsic functional brain networks described elsewhere [5], [10]–[14].
For spectral power analysis, the time courses were detrended using the multi-taper approach as in [8], and element-wise log-transformed to normalize the distribution. To compare BOLD spectral power between pre- and post-CPT conditions, the fast Fourier transform (FFT) of ICN time courses were computed at six frequency bins between 0 and 0.24 Hz at 0.04 Hz intervals. Two-tailed t-tests for unpaired and paired samples were conducted for between-and within-group comparisons, respectively (p < 0.008 ≅ 0.05/6; Bonferroni-correction for six frequency bins).
To further determine the effects of the covariates of interest including the group membership (diagnosis of fibromyalgia), CPT water temperature, and pain rating on the BOLD spectral power, the MANCOVA toolbox in GIFT [8], [14] was utilized. The frame-wise displacement of head movements was also used in the design matrix as a nuisance regressor to improve the evaluation. To decrease the potential disproportionate influence of outlying values on the MANCOVA model fit, the continuous covariates of interest and the nuisance regressor were log-transformed [8]. MANCOVA results that survived p <0.05 (with false discovery rate multiple comparison correction) are reported.
III. RESULTS
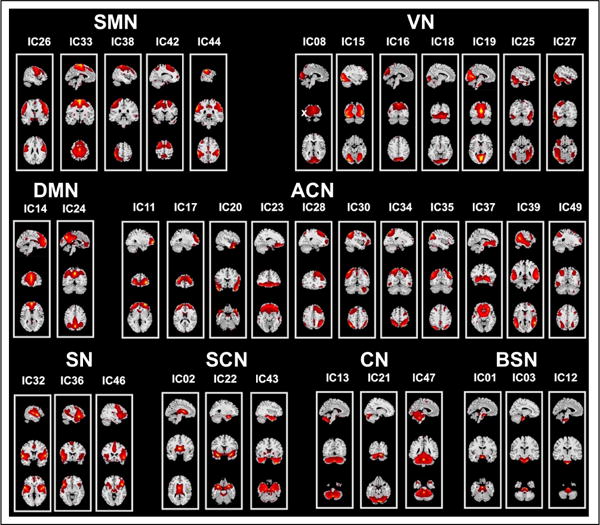
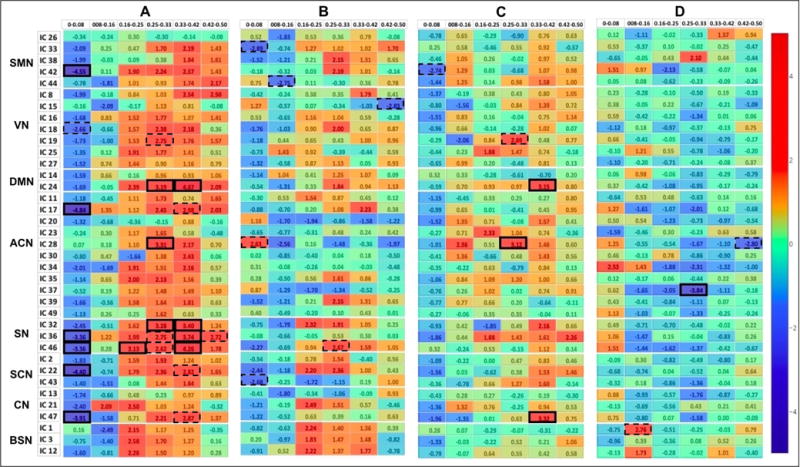
The optimal number of components was estimated to be 52 (mean ± SD = 52.38 ± 6.41) by the MDL criterion. We performed group ICA with 52-IC decomposition, and identified thirty-seven of the resultant components as ICNs by comparing to previously established networks (Fig. 1). These networks included the sensorimotor (SMN), visual (VN), default-mode (DMN), attention / cognitive (ACN), salience (SN), subcortical (SCN), cerebellar (CN) and brainstem (BSN) networks. The results of the BOLD spectral power comparisons pre- and post-CPT conditions between and within groups are summarized in Fig. 2. The MANCOVA multivariate and univariate test results are presented in Figs. 3 and 4, respectively.
Fig. 1.

Spatial maps of thirty-seven components classified as ICNs
Fig. 2.

BOLD Power Spectra Results A Healthy pre-CPT – Fibromyalgia pre-CPT, B Healthy post-CPT – Fibromyalgia post-CPT, C Fibromyalgia post-CPT – Fibromyalgia pre-CPT, D Healthy post-CPT – Healthy pre-CPT. Color bar represents t-values. The spectral differences that are significant at corrected p< 0.05, and uncorrected p< 0.001, are highlighted with solid and dotted rectangular boxes, respectively.
Fig. 3.

Multivariate statistics. The significance of the selected covariates on the BOLD spectral power is displayed in log10(p-value) units.
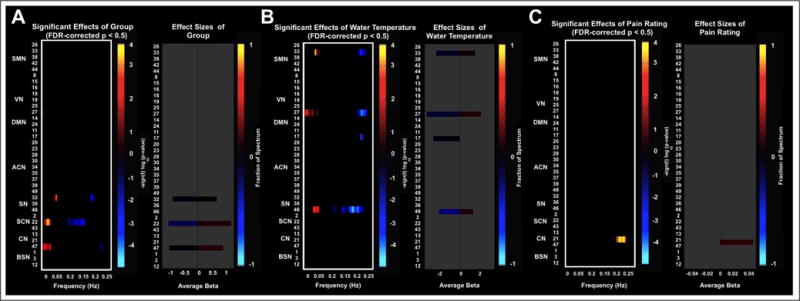
Fig. 4.

Univariate test results showing the significant effects of A Group membership (diagnosis of fibromyalgia), B CPT water temperature, C Pain rating on the BOLD spectral power at FDR-corrected p< 0.05.
IV. Discussion and Conclusion
The spectral power analysis between the patients with fibromyalgia and healthy controls at the baseline (pre-CPT) condition revealed several significant differences at Bonferroni-corrected p < 0.05 (Fig. 2A):
Patients with fibromyalgia demonstrated enhanced fluctuations in the lowest frequency of 0 – 0.08-Hz in the sensorimotor (IC 42), medial prefrontal (IC 17), salience (ICs 36 and 46), subcortical (IC 22; with bilateral amygdala and parahippocampal complex), and cerebellar (IC 47) networks;
Healthy controls showed enhanced fluctuations in mid to upper frequency range of 0.16- to 0.42-Hz in the posterior DMN (IC 24), right-lateralized central executive network (IC 28), and posterior salience network (IC 32), and enhanced 0.33- to 0.42-Hz fluctuations in all salience networks (ICs 32, 36 and 46).
The BOLD spectral power analysis between the groups post-CPT did not result in significant differences at corrected-p< 0.05. However, at an uncorrected threshold of p< 0.001 this analysis revealed differences in the spectral powers of the sensorimotor (ICs 33 and 44), right-lateralized central executive network (IC 28), salience (IC 46), and subcortical (IC 43) networks, consistent with a role for insula and limbic regions in salience monitoring after exposure to a cold stressor (Fig. 2B). The MANCOVA analysis at FDR-corrected p< 0.05 also revealed significant effect of fibromyalgia diagnosis on the salience (IC 32), subcortical (IC 22), and cerebellar (IC 47) networks (Fig. 3A). The cold-water temperature influenced the BOLD spectral power of a motor network (IC 33), high-level visual network (IC 27), medial prefrontal cortex (IC 17), and a salience network (IC 46).
As the main finding, patients with fibromyalgia showed statistically significantly more power than the healthy controls in the lowest frequency band (0.00 – 0.08 Hz) in selected networks, while controls had enhanced fluctuations in a higher frequency band (0.33 – 0.42 Hz) at the baseline resting-state. Following the cold-water immersion, the salience and subcortical networks showed differential spectral power in low to mid frequency ranges indicating their complex involvement in pain processing. Previous studies have shown that during chronic pain, the insular activity is multifaceted. For example, patients with neuropathic pain showed increased activity in bilateral insula and anterior cingulate [15] while alleviation of pain in chronic pain patients showed increased activity only in the right anterior insula and inferior frontal gyrus as the activity in the other parts of the cerebral pain circuitry was suppressed [16]. Because insula has extensive connections to amygdala, hypothalamus, and cingulate cortex, one hypothesis is that the complex salience network activity may reflect its continuous feedback to and from the autonomic nervous system as it monitors the nociceptive activity [10], [11].
These preliminary findings may provide a frame work for future studies with bigger sample sizes aiming to detect the relationship between BOLD fluctuations and pain processing in chronic pain conditions such as fibromyalgia.
Footnotes
This research was supported by the Redlich Pain Research Endowment, and NIH grants T32DA035165, T32GM089626 and K24DA29262.
References
- 1.Queiroz LP. Worldwide epidemiology of fibromyalgia. Current pain and headache reports. 2013;17(8):356. doi: 10.1007/s11916-013-0356-5. [DOI] [PubMed] [Google Scholar]
- 2.Cook DB, Lange G, Ciccone DS, Liu W-C, Steffener J, Natelson BH. Functional imaging of pain in patients with primary fibromyalgia. The Journal of rheumatology. 2004;31(2):364–378. [PubMed] [Google Scholar]
- 3.Staud R, Craggs JG, Perlstein WM, Robinson ME, Price DD. Brain activity associated with slow temporal summation of c-fiber evoked pain in fibromyalgia patients and healthy controls. European Journal of Pain. 2008;12(8):1078–1089. doi: 10.1016/j.ejpain.2008.02.002. [DOI] [PMC free article] [PubMed] [Google Scholar]
- 4.Calhoun V, Adali T, Pearlson G, Pekar J. A method for making group inferences from functional mri data using independent component analysis. Human brain mapping. 2001;14(3):140–151. doi: 10.1002/hbm.1048. [DOI] [PMC free article] [PubMed] [Google Scholar]
- 5.Seeley WW, Menon V, Schatzberg AF, Keller J, Glover GH, Kenna H, Reiss AL, Greicius MD. Dissociable intrinsic connectivity networks for salience processing and executive control. The Journal of neuroscience. 2007;27(9):2349–2356. doi: 10.1523/JNEUROSCI.5587-06.2007. [DOI] [PMC free article] [PubMed] [Google Scholar]
- 6.Craig A. Interoception: the sense of the physiological condition of the body. Current opinion in neurobiology. 2003;13(4):500–505. doi: 10.1016/s0959-4388(03)00090-4. [DOI] [PubMed] [Google Scholar]
- 7.Wolfe F, Clauw DJ, Fitzcharles M-A, Goldenberg DL, Häuser W, Katz RS, Mease P, Russell AS, Russell IJ, Winfield JB. Fibromyalgia criteria and severity scales for clinical and epidemiological studies: a modification of the acr preliminary diagnostic criteria for fibromyalgia. The Journal of rheumatology. 2011;38(6):1113–1122. doi: 10.3899/jrheum.100594. [DOI] [PubMed] [Google Scholar]
- 8.Allen EA, Erhardt EB, Damaraju E, Gruner W, Segall JM, Silva RF, Havlicek M, Rachakonda S, Fries J, Kalyanam R, et al. A baseline for the multivariate comparison of resting-state networks. Frontiers in systems neuroscience. 2011;5 doi: 10.3389/fnsys.2011.00002. [DOI] [PMC free article] [PubMed] [Google Scholar]
- 9.Li Y-O, Adalı T, Calhoun VD. Estimating the number of independent components for functional magnetic resonance imaging data. Human brain mapping. 2007;28(11):1251–1266. doi: 10.1002/hbm.20359. [DOI] [PMC free article] [PubMed] [Google Scholar]
- 10.Jarrahi B, Mantini D, Balsters JH, Michels L, Kessler TM, Mehnert U, Kollias SS. Differential functional brain network connectivity during visceral interoception as revealed by independent component analysis of fmri time-series. Human Brain Mapping. 2015;36(11):4438–4468. doi: 10.1002/hbm.22929. [DOI] [PMC free article] [PubMed] [Google Scholar]
- 11.Jarrahi B, Mantini D, Mehnert U, Kollias S. Exploring influence of subliminal interoception on whole-brain functional network connectivity dynamics. Engineering in Medicine and Biology Society (EMBC), 2015 37th Annual International Conference of the IEEE IEEE. 2015:670–674. doi: 10.1109/EMBC.2015.7318451. [DOI] [PubMed] [Google Scholar]
- 12.Jarrahi B, Mantini D. Tracking intrinsic connectivity brain network features during successive (pseudo-) resting states and interoceptive task fmri. Engineering in Medicine and Biology Society (EMBC), 2016 IEEE 38th Annual International Conference of the IEEE. 2016:5567–5570. doi: 10.1109/EMBC.2016.7591988. [DOI] [PubMed] [Google Scholar]
- 13.Laird AR, Fox PM, Eickhoff SB, Turner JA, Ray KL, McKay DR, Glahn DC, Beckmann CF, Smith SM, Fox PT. Behavioral interpretations of intrinsic connectivity networks. Journal of cognitive neuroscience. 2011;23(12):4022–4037. doi: 10.1162/jocn_a_00077. [DOI] [PMC free article] [PubMed] [Google Scholar]
- 14.Jarrahi B, Mantini D. Identifying the effects of visceral interoception on human brain connectome: A multivariate analysis of covariance of fmri data. Engineering in Medicine and Biology Society (EMBC), 2016 IEEE 38th Annual International Conference of the IEEE. 2016:5558–5562. doi: 10.1109/EMBC.2016.7591986. [DOI] [PubMed] [Google Scholar]
- 15.Hsieh J-C, Belfrage M, Stone-Elander S, Hansson P, Ingvar M. Central representation of chronic ongoing neuropathic pain studied by positron emission tomography. PAIN®. 1995;63(2):225–236. doi: 10.1016/0304-3959(95)00048-W. [DOI] [PubMed] [Google Scholar]
- 16.Geha P, Baliki M, Chialvo D, Harden R, Paice J, Apkarian A. Brain activity for spontaneous pain of postherpetic neuralgia and its modulation by lidocaine patch therapy. Pain. 2007;128(1):88–100. doi: 10.1016/j.pain.2006.09.014. [DOI] [PMC free article] [PubMed] [Google Scholar]


