Abstract
Hypertrophic cardiomyopathy (HC) patients are at increased risk for sudden cardiac death (SCD). Abnormalities in myocardial blood flow (MBF) detected by positron emission tomography (PET) are common in HC, but a PET marker that identifies patients at risk for SCD is lacking. We hypothesized that disparities in regional myocardial perfusion detected by PET would identify HC patients at risk for ventricular arrhythmias. In order to test this hypothesis, we quantified global and regional MBF by 13NH3-PET at rest/stress, and developed a heterogeneity index to assess MBF heterogeneity, in 133 symptomatic HC patients. The MBF-heterogeneity index was computed by dividing the highest by the lowest regional MBF value, at rest and following vasodilator stress, in each patient. High stress MBF heterogeneity was defined as an index ≧1.85. HC patients were stratified by the presence/absence of ventricular arrhythmias, defined as sustained ventricular tachycardia (VT) and/or non-sustained VT (NSVT), during follow up. We found that global and regional-MBF at rest and stress were similar in HC patients with/without ventricular arrhythmias. Variability in regional stress MBF was observed in both groups, but the stress MBF heterogeneity index was significantly higher in HC patients who developed ventricular arrhythmias (1.82 ± 0.77 vs 1.49 ± 0.25, p<0.001). A stress MBF heterogeneity index ≧1.85 was an independent predictor of both sustained VT (HR 16.1, 95% CI 3.2–80.3) and All-VT (sustained-VT+NSVT: HR 3.7, 95% CI 1.4–9.7). High heterogeneity of stress MBF, reflected by a MBF-heterogeneity index ≥1.85, is a PET biomarker for ventricular arrhythmias in symptomatic HC patients.
Keywords: hypertrophic cardiomyopathy, myocardial blood flow, positron-emission tomography, ventricular tachycardia
Introduction
Hypertrophic cardiomyopathy (HC)1 frequently results from sarcomeric protein mutations that increase the energetic cost of tension development. This has led to the hypothesis that excessive energy use by cardiac myocytes contributes to the cardiac HC phenotype. The energy deficit theory has been validated by 31P nuclear magnetic resonance spectroscopy studies, which reveal reduction in adenosine triphosphate (ATP) reserve2,3 at rest, and exacerbation of energy deficits during high workloads.4 A second contributor to energetic deficits in HC is regional microvascular dysfunction5–7 resulting in myocardial ischemia, which has been demonstrated by positron emission tomography (PET). Since regional ischemia can lead to action potential shortening, dispersion of ventricular repolarization and generation of reentrant arrhythmias, we hypothesized that marked disparities in regional myocardial perfusion in the hypertrophied ventricle would increase risk for ventricular arrhythmias8 in HC. In order to test this hypothesis, we quantified myocardial blood flow (MBF) by 13NH3-PET, developed the MBF-heterogeneity index, and examined the association between MBF heterogeneity and ventricular arrhythmias in HC patients.
Methods
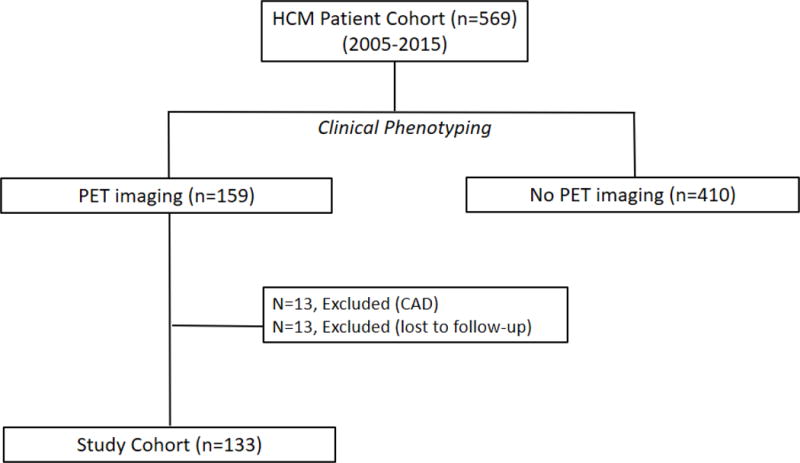
The HC Registry is approved by the Institutional Review Board of the Johns Hopkins Hospital. Patients were prospectively enrolled in the registry from 2005–2015 at their index visit if they met the standard diagnostic criteria, namely, unexplained left ventricular hypertrophy (maximal wall thickness ≥15 mm)1 in the absence of uncontrolled hypertension, valvular heart disease and HC phenocopies such as amyloidosis and storage disorders.9 We performed a retrospective study of all HC patients from the HC Registry, who underwent 13NH3-PET between 2005–2015, and did not have obstructive coronary artery disease. Patients were referred for PET imaging if they had symptoms of angina/exertional dyspnea (despite optimal pharmacotherapy) or ventricular arrhythmias, in the absence of obstructive coronary artery disease (defined as epicardial coronary stenosis >50%, assessed by invasive coronary angiography or computed tomography angiography) (Figure 1). Clinical data including symptoms, comorbidities, medications, presence/absence of obstructive coronary artery disease, risk factors for sudden cardiac death were ascertained by the examining physician during the initial clinic visit, and during each follow up visit.
Figure 1. Flow chart for patient inclusion in HC-PET study.
Transthoracic echocardiography was performed at rest and following treadmill exercise, using a GE Vivid 7 or E-9 ultrasound machine (GE Ultrasound, Milwaukee, WI) in all patients as part of their clinical evaluation, as described previously.10 Left ventricular pressure gradients were measured by continuous-wave Doppler echocardiography, at rest and peak stress (following exercise). HC patients were classified as non-obstructive if rest and stress LV pressure gradients were <30 mmHg; labile obstructive HC was defined as rest pressure gradients <30 mmHg and stress pressure gradients ≧30 mmHg; obstructive HC was characterized by rest and stress pressure gradients≧30 mmHg.
Cardiac PET/CT imaging was performed using a GE Discovery VCT PET/CT System (GE Healthcare, Waukesha, Wisconsin) and a 1-day rest/stress protocol, as described previously.11 Approximately 370 MBq (10 mCi) of 13N-ammonia was injected intravenously, followed by PET acquisition in two-dimensional list mode for 20 minutes. Vasodilator stress was induced by dipyridamole or regadenoson, approximately 60 minutes after injection of the rest dose.12 Semi-automated analysis of the resulting myocardial perfusion images was performed using QPET (Cedars Sinai, Los Angeles, California). The summed stress score (SSS), summed rest score (SRS) and summed difference score (SDS; SSS-SRS=SDS) were computed to assess the degree of inducible ischemia in each patient.13 Global MBF (ml/min/g) at rest and during vasodilator stress were quantified using QPET software as previously described.14 Myocardial flow reserve (MFR) was defined as stress MBF divided by rest MBF. For regional MBF analysis, the left ventricular wall separated into 5 regions: septum, apex, anterior, inferior and lateral walls.
Vasodilator-induced left ventricular cavity dilation (LVCD) was assessed using the PET-LVCD-index. The PET-LVCD-index was computed by dividing the LV volume during peak vasodilator stress by the LV volume at rest. HC patients with an index >1.13 were considered to have LVCD.7,15
Heterogeneity of MBF at baseline and following vasodilator stress was assessed by computing the MBF heterogeneity index, which was calculated by dividing the highest regional MBF value by the lowest regional MBF value at rest and peak stress, in each patient. High stress MBF heterogeneity was defined as a stress MBF heterogeneity index ≥1.85, based on the receiver operating characteristic (ROC) curve.
Cardiac magnetic resonance (CMR) imaging with contrast, gadopentetate dimeglumine at 0.2 mmol/kg (Magnevist; Bayer Schering, Berlin, Germany), was performed on a 1.5T system (MAGNETOM Avanto; Siemens Healthcare, Erlangen, Germany) in all patients as part of their clinical evaluation, as described previously.16
Ventricular arrhythmias were defined as (1) sustained VT (≥30 seconds duration) or ventricular fibrillation, resulting in defibrillator shocks or anti-tachycardia pacing, and (2) All-VT, characterized by sustained VT/VF + NSVT (VT rate >130 beats per minute, <30 seconds duration).17,18 NSVT was included in the arrhythmia outcomes because NSVT has also been independently associated with implantable cardioverter (ICD)-treated ventricular arrhythmias19. Patients without ICDs were followed annually by Holter monitoring. Patients with ICDs had device interrogation every 6 months, or more frequently if they were symptomatic or had ICD discharge(s). Arrhythmias were recorded by reviewing Holter monitor and ICD interrogation data. The maximal follow-up was five years.
Descriptive statistics were performed on patient demographics, echocardiography, PET and CMR parameters stratified by presence or absence of ventricular arrhythmias during follow-up. Data were examined with Shapiro-Wilk test for normality. Continuous variables are presented as mean ± standard deviation, and categorical variables are demonstrated as total number and percentage. Comparison of continuous variables across groups was performed using the Student’s t-test if data was normally distributed, or the Mann-Whitney U test if non-normally distributed. Chi-square test was used to compare categorical variables. The cut-off point of the stress MBF heterogeneity index for ventricular arrhythmias was confirmed by identification of inflection points on the receiver operating characteristic (ROC) curve. The risk for development of ventricular arrhythmias in patients with a low or high stress MBF heterogeneity index was analyzed by Kaplan-Meier survival curves and log-rank tests. Cox proportional hazards models were used to identify predictors of ventricular arrhythmias. Variables which were statistically significant in the univariate analysis were included in a multivariate model, including age, classification of HC, and history of VT/VF.
Results
We studied 133 patients with a clinical diagnosis of HC. During a median follow-up of 3.3 ± 1.6 years, 23 patients (17%) developed ventricular arrhythmias, including 9 patients who developed sustained VT (7%) and 14 patients (10%) who had evidence of NSVT; none of the patients developed ventricular fibrillation. Patients were divided into 2 groups, based on the pres ence or absence of any ventricular arrhythmia (VA), namely sustained-VT and/or NSVT,19 during follow up (Table 1). The clinical characteristics of HC patients who developed ventricular arrhythmias during follow up are described in Supplementary Table 1.
Table 1.
Basic characteristics of study patients stratified by presence or absence of ventricular arrhythmias during follow up
| Ventricular Arrhythmia No (N=110) |
Ventricular Arrhythmia Yes (N = 23) |
P-value | |
|---|---|---|---|
| Age (years) | 51 ± 13 | 44 ± 16 | 0.06 |
| Men | 59 (54%) | 16 (70%) | 0.2 |
| Body mass index (kg/m2) | 30 ± 8 | 27 ± 3 | 0.1 |
| HC type | <0.01 | ||
| Non-obstructive | 29 (27%) | 15 (65%) | |
| Labile | 41 (37%) | 3 (13%) | |
| Obstructive | 40 (36%) | 5 (22%) | |
| Apical HC | 6 (6%) | 1 (5%) | 0.8 |
| NYHA | 0.09 | ||
| Class I | 41 (37%) | 14 (61%) | |
| Class II–III | 69 (63%) | 9 (39%) | |
| Angina | 71 (65%) | 10 (44%) | 0.1 |
| Family history of HC | 17 (16%) | 6 (26%) | 0.3 |
| ICD implantation | 14 (13%) | 9 (39%) | <0.01 |
| Risk factors for SCD | |||
| Syncope | 27 (25%) | 6 (26%) | 0.8 |
| Family history of SCD | 24 (22%) | 8 (35%) | 0.2 |
| Non-sustained VT | 8 (7%) | 3 (13%) | 0.6 |
| Sustained VT/VF | 4 (4%) | 4 (17%) | 0.03 |
| Septal thickness ≥3 mm | 9 (8%) | 3 (13%) | 0.7 |
| Hypotensive BP response to exercise | 46 (45%) | 6 (26%) | 0.1 |
| Number of SCD risk factors | 1.1 ± 0.9 | 1.3 ± 1.1 | 0.3 |
| HC Risk-SCD score | 3.8 ± 2.5 | 3.8 ± 2.0 | 0.9 |
| Echocardiography | |||
| Left atrial diameter (mm) | 42 ± 7 | 42 ± 9 | 0.7 |
| Maximal septal thickness (mm) | 21 ± 5 | 22 ± 5 | 0.5 |
| LVEF (%) | 66 ± 8 | 64 ± 7 | 0.2 |
| E/A | 1.4 ± 0.8 | 1.6 ± 0.8 | 0.2 |
| E/e′ | 19.5 ± 9.8 | 17.3 ± 8.8 | 0.3 |
| Rest LVOT gradient (mmHg) | 29 ± 27 | 17 ± 17 | 0.01 |
| Stress LVOT gradient (mmHg) | 73 ± 51 | 43 ± 57 | 0.02 |
| Cardiac Magnetic Resonance | |||
| Presence of LGE | 60 (66%) | 13 (72%) | 0.8 |
| LGE percentage (% of LV mass) | 13.8 ± 12.1 | 13.5 ± 8.1 | 0.9 |
| Medications | |||
| Beta-blocker | 83 (74%) | 17 (74%) | 0.8 |
| Calcium channel blocker | 34 (31%) | 7 (30%) | 0.9 |
| RAS blockade | 26 (24%) | 4 (17%) | 0.7 |
| Disopyramide | 7 (6%) | 0 (0%) | 0.4 |
E/A = ratio of early diastolic mitral flow velocity to the late diastolic mitral flow velocity; E/e′ = ratio of early diastolic mitral flow velocity to the early diastolic mitral septal annulus motion velocity; HC = hypertrophic cardiomyopathy; ICD = Implantable Cardioverter Defibrillator; LVEF = left ventricular ejection fraction; LVOT = left ventricular outflow tract; NYHA = New York Heart Association; RAS blockade = angiotensin converting enzyme inhibitor & angiotensin II receptor blocker; SCD = sudden cardiac death; VA = ventricular arrhythmia = sustained VT + NSVT; VT/VF = Ventricular tachycardia/fibrillation; SCD = sudden cardiac death; LGE = late gadolinium enhancement.
Global and regional MBF (at rest/following vasodilator stress) and MFR were similar in the 2 groups (Figure 2A–C). The SDS (which reflects inducible ischemia regionally) and incidence of PET-LVCD (which reflects diffuse sub-endocardial ischemia7) were also similar (Table 2). The most notable result in HC patients was marked variability in regional stress MBF: the lateral wall demonstrated the highest stress MBF in 56% of patients, and was followed by the anterior wall and apex, respectively, whereas the hypertrophied septum exhibited the lowest stress MBF in ~44% of patients (Figure 3). The rest MBF heterogeneity index was similar in patients with/without ventricular arrhythmias. However, HC patients who developed ventricular arrhythmias had a significantly higher stress MBF heterogeneity (1.82 ± 0.87 vs. 1.49 ± 0.25, p<0.001) (Figure 4).
Figure 2. Global and regional MBF and MFR in HC patients stratified by presence or absence of ventricular arrhythmias (VA) during follow up.
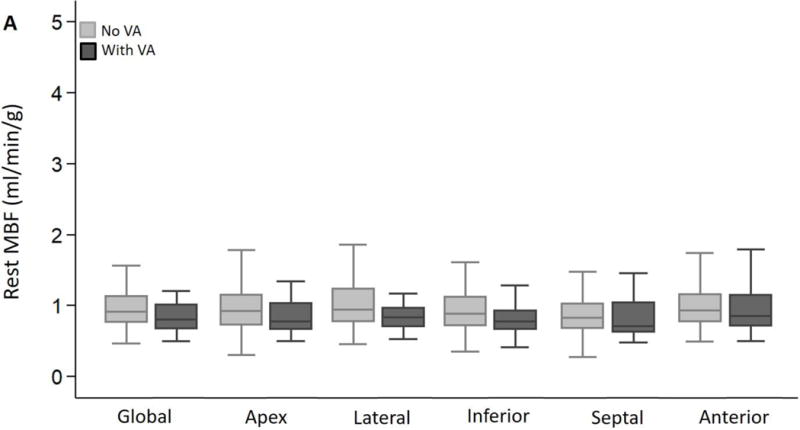
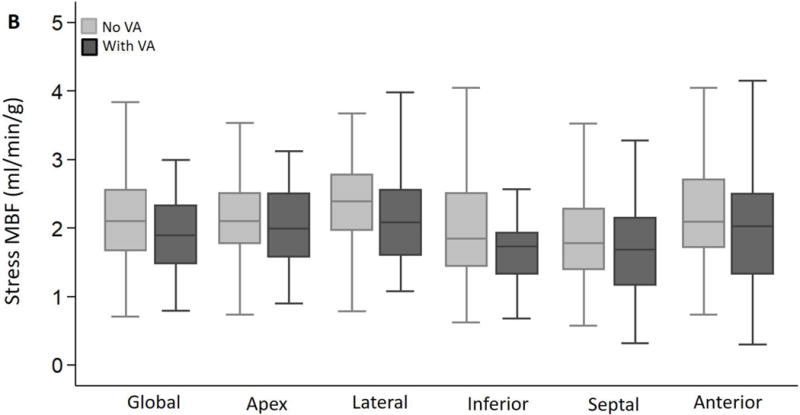
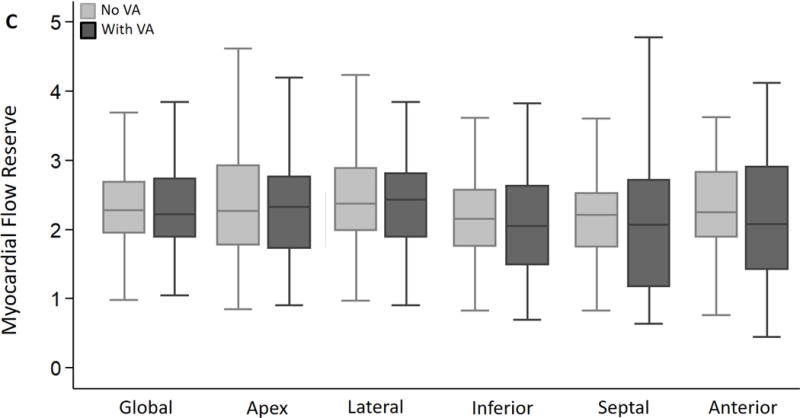
(A) Global and regional MBF at rest, (B) Global and regional MBF during vasodilator stress and (C) Global and regional MFR, were similar between HC patients who developed ventricular arrhythmias (sustained VT, NSVT) and HC patients who had no evidence of ventricular arrhythmias during follow up.
Table 2.
PET results stratified by presence or absence of ventricular arrhythmia during follow up
| Ventricular Arrhythmia No (N=110) |
Ventricular Arrhythmia Yes (N = 23) |
P-value | |
|---|---|---|---|
| Global rest MBF (ml/min/g) | 0.97 ± 0.32 | 0.98 ± 0.59 | 0.2§ |
| Global stress MBF (ml/min/g) | 2.15 ± 0.67 | 1.92 ± 0.67 | 0.1§ |
| Global myocardial flow reserve | 2.42 ± 0.78 | 2.33 ± 0.86 | 0.6§ |
| SRS score | 5.1 ± 6.1 | 9.2 ± 9.6 | 0.07§ |
| SSS score | 10.1 ± 7.7 | 15.3 ± 9.4 | 0.009§ |
| SDS score | 4.9 ± 4.9 | 6.1 ± 5.5 | 0.3§ |
| LVCD index | 1.15 ± 0.16 | 1.14 ± 0.13 | 0.8 |
| Presence of LVCD | 51 (46%) | 11 (48%) | 0.9 |
| Rest LVEF (%) | 54 ± 12 | 49 ± 11 | 0.06 |
| Stress LVEF (%) | 48 ± 12 | 42 ± 11 | 0.04 |
| LVEF reserve (%) | −11 ± 14 | −13 ± 15 | 0.5 |
Comparisons performed using Mann-Whitney U test
MBF = myocardial blood flow; SDS = summed difference score, SRS = summed rest score; SSS = summed stress score; LVCD = left ventricular cavity dilation; LVEF = left ventricular ejection fraction.
Figure 3. Regional distribution of stress MBF in HC cohort.
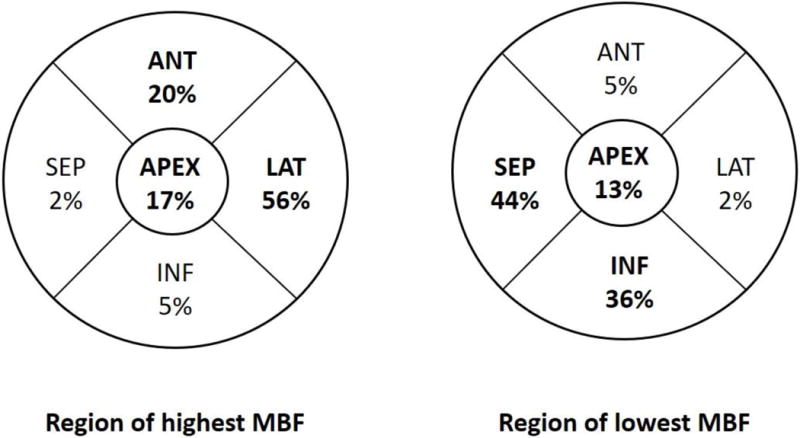
The lateral wall demonstrated the highest stress MBF in 56% of patients, and was followed by the anterior wall and apex, respectively, whereas the septum exhibited the lowest stress MBF in ~44% of patients.
Figure 4. Rest and stress MBF heterogeneity index stratified by presence or absence of ventricular arrhythmias (VA).
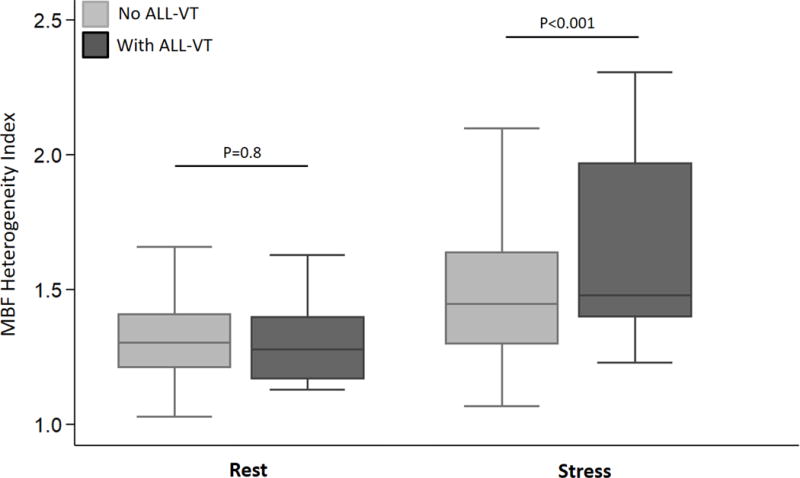
The rest MBF heterogeneity index was similar in patients with/without ventricular arrhythmias. HC patients who developed sustained ventricular arrhythmias (sustained VT, NSVT) had a significantly higher stress MBF heterogeneity index than patients who did not have ventricular arrhythmias during follow up.
We identified 1.85 as the best cut off for ventricular arrhythmia prediction, using the stress MBF heterogeneity index. The area under the curve was 0.64; sensitivity and specificity were 35% and 94%, respectively. Using this value, 11% (n=15) of patients in our cohort had high stress MBF heterogeneity. The cumulative incidence of ventricular arrhythmias among HC patients with low stress MBF heterogeneity was 13%, but increased to 53% in patients with high stress MBF heterogeneity. Representative PET images of patients with sustained VT and without ventricular arrhythmias during follow up and their respective stress-MBF heterogeneity index are presented in Figure 5.
Figure 5. 13NH3-PET polar plots and perfusion images.
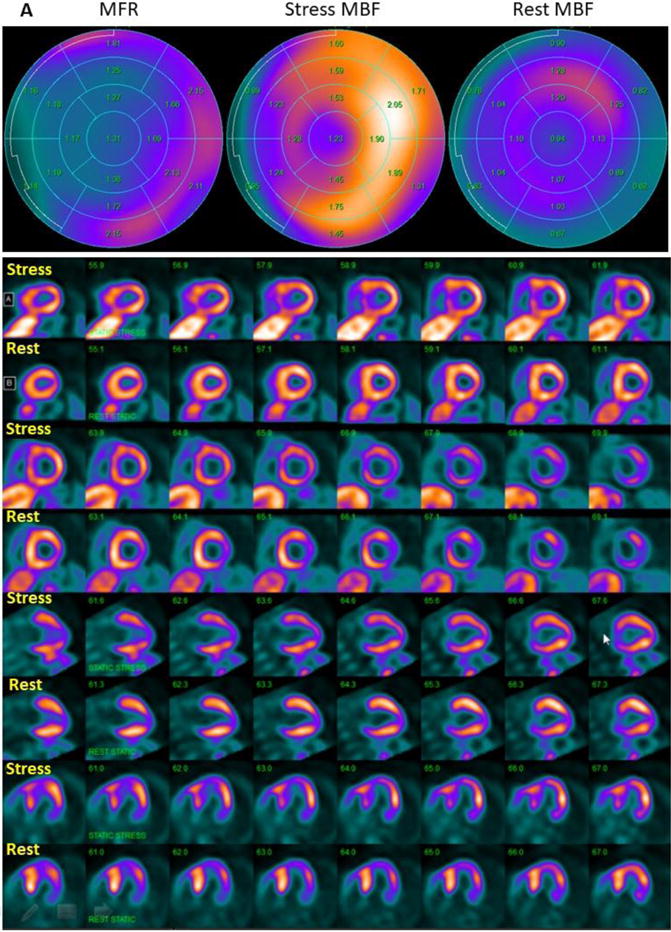
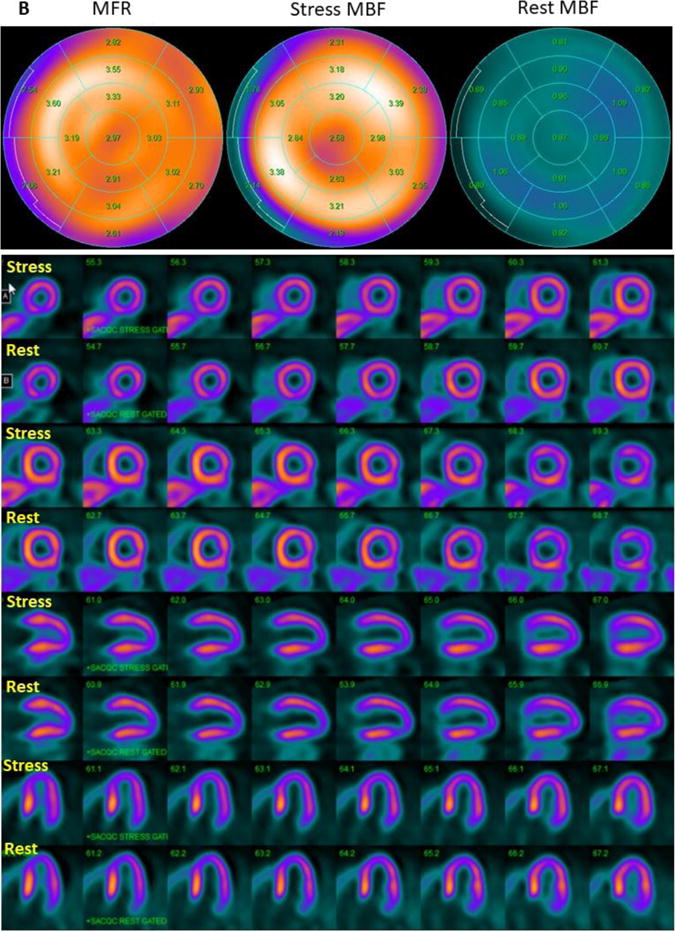
(A) 13NH3-PET polar plots and perfusion images in HC patient with stress MBF heterogeneity index of 3.12, who developed sustained VT during follow up. Polar plots demonstrate evidence of mild reduction of MFR globally, and severe reduction of MFR in the septum. Perfusion images reveal reversible myocardial ischemia in anterior and septal regions (SDS=7). (B) 13NH3-PET polar plots and perfusion images in HC patient with stress MBF heterogeneity index of 1.07, who did not develop ventricular arrhythmias during follow up. MFR is normal and there is no evidence of vasodilator-induced myocardial ischemia (SDS=1). MBF: myocardial blood flow, MFR: myocardial flow reserve.
Patients with a high stress MBF heterogeneity index (≥1.85) had lower stress left ventricular outflow tract gradients, lower global rest and stress MBFs, and higher summed difference scores (Supplementary Table 2). Interestingly, both groups had similar numbers of SCD risk factors1 and ESC-SCD-Risk scores20, with the exception of history of sustained VT/VF, which was more frequent in HC patients with a high index.
During follow-up, HC patients with a stress MBF heterogeneity index ≥1.85 had significantly higher risk of developing sustained VT and All-VT (Figure 6). The stress MBF heterogeneity index was associated with higher incidence of ventricular arrhythmias (Table 3, univariate analysis). Using univariate Cox regression, non-obstructive HC, history of VT/VF were positively predictive, and age was negatively predictive of future ventricular arrhythmic events (Supplementary Table 3). After additional adjustments for these potential confounding parameters, the stress MBF heterogeneity index was independently associated with sustained-VT. High stress MBF heterogeneity (index ≥ 1.85) was also an independent predictor of either sustained VT alone or All-VT (Table 3, multivariate analysis).
Figure 6. Kaplan-Meier curves comparing ventricular arrhythmia outcome stratified by the stress MBF heterogeneity index.
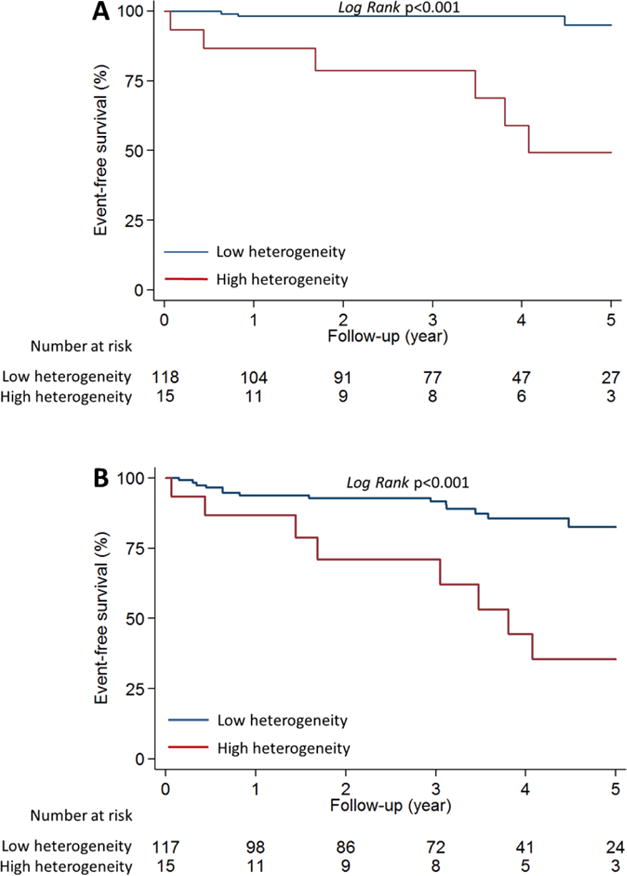
HC patients with stress MBF heterogeneity index ≥1.85 (red line) had significantly higher risk of developing ventricular arrhythmias, characterized by (A) sustained-VT, as well as (B) All-VT (sustained-VT+NSVT), when compared to HC patients with stress MBF heterogeneity index <1.85 (blue line).
Table 3.
Univariate and multivariate Cox proportional hazards analyses of the relationship between stress myocardial blood flow (MBF) parameters and ventricular arrhythmia outcome
| Sustained ventricular tachycardia
|
All ventricular tachycardia
|
|||||||
|---|---|---|---|---|---|---|---|---|
| Univariate analysis | Multivariate analysis* | Univariate analysis | Multivariate analysis* | |||||
|
|
|
|||||||
| HR (95% CI) | p | HR (95% CI) | p | HR (95% CI) | p | HR (95% CI) | p | |
|
|
|
|||||||
| Stress-MBF heterogeneity index, per unit | 3.6 (2.1–6.5) | <0.01 | 3.1 (1.4–6.6) | <0.01 | 2.2 (1.3–3.7) | <0.01 | 1.8 (1.0–3.4) | 0.06 |
| High stress-MBF heterogeneity index | 16.4 (4.1–66.0) | <0.01 | 16.1 (3.2–80.3) | <0.01 | 4.1 (1.8–9.8) | <0.01 | 3.7 (1.4–9.7) | <0.01 |
All ventricular tachycardia = sustained + non-sustained ventricular tachycardia; MBF = myocardial blood flow.
CI = confidence interval; HR = hazard ratio.
Multivariate model: each variable was adjusted for age, non-obstructive HC, and history of sustained ventricular tachycardia/ventricular fibrillation separately.
Discussion
This is the first study to identify a PET marker that predicts ventricular arrhythmias in HC patients. Our proof-of-concept study provides support for regional myocardial perfusion abnormalities in cardiac arrhythmogenesis in HC patients. Our most notable result is that heterogeneity in stress MBF is an independent predictor of ventricular arrhythmias, defined as sustained VT alone or All-VT (NSVT+sustained VT) in symptomatic HC patients. While the association between prior history of VT/VF1 and recurrence of ventricular arrhythmias is expected in HC patients, the association between non-obstructive HC and ventricular arrhythmias (which was first demonstrated by Pozios et al13) appears counterintuitive. In our study, the non-obstructive HC subgroup had significantly higher heterogeneity of stress MBF than patients with obstructive HC (non-obstructive vs. labile vs. obstructive = 1.67 vs 1.49 vs 1.47, p=0.03).13 We speculate that the combination of greater degree of myopathy (reflected by lower myocardial strain)10,21 and regional microvascular dysfunction resulting in myocardial ischemia, in symptomatic patients with non-obstructive HC, underlies the higher risk for ventricular arrhythmias in this patient sub-group.
The association between myocardial ischemia and ventricular arrhythmias was first reported by Dilsizian et al,22 in a retrospective study of 23 young HC patients. A follow up study by Cecchi et al5 in 51 patients found that the degree of microvascular dysfunction and stress MBF abnormalities was a strong, independent predictor of clinical deterioration and death in HC. A more recent study by Castagnoli et al6 in 100 patients, confirmed the association between myocardial perfusion abnormalities and mortality in HC patients. Interestingly, they found that impairment of stress MBF in the lateral wall, but not in the hypertrophied septum, predicted adverse events (defined by the composite outcome: heart failure + sustained ventricular arrhythmia + stroke + death), suggesting the prognostic importance of regional differences in stress MBF in HC patients. Our study in 133 HC patients, confirmed their results: we found that only stress MBF in the lateral wall was associated with the composite outcome defined by Castagnoli et al6, using their cutoff of stress MBF <1.72 ml/min/g in the lateral wall. (Supplementary Data, Supplemental Figures 1, 2). However, low stress MBF in the lateral wall did not predict ventricular arrhythmias, when assessed as a single outcome in our HC cohort (Supplemental Figure 3).
We found that the lateral wall had the highest average stress MBF value and the septal wall had the lowest. Yet, the lateral wall was the region with highest stress MBF in only 56% of patients, and the interventricular septum had the lowest stress MBF in only 44% of HC patients. The impact of such an imbalanced distribution in stress MBF would have been underestimated if we had assumed that the lateral wall always had the highest MFR, and the septum had the lowest MFR in HC patients.6 We developed the stress MBF heterogeneity index to more accurately reflect the severity of heterogeneous MBF.
Previous studies suggest a relationship between extent of late gadolinium enhancement and ventricular arrhythmias.23 We found that HC patients with ventricular arrhythmias had a slightly higher prevalence of late gadolinium enhancement, but the difference was not statistically significant. It is possible that the predictive power of late gadolinium enhancement detected by CMR imaging is limited by the relatively small number of patients in our study. Furthermore, it is possible that regional microvascular dysfunction occurs at an earlier stage and is a more sensitive marker for future development of ventricular arrhythmias than late gadolinium enhancement, which reflects replacement fibrosis.24
The arrhythmogenic substrate for ventricular arrhythmias in HC is both fixed and dynamic. Sarcomeric protein mutations lead to asymmetric left ventricular hypertrophy, myocyte disarray, fibrosis and changes in expression of ion channels, gap junctions, calcium handling,25,26 which slow conduction velocity heterogeneously and promote triggered activity, which manifest as sustained VT and NSVT.27 Superimposed on the architectural and electrophysiologic remodeling, is reduced arteriolar density (relative to wall thickness), structural abnormalities in coronary arterioles28 and a blunted hyperemic response to vasodilator stress. Microvascular dysfunction leading to myocardial ischemia would reduce delivery of oxygen and substrates, resulting in energy (ATP) depletion, activation of the ATP-sensitive K+ channels (KATP)29 and action potential shortening in ischemic regions, increasing vulnerability to reentrant ventricular arrhythmias8. Marked differences in regional-MBF during stress, reflected by a high stress MBF heterogeneity index could exacerbate the dispersion of ventricular repolarization caused by heterogeneous patterns of ventricular hypertrophy, interstitial/replacement fibrosis, and thus predispose to reentrant ventricular arrhythmias and SCD in HC patients. Our study suggests that marked differences in regional myocardial perfusion, rather than the presence of inducible ischemia per se, reflected by a high summed difference score15 and/or left ventricular cavity dilation,7 contribute to arrhythmogenesis in HC patients.
With the exception of cardiac arrest, each conventional risk factor has a low positive predictive value and modestly high negative predictive value for SCD in HC patients.1 In this study, HC patients who developed ventricular arrhythmias had similar ESC-Risk-SCD scores as HC patients without ventricular arrhythmias, suggesting that myocardial perfusion imaging and calculation of the stress MBF heterogeneity index in symptomatic HC patients could provide incremental information for SCD risk stratification. Interestingly, 80% of patients with a high stress MBF heterogeneity index had an ESC-Risk-SCD score <5%, which would have led to these patients being considered low risk for development of ventricular arrhythmias using current SCD risk stratification algorithms. In our study, 42% of HC patients with an ESC-Risk-SCD score <5% developed ventricular arrhythmias during follow up. Based on these our results, ICD implantation may be indicated in symptomatic HC patients in whom SCD risk remains borderline using conventional SCD risk factors but who have a stress MBF heterogeneity index ≥1.85 by 13NH3-PET imaging. Symptomatic HC patients with a stress MBF heterogeneity index ≥1.85 and low SCD risk scores may also warrant close monitoring for ventricular arrhythmias, using an implantable loop recorder.
Our study has the following limitations. First, this is a single center, retrospective study. The incremental value of the stress MBF heterogeneity index for ventricular arrhythmia prediction needs confirmation in prospective, multi-center studies of symptomatic HC patients. Second, only symptomatic HC patients who presented with angina and/or exertional dyspnea (despite optimal pharmacotherapy), or ventricular arrhythmias were referred for PET imaging. Hence, the results from our study cannot be extrapolated to asymptomatic HC patients who may be at low risk for development of ventricular arrhythmias. Third, due to the limited number of events, the incremental value of stress MBF heterogeneity index upon conventional ESC SCD risk score was not tested. Notwithstanding these limitations, our study is by far the largest clinical study to date, evaluating the association between myocardial perfusion abnormalities and ventricular arrhythmias, and the first study to identify a PET marker that predicts ventricular arrhythmias in HC patients. In conclusion, high heterogeneity of stress MBF, reflected by a MBF-heterogeneity index ≥1.85, is a novel PET biomarker for ventricular arrhythmias in symptomatic HC patients.
Supplementary Material
(A) Global and regional MBF at rest, and (B) following vasodilator stress in HC patients stratified by presence or absence of the composite outcome, characterized by heart failure, sustained ventricular arrhythmia, stroke and death, as defined by Castagnoli et al6. HC patients with the composite outcome demonstrated lower global rest/stress MBF, as well as lower MBF in the lateral wall at rest/stress, when compared to HC patients without the composite outcome. *p<0.05.
Low stress MBF (<1.72 ml/min/g) in the lateral wall (red line) was associated with greater risk of having the composite endpoint (heart failure, sustained ventricular arrhythmia, stroke and death), in our HC cohort (Log-Rank p=0.017).
Low stress MBF (<1.72 ml/min/g) in the lateral wall (red line) was not associated with greater risk for All-VT (sustained-VT+NSVT) in our HC cohort (Log-Rank p=0.26).
Acknowledgments
The authors would like to acknowledge help from the Image Response Assessment Team (IRAT) (NIH P30CA006973) with PET image retrieval.
Funding Sources
This work was supported by the JTB (John Taylor Babbit) Foundation, and startup funds from the UCSF Division of Cardiology to MRA. Dr. Lu was supported by Taipei Veterans General Hospital-National Yang-Ming University Excellent Physician Scientists Cultivation Program, No. 104-V-A-005. Dr. H. Yalçin was supported by a Fulbright Fellowship (Bureau of Educational and Cultural Affairs, United States Department of State).
Footnotes
Publisher's Disclaimer: This is a PDF file of an unedited manuscript that has been accepted for publication. As a service to our customers we are providing this early version of the manuscript. The manuscript will undergo copyediting, typesetting, and review of the resulting proof before it is published in its final citable form. Please note that during the production process errors may be discovered which could affect the content, and all legal disclaimers that apply to the journal pertain.
Conflict of interest: None
Disclosures
None.
References
- 1.Gersh BJ, Maron BJ, Bonow RO, Dearani JA, Fifer MA, Link MS, Naidu SS, Nishimura RA, Ommen SR, Rakowski H, Seidman CE, Towbin JA, Udelson JE, Yancy CW, American College of Cardiology Foundation/American Heart Association Task Force on Practice G 2011 ACCF/AHA Guideline for the Diagnosis and Treatment of Hypertrophic Cardiomyopathy: a report of the American College of Cardiology Foundation/American Heart Association Task Force on Practice Guidelines. Developed in collaboration with the American Association for Thoracic Surgery, American Society of Echocardiography, American Society of Nuclear Cardiology, Heart Failure Society of America, Heart Rhythm Society, Society for Cardiovascular Angiography and Interventions, and Society of Thoracic Surgeons. J Am Coll Cardiol. 2011;58:e212–260. doi: 10.1016/j.jacc.2011.06.011. [DOI] [PubMed] [Google Scholar]
- 2.Jung WI, Sieverding L, Breuer J, Hoess T, Widmaier S, Schmidt O, Bunse M, van Erckelens F, Apitz J, Lutz O, Dietze GJ. 31P NMR spectroscopy detects metabolic abnormalities in asymptomatic patients with hypertrophic cardiomyopathy. Circulation. 1998;97:2536–2542. doi: 10.1161/01.cir.97.25.2536. [DOI] [PubMed] [Google Scholar]
- 3.Abraham MR, Bottomley PA, Dimaano VL, Pinheiro A, Steinberg A, Traill TA, Abraham TP, Weiss RG. Creatine kinase adenosine triphosphate and phosphocreatine energy supply in a single kindred of patients with hypertrophic cardiomyopathy. Am J Cardiol. 2013;112:861–866. doi: 10.1016/j.amjcard.2013.05.017. [DOI] [PMC free article] [PubMed] [Google Scholar]
- 4.Dass S, Cochlin LE, Suttie JJ, Holloway CJ, Rider OJ, Carden L, Tyler DJ, Karamitsos TD, Clarke K, Neubauer S, Watkins H. Exacerbation of cardiac energetic impairment during exercise in hypertrophic cardiomyopathy: a potential mechanism for diastolic dysfunction. Eur Heart J. 2015;36:1547–1554. doi: 10.1093/eurheartj/ehv120. [DOI] [PubMed] [Google Scholar]
- 5.Cecchi F, Olivotto I, Gistri R, Lorenzoni R, Chiriatti G, Camici PG. Coronary microvascular dysfunction and prognosis in hypertrophic cardiomyopathy. N Engl J Med. 2003;349:1027–1035. doi: 10.1056/NEJMoa025050. [DOI] [PubMed] [Google Scholar]
- 6.Castagnoli H, Ferrantini C, Coppini R, Passeri A, Baldini K, Berti V, Cecchi F, Olivotto I, Sciagra R. Role of quantitative myocardial positron emission tomography for risk stratification in patients with hypertrophic cardiomyopathy: a 2016 reappraisal. Eur J Nucl Med Mol Imaging. 2016;43:2413–2422. doi: 10.1007/s00259-016-3465-7. [DOI] [PubMed] [Google Scholar]
- 7.Yalcin H, Valenta I, Yalcin F, Corona-Villalobos C, Vasquez N, Ra J, Kucukler N, Tahari A, Pozios I, Zhou Y, Pomper M, Abraham TP, Schindler TH, Abraham MR. Effect of Diffuse Subendocardial Hypoperfusion on Left Ventricular Cavity Size by 13N-Ammonia Perfusion PET in Patients With Hypertrophic Cardiomyopathy. Am J Cardiol. 2016;118:1908–1915. doi: 10.1016/j.amjcard.2016.08.085. [DOI] [PubMed] [Google Scholar]
- 8.Zhou L, Solhjoo S, Millare B, Plank G, Abraham MR, Cortassa S, Trayanova N, O’Rourke B. Effects of regional mitochondrial depolarization on electrical propagation: implications for arrhythmogenesis. Circ Arrhythm Electrophysiol. 2014;7:143–151. doi: 10.1161/CIRCEP.113.000600. [DOI] [PMC free article] [PubMed] [Google Scholar]
- 9.Sankaranarayanan R, E JF, C JG. Mimics of Hypertrophic Cardiomyopathy - Diagnostic Clues to Aid Early Identification of Phenocopies. Arrhythm Electrophysiol Rev. 2013;2:36–40. doi: 10.15420/aer.2013.2.1.36. [DOI] [PMC free article] [PubMed] [Google Scholar]
- 10.Lu DY, Hailesealassie B, Ventoulis I, Liu H, Liang HY, Nowbar A, Pozios I, Canepa M, Cresswell K, Luo HC, Abraham MR, Abraham TP. Impact of peak provoked left ventricular outflow tract gradients on clinical outcomes in hypertrophic cardiomyopathy. Int J Cardiol. 2017;243:290–295. doi: 10.1016/j.ijcard.2017.04.039. [DOI] [PubMed] [Google Scholar]
- 11.Yalcin H, Valenta I, Yalcin F, Corona-Villalobos C, Vasquez N, Ra J, Kucukler N, Tahari A, Pozios I, Zhou Y, Pomper M, Abraham TP, Schindler TH, Abraham MR. Effect of Diffuse Subendocardial Hypoperfusion on Left Ventricular Cavity Size by (13)N-Ammonia Perfusion PET in Patients With Hypertrophic Cardiomyopathy. Am J Cardiol. 2016;118:1908–1915. doi: 10.1016/j.amjcard.2016.08.085. [DOI] [PubMed] [Google Scholar]
- 12.Bravo PE, Pozios I, Pinheiro A, Merrill J, Tsui BM, Wahl RL, Bengel FM, Abraham MR, Abraham TP. Comparison and effectiveness of regadenoson versus dipyridamole on stress electrocardiographic changes during positron emission tomography evaluation of patients with hypertrophic cardiomyopathy. Am J Cardiol. 2012;110:1033–1039. doi: 10.1016/j.amjcard.2012.05.038. [DOI] [PMC free article] [PubMed] [Google Scholar]
- 13.Pozios I, Corona-Villalobos C, Sorensen LL, Bravo PE, Canepa M, Pisanello C, Pinheiro A, Dimaano VL, Luo H, Dardari Z, Zhou X, Kamel I, Zimmerman SL, Bluemke DA, Abraham MR, Abraham TP. Comparison of Outcomes in Patients With Nonobstructive, Labile-Obstructive, and Chronically Obstructive Hypertrophic Cardiomyopathy. Am J Cardiol. 2015;116:938–944. doi: 10.1016/j.amjcard.2015.06.018. [DOI] [PMC free article] [PubMed] [Google Scholar]
- 14.Choi Y, Huang SC, Hawkins RA, Kuhle WG, Dahlbom M, Hoh CK, Czernin J, Phelps ME, Schelbert HR. A simplified method for quantification of myocardial blood flow using nitrogen-13-ammonia and dynamic PET. J Nucl Med. 1993;34:488–497. [PubMed] [Google Scholar]
- 15.Bravo PE, Tahari A, Pozios I, Luo HC, Bengel FM, Wahl RL, Abraham MR, Abraham TP. Apparent left ventricular cavity dilatation during PET/CT in hypertrophic cardiomyopathy: Clinical predictors and potential mechanisms. J Nucl Cardiol. 2016;23:1304–1314. doi: 10.1007/s12350-015-0158-8. [DOI] [PubMed] [Google Scholar]
- 16.Bravo PE, Zimmerman SL, Luo HC, Pozios I, Rajaram M, Pinheiro A, Steenbergen C, Kamel IR, Wahl RL, Bluemke DA, Bengel FM, Abraham MR, Abraham TP. Relationship of delayed enhancement by magnetic resonance to myocardial perfusion by positron emission tomography in hypertrophic cardiomyopathy. Circ Cardiovasc Imaging. 2013;6:210–217. doi: 10.1161/CIRCIMAGING.112.000110. [DOI] [PMC free article] [PubMed] [Google Scholar]
- 17.Elliott PM, Gimeno JR, Tome MT, Shah J, Ward D, Thaman R, Mogensen J, McKenna WJ. Left ventricular outflow tract obstruction and sudden death risk in patients with hypertrophic cardiomyopathy. Eur Heart J. 2006;27:1933–1941. doi: 10.1093/eurheartj/ehl041. [DOI] [PubMed] [Google Scholar]
- 18.Monserrat L, Elliott PM, Gimeno JR, Sharma S, Penas-Lado M, McKenna WJ. Non-sustained ventricular tachycardia in hypertrophic cardiomyopathy: an independent marker of sudden death risk in young patients. J Am Coll Cardiol. 2003;42:873–879. doi: 10.1016/s0735-1097(03)00827-1. [DOI] [PubMed] [Google Scholar]
- 19.Wang W, Lian Z, Rowin EJ, Maron BJ, Maron MS, Link MS. Prognostic Implications of Nonsustained Ventricular Tachycardia in High-Risk Patients With Hypertrophic Cardiomyopathy. Circ Arrhythm Electrophysiol. 2017;10 doi: 10.1161/CIRCEP.116.004604. [DOI] [PubMed] [Google Scholar]
- 20.Authors/Task Force m. Elliott PM, Anastasakis A, Borger MA, Borggrefe M, Cecchi F, Charron P, Hagege AA, Lafont A, Limongelli G, Mahrholdt H, McKenna WJ, Mogensen J, Nihoyannopoulos P, Nistri S, Pieper PG, Pieske B, Rapezzi C, Rutten FH, Tillmanns C, Watkins H. 2014 ESC Guidelines on diagnosis and management of hypertrophic cardiomyopathy: the Task Force for the Diagnosis and Management of Hypertrophic Cardiomyopathy of the European Society of Cardiology (ESC) Eur Heart J. 2014;35:2733–2779. doi: 10.1093/eurheartj/ehu284. [DOI] [PubMed] [Google Scholar]
- 21.Liu H, Pozios I, Haileselassie B, Nowbar A, Sorensen LL, Phillip S, Lu DY, Ventoulis I, Luo H, Abraham MR, Abraham TP. Role of Global Longitudinal Strain in Predicting Outcomes in Hypertrophic Cardiomyopathy. Am J Cardiol. 2017;120:670–675. doi: 10.1016/j.amjcard.2017.05.039. [DOI] [PubMed] [Google Scholar]
- 22.Dilsizian V, Bonow RO, Epstein SE, Fananapazir L. Myocardial ischemia detected by thallium scintigraphy is frequently related to cardiac arrest and syncope in young patients with hypertrophic cardiomyopathy. J Am Coll Cardiol. 1993;22:796–804. doi: 10.1016/0735-1097(93)90193-5. [DOI] [PubMed] [Google Scholar]
- 23.Chan RH, Maron BJ, Olivotto I, Pencina MJ, Assenza GE, Haas T, Lesser JR, Gruner C, Crean AM, Rakowski H, Udelson JE, Rowin E, Lombardi M, Cecchi F, Tomberli B, Spirito P, Formisano F, Biagini E, Rapezzi C, De Cecco CN, Autore C, Cook EF, Hong SN, Gibson CM, Manning WJ, Appelbaum E, Maron MS. Prognostic value of quantitative contrast-enhanced cardiovascular magnetic resonance for the evaluation of sudden death risk in patients with hypertrophic cardiomyopathy. Circulation. 2014;130:484–495. doi: 10.1161/CIRCULATIONAHA.113.007094. [DOI] [PubMed] [Google Scholar]
- 24.Doltra A, Amundsen BH, Gebker R, Fleck E, Kelle S. Emerging concepts for myocardial late gadolinium enhancement MRI. Curr Cardiol Rev. 2013;9:185–190. doi: 10.2174/1573403X113099990030. [DOI] [PMC free article] [PubMed] [Google Scholar]
- 25.Passini E, Minchole A, Coppini R, Cerbai E, Rodriguez B, Severi S, Bueno-Orovio A. Mechanisms of pro-arrhythmic abnormalities in ventricular repolarisation and anti-arrhythmic therapies in human hypertrophic cardiomyopathy. J Mol Cell Cardiol. 2016;96:72–81. doi: 10.1016/j.yjmcc.2015.09.003. [DOI] [PMC free article] [PubMed] [Google Scholar]
- 26.Lan F, Lee AS, Liang P, Sanchez-Freire V, Nguyen PK, Wang L, Han L, Yen M, Wang Y, Sun N, Abilez OJ, Hu S, Ebert AD, Navarrete EG, Simmons CS, Wheeler M, Pruitt B, Lewis R, Yamaguchi Y, Ashley EA, Bers DM, Robbins RC, Longaker MT, Wu JC. Abnormal calcium handling properties underlie familial hypertrophic cardiomyopathy pathology in patient-specific induced pluripotent stem cells. Cell Stem Cell. 2013;12:101–113. doi: 10.1016/j.stem.2012.10.010. [DOI] [PMC free article] [PubMed] [Google Scholar]
- 27.Biagini E, Coccolo F, Ferlito M, Perugini E, Rocchi G, Bacchi-Reggiani L, Lofiego C, Boriani G, Prandstraller D, Picchio FM, Branzi A, Rapezzi C. Dilated-hypokinetic evolution of hypertrophic cardiomyopathy: prevalence, incidence, risk factors, and prognostic implications in pediatric and adult patients. J Am Coll Cardiol. 2005;46:1543–1550. doi: 10.1016/j.jacc.2005.04.062. [DOI] [PubMed] [Google Scholar]
- 28.Schelbert HR. Anatomy and physiology of coronary blood flow. J Nucl Cardiol. 2010;17:545–554. doi: 10.1007/s12350-010-9255-x. [DOI] [PMC free article] [PubMed] [Google Scholar]
- 29.Abraham MR, Selivanov VA, Hodgson DM, Pucar D, Zingman LV, Wieringa B, Dzeja PP, Alekseev AE, Terzic A. Coupling of cell energetics with membrane metabolic sensing. Integrative signaling through creatine kinase phosphotransfer disrupted by M-CK gene knock-out. J Biol Chem. 2002;277:24427–24434. doi: 10.1074/jbc.M201777200. [DOI] [PubMed] [Google Scholar]
Associated Data
This section collects any data citations, data availability statements, or supplementary materials included in this article.
Supplementary Materials
(A) Global and regional MBF at rest, and (B) following vasodilator stress in HC patients stratified by presence or absence of the composite outcome, characterized by heart failure, sustained ventricular arrhythmia, stroke and death, as defined by Castagnoli et al6. HC patients with the composite outcome demonstrated lower global rest/stress MBF, as well as lower MBF in the lateral wall at rest/stress, when compared to HC patients without the composite outcome. *p<0.05.
Low stress MBF (<1.72 ml/min/g) in the lateral wall (red line) was associated with greater risk of having the composite endpoint (heart failure, sustained ventricular arrhythmia, stroke and death), in our HC cohort (Log-Rank p=0.017).
Low stress MBF (<1.72 ml/min/g) in the lateral wall (red line) was not associated with greater risk for All-VT (sustained-VT+NSVT) in our HC cohort (Log-Rank p=0.26).


