

SUMMARY
We analyzed 921 adenocarcinomas of esophagus, stomach, colon and rectum to examine shared and distinguishing molecular characteristics of gastrointestinal tract adenocarcinomas (GIAC). Hypermutated (HM) tumors were distinct regardless of cancer type and comprised those enriched for insertions/deletions, representing microsatellite instability cases with epigenetic silencing of MLH1 in the context of CpG Island Methylator Phenotype (CIMP), plus tumors with elevated single nucleotide variants (HM-SNV) associated with mutations in POLE. Tumors with chromosomal instability (CIN) were diverse, with gastroesophageal adenocarcinomas harboring fragmented genomes associated with genomic doubling and distinct mutational signatures. We identified a group of tumors in the colon and rectum lacking hypermutation and aneuploidy termed Genome Stable (GS) and enriched in DNA hypermethylation and mutations in KRAS, SOX9 and PCBP1.
Keywords: Cancer, Tumor, Genomic, Esophagus, Stomach, Colon, Rectum, Colorectal, Methylation, Epigenetic
Graphical Abstract
Liu et al. analyze 921 gastrointestinal (GI) tract adenocarcinomas and find that hypermutated tumors are enriched for insertions/deletions, upper GI tumors with chromosomal instability harbor fragmented genomes, and a group of genome stable colorectal tumors are enriched in mutations in SOX9 and PCBP1.
INTRODUCTION
Traditional classifications of tumors have utilized tissue of origin and histologic types. These categories have been refined with comprehensive molecular characterizations across large numbers of tumors. Adenocarcinomas of the gastrointestinal tract share similar endodermal developmental origins and exposure to common insults that promote tumor formation. We sought to evaluate molecular characteristics that distinguish gastrointestinal tract adenocarcinomas (GIAC) from other cancers and to investigate the molecular features of GIAC across anatomic boundaries to provide insight into the pathogenesis of these deadly malignancies.
Approximately 1.4 million people die each year worldwide from adenocarcinomas of the esophagus, stomach, colon or rectum (Arnold et al., 2015; Torre et al., 2016). Non-surgical treatment approaches have made only modest progress over the past half-century, inspiring efforts to better understand the biological basis of these cancers as a foundation for improving prevention, screening and therapy. Prior studies that separately evaluated GIAC of the upper (gastroesophageal) and lower (colorectal) GI tract found subgroups such as chromosomal instability (CIN), microsatellite instability (MSI) and tumors with hypermethylation phenotypes. However, systematic efforts to characterize how shared molecular processes present differently across the GI tract have not been undertaken.
RESULTS
The Cancer Genome Atlas Network obtained fresh frozen tissues from 921 primary GIAC (79 esophageal, 383 gastric, 341 colon, and 118 rectal cancers) without prior chemotherapy or radiotherapy. All patients provided informed consent, and collections were approved by local Institutional Review Boards. Adjacent non-malignant tissues were obtained from 76 patients. We characterized samples by single-nucleotide polymorphism (SNP) array profiling for somatic copy-number alterations (SCNA), whole-exome sequencing, array-based DNA methylation profiling, messenger RNA (mRNA) sequencing, microRNA sequencing, and for a subset of samples, reverse-phase protein array (RPPA) profiling. Key characteristics of tumor samples are summarized in Table S1.
Shared Features of GIAC
We investigated whether GIAC share characteristic molecular features compared to other adenocarcinomas (Table S2). Joint analysis of GIAC together with adenocarcinomas from breast (n=1001), endometrium (506), cervix (24), bile ducts (33), lung (240), pancreas (183), prostate (381) and ovaries (503) revealed that GIAC clustered together by DNA hypermethylation profiles (Figure S1A), mRNA (Figure S1B), and Reverse Phase Protein Array data (RPPA) (Figure S1C). These results are consistent with integrated clustering analysis across multiple platforms of 10,000 TCGA tumors, which identified GIAC as a distinct group (Hoadley et al., 2018).
Genes mutated significantly more frequently in GIAC compared to non-GI adenocarcinomas (non-GIAC) included FBXW7, SMAD2, SOX9, and PCBP1 (Figure 1A and Table S3). A GIAC-focused analysis revealed that ATM, PZP, CACNA1C, and FBN3 were significantly mutated genes not previously reported in TCGA studies of single cancer types (Figure S1D and Table S3). We evaluated SCNA data to identify amplifications and deletions more common in GIAC than in non-GIAC (Figures 1B and S1E and Table S4). Arm-level gain of chromosome 13q was GIAC-specific (Figure S1F), noteworthy as this region containing tumor suppressor RB1 is often deleted in non-GIAC. CDX2 (13q12.2) and KLF5 (13q22.1) encoding two transcription factors in this amplified region may contribute to GIAC pathogenesis. Other genes preferentially amplified in GIAC included CDK6 (7q21.2), GATA6 (18q11.2), GATA4 (8p23.1), EGFR (7p11.2), CD44 (11p13), BCL2L1 (20q11.21), FGFR1 (8p11.22), and IGF2 (11p15.5). APC and SOX9 deletions were observed preferentially in GIAC, as were frequent mutations in these genes.
Figure 1. Genomic Features of Gastrointestinal Adenocarcinomas.

(A) Significantly mutated genes in gastrointestinal adenocarcinomas (GIAC) indicated by green circles, significantly mutated genes identified in other adenocarcinomas (non-GIAC) indicated by red circles, and genes identified as significantly mutated in all adenocarcinomas indicated by white circles. (B) Genes identified as significantly recurrently amplified (left) or deleted (right) in GIAC compared to in non-GIAC. (C) DNA hypermethylation frequency (top), mutation density (middle), and arm-level and focal copy-number events (bottom) in GIAC and non-GI AC. (D) Percent GOF or LOF events in developmental transcription factors by cancer type. See also Figure S1 and Tables S1–S6.
GIAC displayed markedly higher frequencies of CpG island hypermethylation than did non-GIAC (Figure 1C, upper graphs). This finding is attributable in part to the high frequency of CpG Island Methylator Phenotype (CIMP) in GIAC, but was also evident in non-CIMP tumors. The average density of somatic mutations was also higher in GIAC. Clusters of tumors with high mutation densities were observed in gastric and colorectal GIAC as well as in breast and uterine non-GIAC (Figure 1C, middle graphs). Frequent SCNA were observed in all GIAC, especially in esophageal adenocarcinomas (EAC), and ovarian and a subset of breast non-GIAC (Figure 1C, bottom graphs).
Gene expression analysis revealed 553 genes that were differentially expressed in GIAC compared to non-GIAC, after exclusion of genes that differed among corresponding normal tissues (Figure S1G and Table S5). Supervised multivariate orthogonal partial least squares-discriminant analysis ranked 51 of these 553 genes to have significantly higher expression in GIAC. Notably, these genes include several that have roles in gastrointestinal stem cell biology (e.g. OLFM4, CD44, and KLF4) and genes related to the EGFR signaling pathway (Figure S1G).
We next investigated whether genes encoding 139 transcription factors (TFs) that are important in GI development (Noah et al., 2011; Sherwood et al., 2009) displayed distinct gain- or loss-of-function events in GIAC compared to non-GIAC. Amplifications were considered gain-of-function (GOF) events, while deletions, epigenetic silencing, and nonsense or indel mutations were considered loss-of-function (LOF) events (Table S6). We found 33 transcription factor genes with GOF or LOF exceeding 5% in at least one GIAC tumor type (Figure 1D). CDX2 encodes a homeobox transcription factor expressed early in endoderm development with evidence as either a lineage-survival oncogene (Salari et al., 2012) or a tumor-suppressor gene (Bonhomme et al., 2003) in colorectal cancers (CRC), depending on context, and is also a marker of intestinal metaplasia in Barrett’s esophagus (Moons et al., 2004). Interestingly, we observed CDX2 amplification in esophageal, colon, and rectal adenocarcinomas, but LOF in gastric cancers. Although amplifications in the genomic loci containing the stem-cell transcription factor KLF5 gene were found in all GIAC, these amplifications were associated with increased stemness only in EAC based on a gene-expression signature (Malta et al., 2018) (Figure S1H).
Molecular Subtypes within GIAC
Other studies have relied on gene expression, oncogenic pathway, or histopathological criteria for subtype delineation among GIAC (Budinska et al., 2013; Cristescu et al., 2015; Dienstmann et al., 2017; Guinney et al., 2015; Roepman et al., 2014; Tan et al., 2011). We found that unsupervised clustering of GIAC using mRNA, miRNA, and RPPA data was strongly influenced by tissue type, thus complicating defining molecular groups spanning anatomic boundaries. By contrast, evaluation of mutations, copy-number alterations, and DNA methylation patterns yielded tumor subtypes spanning tissue boundaries (Figure S1A). Our subgroups are consistent with those identified by recent genomic research across GIAC (Cancer Genome Atlas Research Network, 2012, 2014, 2017; Cristescu et al., 2015; Secrier et al., 2016; Wang et al., 2014), and rely on molecular features generally evaluable by the clinical community.
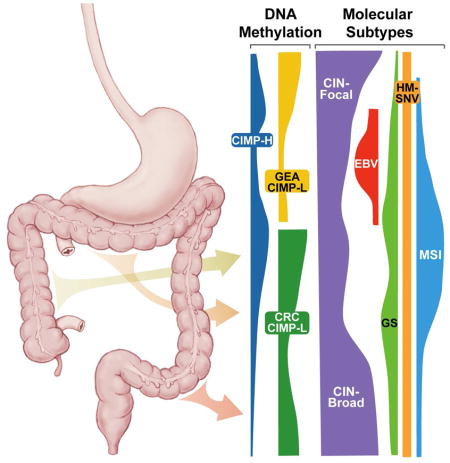
A subgroup of tumors was characterized by a high Epstein-Barr Virus (EBV) burden, as previously determined via mRNA and miRNA analysis (Cancer Genome Atlas Research Network, 2014) (Figure 2A). EBV+ tumors, found only in the stomach (n = 30), display the most extensive hypermethylation of any tumor type in TCGA (see Figure S4.6 in (Cancer Genome Atlas Research Network, 2014). Hypermutated tumors (n = 157), defined by mutation density > 10 per megabase (Mb) (Figure S2A) were further substratified based on the implied mechanism of replication error. MSI, arising from defective DNA mismatch repair, often yields insertion-deletion (indel) mutations in addition to single nucleotide variants (SNV) (Sia et al., 1997), whereas hotspot mutations in polymerase E (POLE) are associated with SNV-predominant profiles (Cancer Genome Atlas Research Network, 2012; Palles et al., 2013; Zhou et al., 2009) (Figure 2B). Hypermutated samples with an indel density of > 1 per Mb and an indel/SNV ratio > 1/150 consisted of almost all tumors with clinically-defined MSI (MSI, n = 138; 54% gastroesophageal or GE; 46% colorectal or CR) (Figure S2B). All other hypermutated samples were categorized as Hypermutated-SNV (HM-SNV, n = 19 (n = 11 with POLE mutations), (47% GE; 53% CR) (Figure 2B and S2B). The remaining two groups were distinguished by presence or absence of extensive SCNA (Figure S2C). Chromosomal instability (CIN) tumors (n = 625, 48% GE; 52% CR) exhibited marked aneuploidy, defined by a clonal deletion score (CDS, See STAR Methods) > 0.0249, which is largely determined by chromosome- and arm-level losses. By contrast, Genome stable (GS) n = 109, 47% GE; 53% CR) samples lacked such aneuploidy (Figure 2B and S2B).
Figure 2. Molecular Subtypes of Gastrointestinal Adenocarcinomas.

(A) Flowchart of molecular subtypes: Epstein-Barr virus (EBV)-positive (red); hypermutated-single-nucleotide variant predominant (HM-SNV) (gold); microsatellite instability (MSI) (blue); chromosomal instability (CIN) (purple); and genomically stable (GS) (green). (B) 3D plot of GIAC by SNV density, indel density, and clonal deletion score (CDS). Tumors annoted as Upper GI (crosses) and lower GI (circles) and color-coded by subtypes. (C) IFNγ pathway score (top) and CD8+ T-cell score (adjusted for total leukocytes; bottom) by subtypes stratified by upper vs lower GI. Horizontal bars indicate median values, boxes represent interquartile range, and whiskers indicate values within 1.5 times interquartile range. (D) Unsupervised analysis of DNA methylation across GIAC. (E, F) Distribution of subtypes (E) and CIMP subgroups (F) across anatomic regions. (G, H) Distribution of MLH1/CDKN2A silencing (G) and subtypes (H) in CIMP-H tumors by anatomic region. See also Figure S2.
We evaluated the relationship between our molecular subtypes and consensus molecular subtypes (CMS), which have been established for CRC based primarily on gene expression (Guinney et al., 2015). We applied the CMS classification system to the lower GI tumors in our study and found a significant association between the two groupings (p < 2.2×10⁻¹⁶), but with noteworthy differences (Figure S2D). The CMS1 - MSI Immune grouping did not discriminate MSI tumors from the HM-SNV tumors (Figure S2B). A substantial fraction of GS CRC were represented in the CMS3 - Metabolic subtype (p = 1.6×10⁻⁶), but the CMS subtype system appeared to be largely unable to distinguish CIN and GS (Figure S2D).
Our molecular groupings also correlated with key immune features of GIAC (Figure 2C and S2E). As previously reported, EBV+ tumors possessed the highest gene expression scores for CD8 T-cells, M1-macrophages, and IFNγ signatures (Figure 2C and S2E) (Derks et al., 2016; Koh et al., 2017). MSI tumors showed the next greatest IFNγ signature, consistent with reported immunogenicity of MSI tumors (Guinney et al., 2015). Moreover, MSI tumors displayed diverse immune signatures depending on their tissue of origin (Figures S2F and S2G); for example, checkpoint protein CD276 was significantly enriched in MSI CRC whereas ENTPD1 was preferentially expressed in MSI gastroesophageal adenocarcinomas (GEA) (Figure S2G). HM-SNV also demonstrated heterogeneity in immune signature expression when comparing the upper and lower GI tract (Figure S2F). Of translational importance, an attenuation in HLA/antigen presentation (Figure S2F) and significant elevation in NK-cell gene expression was found in HM-SNV CRC (Figure S2H), suggesting that NK cells are found in a subset of tumors and are capable of anti-tumor responses (Wagner et al., 2017). The cytotoxic activity of NK cells is finely regulated by the integration of activating and inhibitor cues (Ljunggren and Malmberg, 2007), and cells lacking MHC expression often are subjected to NK cell cytotoxicity due to the absence of inhibitory cues mediated by killer-cell immunoglobulin-like receptor (KIR). These data suggest agents to enhance NK activity may be a therapeutic option for HM-SNV tumors.
Unsupervised clustering of DNA methylation data across GIAC using cancer-associated methylated sites (excluding CpGs with tissue-specific methylation) revealed extensive CpG island methylation in the EBV+ gastric cancers, distinguishing these tumors (Figure 2D), as previously noted by us and others (Cancer Genome Atlas Research Network, 2014; Matsusaka et al., 2011; Wang et al., 2014). The remaining tumors could be characterized as those lacking a CIMP phenotype (Non-CIMP) and those displaying a low or high frequency of DNA hypermethylation (CIMP-L and CIMP-H, respectively).
Hypermutated tumors were located primarily in the central part of the GI tract, the distal stomach and proximal colon, whereas CIN tumors were more prevalent in the anatomic extremes, the esophagus and distal colon/rectum (Figure 2E) (Budinska et al., 2013). Although CIMP-H occurred throughout the upper GI tract and proximal colon (Figure 2F), epigenetic silencing of MLH1, responsible for MSI, was observed primarily in the distal stomach and proximal colon (Figure 2G). Within the proximal stomach and esophagus, only 4/29 (14%) of CIMP-H tumors exhibited MLH1 epigenetic silencing and MSI, while 23 of the 29 (79%) were MSS and displayed the CIN phenotype (Figure 2H). In the lower GI tract, CIMP-H and MSI were largely absent in the descending colon and rectum (Figure 2E, 2H).
Analysis of Hypermethylation and Hypermutation
MSI tumors exhibited distinct expression features independent of tissue of origin, implying common biological features of this class of tumors (Figure S3A, S3B). Most sporadic MSI cases in both colorectal and gastric cancer arise as a consequence of epigenetic silencing of MLH1 by promoter DNA hypermethylation (Herman et al., 1998; Leung et al., 1999) in the context of CIMP-H (Weisenberger et al., 2006). MSI tumors with MLH1 methylation were associated with BRAFV600E mutation only in the colon, not the stomach (Figure 3A). KRAS mutations were found primarily in CIMP-L tumors of the lower GI tract, whereas KRAS amplification was observed in upper GI tumors (Figure 3A). TFAP2E promoter methylation, which is associated with non-response to chemotherapy in colorectal cancer (Ebert et al., 2012), was found in a substantial fraction of CIMP-H tumors and in almost all EBV+ gastric cancers (Figure 3A). CIMP-H tumors showed near-ubiquitous methylation of the tumor suppressor CDKN2A in gastric and colon MSI tumors (Figure 3A and 3B). However, 39% of the CIMP-H tumors lacked MLH1 silencing and MSI and instead included other classes of GIAC, most commonly CIN tumors in the proximal stomach/esophagus or rectum/descending colon (Figure 2H, 3B).
Figure 3. Analysis of MSI and CIMP Tumors.

(A) Methylation subtypes with four CIMPs: EBV-CIMP (red), CIMP-high (blue), GEA-CIMP low (yellow), CRC-CIMP low (green) with alterations of indicated genes. (B) Methylation profiles of union of CIMP-high and MSI tumors with MLH1 silencing, KRAS, BRAF, MLH1 and MSH2 mutations. (C) Features of MSI tumors stratified by upper vs. lower GI and by CIMP-high status. Horizontal bars indicate median values, boxes represent interquartile range, and whiskers indicate values within 1.5 times interquartile range. (D) Unique and overlapping epigenetically silenced genes (>25%) in upper GI (top left), upper GI tumors excluding EBV+ (top right), lower GI (bottom, left), and MSI (bottom, right). (E) Frequency of silencing (black) and mutation (blue) of select genes in upper GI MSI (vertical axis) vs. lower GI MSI tumors (horizontal axis). See also Figure S3 and Table S7.
Given the tight associations between CIMP-H and MSI and their heterogeneity across anatomic boundaries, we studied the collection of tumors containing either of these features in more detail (Figure 3B). A portion of MSI cases lacking both MLH1 methylation and the CIMP phenotype contained somatic mutations in MLH1 or MSH2, indicating an alternative route to loss of DNA mismatch repair (Figure 3B, right side). These tumors were preferentially associated with mutations in KRAS rather than BRAF. A small number of MSI tumors (n=8) could not be explained by genetic or epigenetic inactivation of a mismatch repair gene.
Broadly, the MSI group of CRC harbored lower WNT signatures than did other CRC (Figure S3C, S3D), a finding that may be attributable to a reduced reliance of CIMP-H tumors on WNT signaling. Among MSI CRC, those arising in the context of CIMP-H have a lower percentage of APC mutation (28%) than those arising in either CIMP-L (78%) or non-CIMP (58%) (Fisher Exact p = 0.0091). This finding holds true for MSS CIMP-H tumors as well, and is discussed in the GS subtype section below. CIMP-H MSI CRC showed a reduced combined frequency of either APC or CTNNB1 mutations and decreased WNT gene expression signatures compared to non-CIMP-H MSI cases, and were more similar to upper GI MSI tumors in their lower reliance on WNT activation (Figure 3C). Despite the reduced frequency of APC and CTNNB1 mutations, MSI CIMP-H tumors displayed overall greater mutational densities and arose at an older age of onset than did non-CIMP-H MSI cases or upper GI MSI cases (Figure 3C).
We investigated the genes silenced by promoter hypermethylation in the molecular subgroups (Figure 3D, 3E, and Table S7). Pathway analysis of epigenetically silenced genes among all subgroups revealed enrichment for genes encoding DNA binding proteins and transcription factors, consistent with previous findings of enrichment for stem-cell Polycomb Target Genes (Widschwendter et al., 2007). We identified 135 genes silenced in at least 25% of the upper or lower GI MSI tumors and compared their relative frequency of silencing and frequency of several key gene mutations (Figure 3E). HUNK, a negative regulator of intestinal cell proliferation (Reed et al., 2015), was found to be frequently silenced in MSI tumors. Another frequently silenced gene, ELOVL5, lies within the locus with germline variants most significantly linked to survival of CRC patients (Phipps et al., 2016).
Molecular Features of the CIN Subtype
The landscape of SCNAs revealed a more finely fragmented genome in GEA compared to CRC, despite an overall similar pattern of affected regions of the genome (Figure 4A). Evaluation of SCNA distribution, categorized by both focality and intensity, revealed higher prevalence of focal copy-number events within the CIN GEA population (Figure 4B and S4A). The difference between upper and lower GI was greater for focal amplifications than for deletions (Figure 4B), primarily evident in high-amplitude focal amplifications (Figure S4A). We developed a score that captures the quantity and intensity of focal high-level amplicons (see STAR Methods). CIN tumors with a higher score were designated CIN-Focal (CIN-F) whereas those with a lower score, and therefore low-amplitude, broader amplicons, were called CIN-Broad (CIN-B) (Figure 4C). The distribution of these two classes of CIN differed between upper and lower GIAC, with CIN GEA displaying 74% CIN-F and 26% CIN-B, and CRC showing reversed proportions consisting of 22% CIN-F and 78% CIN-B (Figure 4C). Despite this difference between upper and lower GI tumors, the ratios of CIN-B/CIN-F did not vary anatomically within upper GI tumors or within the lower GI tract tumors (Figure S4B). Notably, in addition to the higher prevalence of CIN-F in upper GIAC, such CIN-F GEA displayed a higher intensity in the focal-amplification score compared to their CIN-F CRC counterparts (Figure S4C). CIN-F GEA was associated with advanced tumor stage, underscoring its potential clinical significance (Figure 4D).
Figure 4. Molecular Features of the CIN Subtype in Upper GI.

(A) Copy-number heatmap of non-hypermutated GIAC with amplification (red) and deletion (blue) with upper GI CIN tumors (top), CIN CRC (middle) and GS (bottom). (B) Plots of arm-level and focal copy-number events in CIN tumors by upper and lower GI tract. Horizontal bars indicate median values, boxes represent interquartile range, and whiskers indicate values within 1.5 times interquartile range. (C) Distribution of CIN-F (CIN-Focal) score by upper and lower GI CIN tumors. CIN-B denotes CIN-Broad. (D) Distribution of CIN-F score by clinical stage in Upper GI. Horizontal bars indicate median values, boxes represent interquartile range, and whiskers indicate values within 1.5 times interquartile range. (E) Whole genome doubling (WGD) in CIN-F and CIN-B tumors in the upper GI tract; WGD1 indicates one WGD, and WGD2 indicates >WGD (F) Frequency of distinct classes of somatic alterations in RAS and receptor tyrosine kinases (RTK; KRAS, PIK3CA, BRAF, ERBB3, ERBB2, NRAS, EGFR, FGFR1, FGFR2), cell cycle (CC; FBXW7, CCNE1, CDK6, CDKN2A, CDKN1B, CCND1, CCND2) and tumor suppressor genes (TSG) including WNT(APC, RNF43, SOX9, TCF7L2, CTNNB1), TGFβ: TGFBR2, ACVR2A, ACVR1B, SMAD4, SMAD2, SMAD) and TP53 in upper GI CIN-F and CIN-B tumors (G) Schematic model of CIN-F and CIN-B pathogenesis in upper GI. See also Figure S4.
Although CIMP frequency displayed an anatomic gradient within upper GI (Figure S4D), we found no correlation of CIMP class with arm-level or focal SCNA in CIN (Figure S4E). CIN-F GEA demonstrated significantly more whole-genome duplication (WGD) than did CIN-B GEA, 68% vs. 42% (Figure 4E and S4F), with evidence of two or more genome doublings (WGD2) in 18% of CIN-F, compared to 7% of CIN-B in upper GI CIN tumors. WGD2 was associated with poor survival in GEA, independent of age and stage (Figure S4G). However, the strong association of genomic doubling and CIN-F was not observed in CRC, despite similar total rates of genome duplication (Figure S4H; 59% in lower GI and 61% in upper GI).
CIN-F GEA sustained significantly more frequent focal amplification of genes encoding receptor tyrosine kinases (RTKs), KRAS and cell cycle mediators (Figure 4F). In contrast, CIN-B GEA more commonly sustained activating mutations of oncogenes (e.g. KRAS and ERBB2) than did GEA-CIN-F tumors (Figure 4F). ERBB2 amplifications significantly co-occurred with CCNE1 amplifications (p = 0.039) and trended towards co-occurrence with gains in chr. 20q/SRC (p = 0.0692). Intriguingly, activating mutations in ERBB2 co-occurred with ERBB2 amplifications (p = 0.0087). CIN-B GEA harbored more frequent somatic inactivation of tumor suppressors related to cell cycle regulation (e.g. CDKN2A), WNT-pathway activation (e.g. APC), and TGFβ regulation (e.g. SMAD2 and SMAD4) than CIN GEA-F. By contrast, CIN-F GEA showed a higher frequency of TP53 mutations (Figure 4F; 76% vs. 54%) and higher rates of oncogene amplifications (Figure 4G).
Among lower GI CIN tumors, the differences in somatic mutations and copy-number alterations found in CIN-F and CIN-B tumors were modest (Figure S4I), although CIN-F did associate with poorer survival in CRC (Cox regression p = 0.0053, adjusted for stage, age, and molecular subtype). We identified amplifications including CDX2, ERBB2, and CCND2 enriched in these tumors. Consistent with the different patterns of CIN between upper and lower GI cancers, we found that ERBB2+ CRC not only harbor lower CIN-F scores (Figure S4J) but also fewer co-occuring genomic alterations than ERBB2+ GEA (Figure S4K). These findings are consistent with efficacy in CRC of ERBB2 therapy without chemotherapy (Sartore-Bianchi et al., 2016), compared to ERBB2+ GEA, which often carry co-occuring amplified oncogenes implicated in de novo resistance (Janjigian et al., 2018; Kim et al., 2014; Sartore-Bianchi et al., 2016).
CIN-B and CIN-F CRC displayed comparable rates of APC and KRAS mutations (Figure S4I; APC: 79% vs 87%; KRAS: 35 vs 44%). However, PIK3CA mutations and TGFβ pathway alterations were more common in CIN-B CRC than in CIN-F CRC (Figure S4I). Both groups of CIN CRC had somatic patterns more closely resembling the CIN-B GEA group, in which oncogenes were activated more commonly by mutation than by amplification. These data suggest that the preponderance of early APC loss and selection for mutational activation of oncogenes like KRAS may precede a form of aneuploidy and transformation distinct from the catastrophic aneuploidy and resulting oncogene amplification occurring in GEA (Figure 4G).
Among CIN CRC, we observed more frequent CIMP, primarily CIMP-L, in proximal, right-sided CIN tumors and less frequent CIMP in distal, left-sided ones (Figure S5A). Arm-level SCNAs were significantly less frequent in CIMP+ CIN CRC (Wilcoxon p = 2.7×10⁻⁹), despite the lack of an overall difference in focal alterations (Figure S5B). Among chromosome arms, gain of 20q was most enriched in non-CIMP CIN CRC, with a mean copy-number gain of 1.8 (ploidy-adjusted), compared to 1.1 in CIMP+ CIN CRC (Figure S5C). By contrast, except for TP53, which was more frequently mutated in non-CIMP CIN tumors, the frequency of somatic mutations was significantly higher in CIMP+ CIN CRC (Figure S5D), notably affecting the TGFβ pathway and key oncogenes including KRAS/NRAS/BRAF and PIK3CA. Dichotomizing CIN CRC tumors by CIMP status thus showed parallels to the division of upper GI CIN tumors by CIN-F/CIN-B status. CIMP+ CIN CRC, like CIN-B GEA, harbored more oncogene mutations (Figure 5A). Taken together, these data suggest that CIMP status may play an important role in shaping evolution of CIN tumors in the lower GI tract, and to a lesser extent in the upper GI tract.
Figure 5. Molecular Features of CIN and GS Colorectal Cancer.

(A) Frequency of somatic alterations in indicated genes or pathways in non-CIMP CIN, CIMP-H/L CIN, and GS lower GI tumors. (B) SCNAs (top), mutation density (middle), and CIMP classes (bottom) across subtypes in lower GI tract. Horizontal bars indicate median values, boxes represent interquartile range, and whiskers indicate values within 1.5 times interquartile range. (C) Distribution of somatic mutations in SOX9 and PCBP1 in lower GI GS. (D) Schematic model of pathogenesis of molecular subtypes in lower GI. (E) Frequency of mutations in indicated genes in lower GI CIN/GS stratified anatomically.See also Figure S5.
Molecular Features of the GS Subtype
Although CRC are classically divided between hypermutated/MSI and CIN (Bijlsma et al., 2017), we detected a population of CRC lacking both aneuploidy/CIN and hypermutation, a group we classified as GS (Figure 5B). Unlike with MSI, these GS CRC shared few underlying biologic features with GS in upper GIAC. As we reported earlier (Cancer Genome Atlas Research Network, 2014), upper GI GS tumors are enriched for the diffuse-type gastric cancer (65.7%) and commonly harbor mutations in CDH1 and RHOA (Figure S5E). Thus, upper GI GS, like EBV+ tumors, represent an essentially unique entity confined to stomach.
GS CRC shared features of other CRC; like the CIN CRC, GS CRC shared a predilection for loss of APC (GS 81% vs CIN 85%, Figure S5F). GS CRC were more common in ascending and transverse colon (Figure 2E) and when compared to the CIN CRC, showed significant enrichment for the CIMP-L phenotype (79% vs 40%, p = 1.2×10⁻⁹, Figure 5B) and for the CMS3 metabolic consensus molecular subtype (p = 1.6×10⁻⁶, Figure S2D) (Guinney et al., 2015). Despite having fewer SCNAs, a subset of GS CRC showed amplifications of IGF2 (q value < 0.05) (Figure S5G). MAPK pathway mutations were more common in these tumors, with KRAS, NRAS or BRAF mutated in 69%, 10%, and 9% of tumors, respectively, and with PIK3CA mutations present in 43%, compared to 22% of CIN CRC (Figure 5A). Consistent with the relative lack of aneuploidy, TP53 mutations were less common (16%) in GS compared to CIN tumors (80%) (Figure S5E). However, we observed enrichment for somatic mutations in SOX9, which encodes a transcription factor, and in PCBP1, which encodes an RNA-binding protein that regulates splicing, mRNA stability, and translation (Leffers et al., 1995) (Figure 5A, 5C, S5H). SOX9, mutated in 29% of GS CRC, encodes a WNT-regulated transcription factor that controls cell fate and crypt homeostasis in intestinal development (McConnell et al., 2011; Nandan et al., 2014). GS CRC with mutations in SOX9 also had more frequent somatic mutations in the TGFβ pathway genes, including PCBP1 (Figure S5I). Our mutation analysis within GS revealed highly clustered missense mutations in the KH domain of PCBP1 in 13% of GS CRC, raising the potential for a GOF event (Figure 5C). Interestingly, overexpression of wild-type PCBP1 was associated with oxaliplatin resistance in CRC (Guo et al., 2010).
Overall, GS CRC had more frequent mutations in the TGFβ pathway, RAS/RAF genes, and PIK3CA than did CIN CRC (Figure S5F). Comparison of GS CRC to CIN CRC revealed a progressive gradation of features between non-CIMP CIN CRC, CIMP-H or CIMP-L CIN CRC and GS CRC (Figure 5A). These data suggest a pathway to cancer in the colorectum in which APC-mutant cells, typically containing the CIMP-L phenotype, are able to undergo transformation by sustaining additional pathogenic mutations without the need for p53 loss or aneuploidy (Figure 5D).
We had noted earlier that CIMP-H MSI tumors appeared to rely less on WNT signaling. CIMP-H MSS tumors also display reduced rates of APC mutation (47%) compared to CIMP-L (87%) or non-CIMP (86%) (Fisher Exact p = 0.00066). These findings suggest an alternative CRC pathway that is not initiated by mutation of APC, but rather by an epigenetic aberation causing CIMP-H. If MLH1 is silenced in the context of CIMP-H, then the tumor would become MSI, whereas if MLH1 is not affected, the tumor would develop along the CIN pathway to give rise to CIMP-H MSS CIN tumors (Figure 5D). Non-hypermutated CRC from the right-sided (ascending/transverse) colon revealed significantly higher rates of KRAS, PIK3CA and SOX9 mutation than those from the left-sided (descending) colon/rectum (Figure 5E).
Mutational Signatures in GIAC
MSI and POLE signatures dominated the total mutational signature scores among GIAC as a consequence of the high mutational burden in MSI and POLE-deficient tumors in the MSI and lower-GI HM-SNV groups, respectively (Figures S6A and S6B). Signature discovery following removal of hypermutated cases revealed a BRCA signature (COSMIC signature 3), two APOBEC signatures, a signature resembling COSMIC signature 17 with common AA>AC transversions, and a signature dominated by C>T transitions at CpG dinucleotides (COSMIC signature 1) (Figures 6A, 6B, 6C, 6D, 6E and 6F) (Alexandrov et al., 2013; Bignell et al., 2010). The APOBEC signatures contributed minimally to the mutational profile across GIAC (Figures 6B, 6C, S6C and S6D), but the other three signatures had substantial activity in non-hypermutated GIAC with the AA>AC signature limited to upper GIAC (Figures 6B, 6C, 6E, and S6D). A recent study, identified the existence of the BRCA signature in gastric cancers that lacked mutations in BRCA1 and BRCA2 (Alexandrov et al., 2015). We confirmed the presence of BRCA signature activity in GIAC, with significant enrichment of somatic and germline mutations in several homologous recombination genes such as BRCA1, BRCA2 and PALB2 (Figure S6E). BRCA signature activity was also significantly enriched in tumors with epigenetic silencing of BRCA1 or RAD51C, including within EBV+ GCs (Figure S6F). We observed a significant association between BRCA signature activity and upper GI cancers, particularly the CIN subtype (Figure 6D). The BRCA signature was associated only with focal SCNA events (Figure S6G), which are likely initiated by double-strand breaks. The AA>AC signature was also enriched in upper-GI CIN (Figures 6E, S6C and S6D), most notably in the tubular esophagus (Figure S6D). Moreover, this mutational signature was enriched in CIN-F and TP53-mutated upper GI CIN tumors (Figure 6E). The AA>AC signature lacks a known etiology, but its association with GEA and its correlation with higher CIN-F scores raises the possibility that this signature reflects a process that contributes to greater focal aneuploidy observed in GEA compared to CRC and differences in oncogene profiles between upper and lower GIAC (Figure 7).
Figure 6. Gastrointestinal Adenocarcinoma Mutational Signatures.

(A) Mutation signatures in non-hypermutated GIAC displayed by substitution class and sequence immediately 3′ and 5′ to the mutated base. (B) Key molecular features of GIAC by anatomical distribution. (C) Intensities of mutational signatures in CIN and GS subtypes by upper and lower GI. (D) BRCA signature in CIN and GS tumors in the upper and lower GI tract. (E) AA>AC signature stratified by CIN-F and CIN-B (top) and TP53 mutation (bottom) in upper GI CIN tumors. (F) CpG>TpG signature in CIN and GS tumors in upper and lower GI stratified by CIMP status. For all boxplots, horizontal bars indicate median values, boxes represent interquartile range, and whiskers indicate values within 1.5 times interquartile range. See also Figure S6.
Figure 7. Integrated Molecular Comparison of Somatic Alterations Across GIAC Molecular Subtypes.

(A–C) Alterations in select genes and pathways including RTK/RAS/PI3-K (A), TP53, cell cycle (B), and WNT/TGFβ (C). Deep deletions representing loss of more than half of the gene copies for the given ploidy of the tumor, blue; amplifications, red; missense mutations in the COSMIC repository, green; nonsense or frameshift mutations, black. Percentage of somatic alteration is indicated by numbers to the left of each gene box and divided by upper (U) and lower GI (L).
The CpG>TpG pattern, often termed the “aging signature”, was the most common signature among all tumors, but it was especially frequent in right-sided CRC (Figure S6C). This signature is thought to arise from spontaneous hydrolytic deamination of 5-methylcytosine, and is consolidated as a persistent mutation if it occurs during DNA replication. Hence, this signature tracks the cumulative number of cell divisions and aging. Although we observed an association with CIMP status (Figure 6F), we do not believe that this is explained by a simple quantitative difference in DNA methylation. The CIMP hypermethylation is measured primarily at promoter CpG islands, which are unmethylated in normal cells and thus do not sustain many CpG>TpG mutations prior to acquisition of methylation and clonal expansion, whereas the mutation signatures were obtained by exome sequencing of gene bodies, which are generally highly methylated. The association between CIMP status and CpG>TpG signature may reflect the fact that CIMP tumors require more cell divisions to progress and thus acquire more CpG>TpG mutations over time.
DISCUSSION
GIAC originate from columnar epithelium with a shared endodermal origin and display a spectrum of common molecular features such as aneuploidy and microsatellite instability that span anatomic boundaries. GIAC are enriched for activation of the WNT signaling pathway, particularly in the lower GI tract, consistent with the importance of WNT in GI development (Schepers and Clevers, 2012). We found that CIMP-H CRC appeared less dependent on canonical WNT signaling mutations and pathways. GIAC also displayed a predisposition for disruptions in TGFβ and SMAD signaling components. TGFβ signaling helps to maintain intestinal stem cell equilibrium, promoting growth during development, but controlling self-renewal in adult epithelium (Mishra et al., 2005).
The vast majority of sporadic MSI tumors arise as a consequence of promoter methylation of MLH1 in the context of CIMP-H. Methylation profiles of CIMP-H tumors are quite consistent throughout the GI tract. However, MLH1 silencing within CIMP-H is much more anatomically restricted, primarily observed in the distal stomach and proximal (ascending and transverse) colon, but notably uncommon in proximal upper GI cancers. The epithelia of the distal stomach and proximal colon appear more susceptible to oncogenic effects of MLH1 silencing. High rates of epithelial cell turnover with accompanying DNA replication may more effectively consolidate replication-associated errors in these sections of the GI tract. This hypothesis is consistent with the tumor spectrum observed with germline mutations in mismatch repair genes, leading to increased risk of cancers arising in highly proliferative tissues (Lynch et al., 2015). In this scenario, stochastic promoter methylation of MLH1 from CIMP-H would provide less selective advantage when arising in the less proliferative sections of the GI tract.
CIMP-H GIAC possessed other differences in molecular features between various anatomic locations. BRAFV600E mutations occurred almost exclusively in CIMP-H tumors of the ascending colon and were absent from otherwise similar CIMP-H GEAs. In addition, some colorectal CIMP-H tumors with similar DNA methylation profiles lacked BRAFV600E mutations, a finding inconsistent with the proposed role for BRAFV600E mutation as a cause of CIMP-H (Fang et al., 2016). Alternatively, CIMP may provide a permissive environment for BRAFV600E mutation, perhaps by silencing pathways involved in oncogene-induced senescence and apoptosis (Hinoue et al., 2009). Despite the large overlap of CIMP-H and MSI in GIAC, our data revealed that this co-occurrence occurs predominantly in the distal stomach and ascending colon. The etiology for CIMP-H tumors commonly progressing via a CIN pathway in proximal GE and distal CRC is not established.
CIN is a common feature of GIAC and other tumors (Cancer Genome Atlas Research Network, 2012, 2014, 2017; Hoadley et al., 2014). Despite the deleterious effect on cellular and organismal fitness (Sheltzer et al., 2011; Sheltzer et al., 2017; Torres et al., 2007; Williams et al., 2008), CIN with its resultant aneuploidy remains the predominant molecular subtype among GIAC, found most frequently in the proximal upper and distal lower GI tract (Dulak et al., 2012). Unlike tumors with MSI, CIN tumors had more discrepant molecular features between upper and lower GI cancers. Most striking was the preponderance of focal, high amplitude SCNAs, especially amplifications, in GEA. Within CIN GEA, we found that tumors with high CIN-F scores had a strong association with prior genome doubling, a process associated with CIN (Ganem et al., 2007). Amplifications in CIN-F GEA commonly targeted mitogen pathway components, cell cycle regulators, and lineage survival transcription factors, whereas CIN-B and GS tumors more frequently carried activating mutations in these pathways.
A notable finding was the predilection in CIN-B GEA for alterations in tumor suppressors such as CDKN2A, APC and SMAD4. These findings suggest that the marked aneuploidy found within the CIN-F GEA is less apt to occur in precursors with pathogenic alterations other than TP53. One explanation is that precursors with already altered oncogenes/tumor suppressors have less requirement for more ‘catastrophic’ aneuploidy to simultaneously abrogate multiple such checkpoints. By contrast, such marked instability could facilitate transformation in precursors with p53 loss without as many other preexisting pathogenic alterations. Indeed, although p53 loss alone is not sufficient to promote aneuploidy (Bunz et al., 2002), several lines of evidence support its necessity, most likely by circumventing p53-dependent cell cycle arrest in response to damage by reactive oxygen species (ROS) (Guo et al., 2010), to mutations in ataxia telangiectasia (ATM) (Li et al., 2010), or to spindle assembly checkpoint (SAC) activation (Thompson and Compton, 2010). Given these data, the lesser rates of CIN-F in lower GI CIN tumors (compared to CIN tumors of the upper GI tract) may be a consequence of APC loss as an early event in colorectal neoplasia, thus leading to TP53 mutation rarely occurring in the absence of a prior APC loss. Instead, we noted that CIMP status likely has a stronger influence on the features of CIN CRC, with CIMP being associated with mutations in KRAS and in tumor suppressor pathways such as TGFβ. Aneuploid CIMP tumors in the lower GI tract showed lower rates of SCNA, but a greater number of oncogenic mutations compared to non-CIMP. Both upper and lower GI CIN tumors were also associated with the BRCA mutational signature. However, the propensity for greater CIN-F in upper GIAC correlated with the AA>AC mutational signature, a signature of unknown etiology, previously reported in upper GI tumors (Dulak et al., 2013).
Our exploration of the role of CIMP in shaping the features of CIN in CRC became linked with our finding of a GS CRC subtype falling outside the classic CIN/MSI CRC dichotomy. This GS subtype may partially overlap with the previously identified Microsatellite and Chromosome Stable (MACS) CRC (Chan et al., 2001), while showing important differences. The MACS phenotype is an independent predictor of poor outcome (Banerjea et al., 2009), in contrast, GS CRC are enriched for earlier stage tumors. MACS tumors have an elevated proportion of early onset cases (Chan et al., 2001), whereas GS CRC have a higher mean age at diagnosis than CIN cases. Like MACS, HM-SNV cases are microsatellite and genome stable, and also arise in younger patients, so it is possible that some early-onset MACS tumors may have represented unrecognized HM-SNV tumors. The GS CRC overlap with a subgroup identified by gene expression clustering as CMS3 (Guinney et al., 2015) and commonly displaying CIMP-L. Many features enriched in CIMP CIN CRC compared to non-CIMP CIN CRC were even more prevalent in GS CRC. Moreover, we found these tumors to have recurrent mutations in SOX9 and PCBP1. While the presence of frameshift mutations of SOX9 implies LOF, truncating mutations in SOX9 are overexpressed in primary tumor specimens (Javier et al., 2016), making their functional significance unclear. GS CRC with mutations in SOX9 also had more frequent somatic mutations in TGFβ pathway genes, including PCBP1, which impacts TGFβ signaling by regulating Smad3-associated alternative splicing (Tripathi et al., 2016). Given the strikingly low frequency of TP53 mutations in GS CRC, the presence of SOX9 and PCBP1 mutations may cooperate with APC and KRAS mutation to facilitate transformation, despite lack of hypermutation and low levels of aneuploidy.
Our findings also bear some relevance to the evolving field of immunotherapy, which already has established efficacy in MSI tumors. The HM-SNV tumors, which display a large SNV burden in the setting of POLE mutations, did not harbor the equivalent CD8 or IFNγ signatures as did the MSI tumors, perhaps suggesting that indel mutations may better generate neoantigens than do SNVs. The strong signatures in EBV+ tumors suggest a potential for immune checkpoint inhibition in this subset. The reason for consistently higher IFNγ signatures in upper GI compared to lower GI adenocarcinomas when stratified by molecular subtype is less obvious and may simply indicate that GEA are more immunogenic than CRC, results consistent with the presence of clinical responses to PD1 inhibitor monotherapy in MSS GEA, but not in CRC (Jin and Yoon, 2016; Muro et al., 2016).
In summary, these results highlight how processes such as DNA hypermethylation and CIN can manifest themselves in different ways across related tissues. In some instances, as with DNA hypermethylation in upper-GI vs. lower-GI MSI tumors, such differences can be subtle. However, as the exploration of CIN indicates, other processes can lead to substantially different molecular outcomes across these regions. Provision of greater detail in the various manifestations of molecular defects may reveal new opportunities for targeted therapies for these cancers. Furthermore, these data highlight how consideration of molecular subtypes as well as organ of origin will be essential in the study and treatment of cancer.
STAR METHODS
CONTACT FOR RESOURCE SHARING
Further information and requests for resources and reagents should be directed to and will be fulfilled by the Lead Contact, Peter W. Laird (Peter.Laird@vai.org). Sequence data hosted at the GDC is under controlled access. Details for gaining access can be found at (https://gdc.cancer.gov/access-data/data-access-processes-and-tools).
EXPERIMENTAL MODEL AND SUBJECT DETAILS
Human Subjects and Tumor Data Selection
Molecular data were obtained as part of the Cancer Genome Atlas Project, from patients untreated by chemo- or radiation therapy and who provided informed consent; tissue collection was approved by the local Institutional Review Boards (IRBs) as noted below. GIAC cases (n=921) were selected as follows. Of the 559 Upper GI cases (171 ESCA and 388 STAD) in (Cancer Genome Atlas Research Network, 2017), 90 were excluded as ESCC and two as undifferentiated (TCGA-2H-A9GQ, TCGA-VR-A8Q7). Of the remaining 467 Upper GI adenocarcinomas, 462 (79 ESCA, 383 STAD) cases have molecular data available from the five TCGA core platforms (RNASeq, miRNASeq, DNA Methylation, SNP6, and mutation calls). We used germline DNA from blood or nonmalignant gastrointestinal tissue as a reference for detecting somatic alterations. For lower GI, all available TCGA COAD and READ cases were considered, but cases bearing the BCR annotation “Redacted” were excluded, as were cases with Notification: ‘Unacceptable Prior Treatment’ or ‘Item does not meet study protocol’. Review of COAD and READ pathology reports led to the exclusion of three additional COAD cases from this study (TCGA-AA-A022: Pathology report indicates poorly-differentiated carcinoma of the neuroendocrine type; TCGA-AA-A02R: Pathology report shows poorly-differentiated carcinoma with positivity for both S-100 and chromogranin, and focal synaptophysin; and TCGA-AZ-6607: Pathology report indicates this is likely to be a pancreaticobiliary primary tumor metastasizing to colon. The remaining 459 lower GI cases (341 COAD and 118 READ) with molecular data available for the five platforms were retained.
A group of 2,871 non-GIAC cases was constructed from TCGA tumor types BRCA, CESC, CHOL, LUAD, OV, PAAD, PRAD and UCEC, comprising all cases meeting the established criteria of the PanCancer Atlas Consortium (exclusion of Redacted,‘Unacceptable Prior Treatment’ or ‘Item does not meet study protocol’ and cases with no molecular data). For BRCA, CHOL, PRAD, and OV, and UCEC cases annotated as problematic by Expert Pathology Review (marked as AWG_excluded_because_of_pathology in the PanCancerAtlas Merged Annotation File) were excluded. For CESC, LUAD, and PAAD, further exclusions were made based on case review, as follows: CESC, retain only adenocarcinomas; LUAD, exclude samples without histology; PAAD, exclude samples with cellularity < 20%.
Demographic data for patients are as follows: GIAC (60.3% male, median age 68 years, range 29–90 years); Non-GIAC (21.3% male; median age 61 years, range 25 to 90 years).
TCGA Project Management collected necessary human subjects documentation to ensure the project complies with 45-CFR-46 (the “Common Rule”). The program has obtained documentation from every contributing clinical site to verify that IRB approval has been obtained to participate in TCGA. Such documented approval may include one or more of the following:
An IRB-approved protocol with Informed Consent specific to TCGA or a substantially similar program. In the latter case, if the protocol was not TCGA-specific, the clinical site PI provided a further finding from the IRB that the already-approved protocol is sufficient to participate in TCGA.
A TCGA-specific IRB waiver has been granted.
A TCGA-specific letter that the IRB considers one of the exemptions in 45-CFR-46 applicable. The two most common exemptions cited were that the research falls under 46.102(f)(2) or 46.101(b)(4). Both exempt requirements for informed consent, because the received data and material do not contain directly identifiable private information.
A TCGA-specific letter that the IRB does not consider the use of these data and materials to be human subjects research. This was most common for collections in which the donors were deceased.
METHOD DETAILS
Sample Processing
RNA and DNA were extracted from tumor and adjacent normal tissue specimens using a modification of the DNA/RNA AllPrep kit (Qiagen). The flow-through from the Qiagen DNA column was processed using a mirVana miRNA Isolation Kit (Ambion). This latter step generated RNA preparations that included RNA <200 nt suitable for miRNA analysis. DNA was extracted from blood using the QiaAmp blood midi kit (Qiagen). Each specimen was quantified by measuring Abs260 with a UV spectrophotometer or by PicoGreen assay. DNA specimens were resolved by 1% agarose gel electrophoresis to confirm high molecular weight fragments. A custom Sequenom SNP panel or the AmpFISTR Identifiler (Applied Biosystems) was utilized to verify tumor DNA and germline DNA were derived from the same patient. Five hundred nanograms of each tumor and normal DNA were sent to Qiagen for REPLI-g whole genome amplification using a 100 μg reaction scale. Only specimens yielding a minimum of 6.9 μg of tumor DNA, 5.15 μg RNA, and 4.9 μg of germline DNA were included in this study. RNA was analyzed via the RNA6000 Nano assay (Agilent) for determination of an RNA Integrity Number (RIN), and only the cases with RIN >7.0 were included in this study.
Pathology Review
All samples were systematically evaluated by gastroenterological pathologists to confirm the histopathologic diagnosis and any variant histology according to the most recent World Health Organization (WHO) classification(International Agency for Research on Cancer, 2010). All tumor samples were assessed for tumor content (percent tumor nuclei), Tumor samples were evaluated for the presence and extent of inflammatory infiltrate as well as the type of the infiltrating cells in the tumor microenvironment (lymphocytes, neutrophils, eosinophils, histiocytes, plasma cells). Any non-concordant diagnoses among the pathologists were re-reviewed and resolution achieved after discussion.
DNA Sequencing data
Exome capture was performed using Agilent SureSelect Human All Exon 50 Mb according to the manufacturers’ instructions. Briefly, 0.5–3 micrograms of DNA from each sample were used to prepare the sequencing library through shearing of the DNA followed by ligation of sequencing adaptors. All whole exome (WES) and whole genome (WGS) sequencing was performed on the Illumina HiSeq platform. Paired-end sequencing (2 × 101 bp for WGS and 2 × 76 bp for WE) was carried out using HiSeq sequencing instruments; the resulting data was analyzed with the current Illumina pipeline. Basic alignment and sequence QC was done with the Picard and Firehose pipelines at the Broad Institute. Sequencing data were processed using two consecutive pipelines: (1) Sequencing data processing pipeline (“Picard pipeline”). Picard (http://picard.sourceforge.net/) uses the reads and qualities produced by the Illumina software for all lanes and libraries generated for a single sample (either tumor or normal) and produces a single BAM file (http://samtools.sourceforge.net/SAM1.pdf) representing the sample. The final BAM file stores all reads and calibrated qualities along with their alignments to the genome. (2) Cancer genome analysis pipeline (“Firehose pipeline”). Firehose (http://www.broadinstitute.org/cancer/cga/Firehose) takes the BAM files for the tumor and patient-matched normal samples and performs analyses including quality control, local realignment, mutation calling, small insertion and deletion identification, rearrangement detection, coverage calculations and others as described briefly below. The pipeline represents a set of tools for analyzing massively parallel sequencing data for both tumor DNA samples and their patient-matched normal DNA samples. Firehose uses GenePattern (Reich et al., 2006) as its execution engine for pipelines and modules based on input files specified by Firehose. The pipeline contains the following steps:
Quality control. This step confirms identity of individual tumor and normal to avoid mix-ups between tumor and normal data for the same individual.
Local realignment of reads. This step realigns reads at sites that potentially harbor small insertions or deletions in either the tumor or the matched normal, to decrease the number of false positive single nucleotide variations caused by misaligned reads.
Identification of somatic single nucleotide variations (SSNVs) – This step detects candidate SSNVs using a statistical analysis of the bases and qualities in the tumor and normal BAMs, using Mutect (Cibulskis et al., 2013).
Identification of somatic small insertions and deletions – In this step, putative somatic events were first identified within the tumor BAM file and then filtered out using the corresponding normal data, using Indellocator (Ratan et al., 2015).
Mutation Data
A series of quality-control filters according to the MC3 MAF were applied to mutations: (1) A filter for artificial CC>CA mutations caused by sample oxidation (8-oxoguanine) was applied to remove potential CC>CA artifacts (Costello et al., 2013); (2) Variants that were frequently observed in the Exome Aggregation Consortium (http://exac.broadinstitute.org) were excluded; (3) mutations with evidence of strand bias were excluded; (4) mutations with “ndp” labels were excluded; (5) duplicated mutations due to redundant tumor or normal samples were excluded. Somatic mutation calling was focused on coding mutations spanning missense and nonsense mutations, in-frame and frame-shift indels, and mutations that occurred on splice site, start codon, or stop codon.
The MutSig2CV (Cancer Genome Atlas Research Network, 2011) was applied to the quality-controlled mutation data to evaluate significance of mutated genes and estimate mutation densities of samples. MutSig2CV combines evidence from background mutation rate, clustering of mutations on hotspots and conservation of mutated sites to calculate the false discovery rates (q values). Genes of q value < 0.1 were declared significant.
Microsatellite Instability
DNA samples were evaluated for Microsatellite Instability using the MSI-Mono-Dinucleotide assay, which examines four mononucleotide repeat loci (polyadenine tracts BAT25, BAT26, BAT40 and transforming growth factor receptor type II) and three dinucleotide repeat loci (CA repeats in D2S123, D5S346 and D17S250).
Somatic Copy Number Alterations
DNA from each tumor or germline sample was hybridized to Affymetrix SNP 6.0 arrays using protocols from the Genome Analysis Platform of the Broad Institute as previously described (McCarroll et al., 2008). From raw. CEL files, Birdseed was used to infer a preliminary copy-number at each probe locus (Korn et al., 2008). For each tumor, genome-wide copy-number estimates were refined using tangent normalization, in which tumor signal intensities are divided by signal intensities from the linear combination of all normal samples that are most similar to the tumor. This linear combination of normal samples tends to match the noise profile of the tumor better than any set of individual normal samples, thereby reducing the contribution of noise to the final copy-number profile. Individual copy-number estimates then underwent segmentation using Circular Binary Segmentation (Olshen et al., 2004). Segmented copy-number profiles for tumor and matched control DNAs were analyzed using Ziggurat Deconstruction, an algorithm that parsimoniously assigns a length and amplitude to the set of inferred copy-number changes underlying each segmented copy number profile, and the analysis of broad copy-number alterations was then conducted as previously described (Mermel et al., 2011). Significant focal copy-number alterations were identified from segmented data using GISTIC 2.0 (Mermel et al., 2011). Allelic copy number, regions of homozygous deletions, whole genome doubling and purity and ploidy estimates were calculated using the ABSOLUTE algorithm (Carter et al., 2012).
Copy ratios of the genomic segments were adjusted by purity and ploidy using the In Silico Admixture Removal (ISAR) method (Carter et al., 2012). The tumor purity and ploidy were estimated with ABSOLUTE (Absolute quantification of somatic DNA alterations in human cancer (Carter et al., 2012). GISTIC 2.0 (Mermel et al., 2011) was used to identify significant genomic regions, and q values that were smaller than 0.1 were considered significant. The gene under selective pressure in each significant amplification/deletion peak was manually curated with consideration of the common fragile sites (CFS). The gene-level copy numbers were obtained from GISTIC, and the gene was considered as amplified or deleted if the gene-level copy number change (ploidy-adjusted) was larger than 2 or smaller than −1.3, respectively. Whole-genome doubling (WGD) calls, absolute allelic copy numbers, and clonal statuses of the SCNAs were all obtained from ABSOLUTE.
Aneuploidy Scores
The aneuploidy scores were calculated to quantify various kinds of aneuploidy in terms of length and magnitude of the copy-number events including segment gains and losses. The aneuploidy scores in this study were obtained as follows: (1) the original copy ratios of the genomic segments were adjusted by purity and ploidy using the ISAR method as noted above; (2) GISTIC 2.0 was used to deconstruct the ISAR-adjusted copy-number profile into SCNA events (discrete copy-number alterations), and each SCNA event could be categorized based on its length and magnitude (with details below); (3) for each category of SCNA events, e.g., focal amplifications, the corresponding aneuploidy score was calculated as log10(1 + n), where n is the number of events in that category. Similar approaches to the aneuploidy scores in principle were applied in a recent study (Davoli et al., 2017) as well as in our previous study (Dulak et al., 2012). The categories of SCNA events were defined as (1) Arm-level events: the relative SCNA length (as a proportion to the arm length) larm ≥ 0.5, and the absolute value of amplitude |m| > 0.3, and the threshold of 0.3 was applied to remove low copy ratio changes that were likely noise; (2) Focal events: larm < 0.5, |m| > 0.3; (3) Focal amplifications: larm < 0.5, m > 0.3; (4) Focal deletions: larm < 0.5, m < −0.3; (5) High-level focal amplifications: larm < 0.5, m > 1; (6) Deep-level focal deletions: larm < 0.5, m < −1. This method serves as a quantification of different types of genomic aneuploidy, and it is different from the gene-level amplification and deletion mentioned above, where conservative thresholds (2 and −1.3) for the gene-level copy number (not SCNA events) were applied to define functional alterations of the genes.
CIN-Focal Score
We developed a CIN-Focal (CIN-F) score to capture the most focal high-level amplicons (MFAs), which are likely to be functional gains of specific genomic regions that were subject to positive selection during cancer evolution. Based on the deconstructed copy-number events from GISTIC 2.0, we defined those MFAs as l < 3 Mb and m > 2, where l is the length of the amplicon in mega-bases, and m is the event amplitude as mentioned above. Given each of those amplicons, the CIN-F score of a tumor was first calculated as the weighted sum of the magnitude ma of each amplicon a (weighted by its length la), and then log-transformation was applied:
Because ma is the ploidy-adjusted amplitude of copy-number gain, la · ma is theoretically proportional to the relative amount of DNA (compared to the total cancer DNA) of the amplicon a, so that the CIN-F score corresponds to the amount of additional DNA within the MFAs. An alternative metric to CIN-F score is simply the total number of MFAs in a genome regardless of the lengths and amplitudes of the MFAs. The CIN-F score showed a binomial distribution in the upper GI cancers. We used kernel density estimation of Gaussian kernels (R statistical software, the “density” function) to set the threshold for dichotomization at the local minimum of estimated density of the CIN-F score, and this analysis yielded a threshold of SCIN-F = 0.438. The CIN tumors was then dichotomized into CIN-F and CIN-B as shown in Figure 4C.
Clonal Deletion Score (CDS)
To identify tumors with chromosomal instability, we developed a score, termed the Clonal Deletion Score, or CDS, which quantifies the number of clonally deleted genomic regions in each tumor’s genome. The CDS of each tumor was calculated using absolute allelic copy numbers of genomic segments of the tumor. For each genomic segment, the absolute allelic copy numbers are denoted as q1 and q2 for the two alleles with lower and higher copy number, respectively. If (1) the segment is a deletion, i.e., q1 < q2, and q1 + q2 < ), where ) is the average tumor ploidy; and (2) the deletion is clonal, i.e., q1 is a clonal copy number according to ABSOLUTE; then the clonal deletion effect (CDE) of the segment is calculated as:
If a segment does not satisfy the above criteria, the CDE of that segment is zero. The copy number of the higher allele q2 was incorporated so as to diminish the CDE when there was a gain of the higher allele, e.g., copy-neutral loss of heterozygosity (LOH). Given the CDE of each segment s, the CDS of a tumor is the average of CDE weighted by the lengths of the segments:
where ls is the length of a segment. The CDSs from the GI adenocarcinomas showed a clear bimodal separation. The kernel density estimation approach as mentioned above was used to set the threshold for dichotomization of CDS. A threshold of CDS = 0.0249 was then applied for the binary CIN/GS classification (Figure 2B and S2B), which corresponds to distinct copy-number profiles as shown in Figure S2C.
Mutational Signatures
Mutational signatures were identified from SNVs using a Bayesian version of the non-negative matrix factorization method as described previously (Kim et al., 2016). The mutations were deconvoluted into distinct mutational signatures based on the number of mutations partitioned by 6 base substitutions (C>A, C>G, C>T, T>A, T>C, and T>G) and 16 possible combinations of neighboring bases that resulted in 96 possible types of mutations. A 96-by-M matrix of mutation counts (M is the number of samples) was constructed as the input data for signature discovery. Cosine similarity was used to evaluate the resemblance of the identified signatures with the COSMIC signatures (http://cancer.sanger.ac.uk/cosmic/signatures). For each sample, the estimated number of mutations from a signature was used as the intensity of that signature. A two-stage strategy of mutational signature discovery was performed in this study to achieve more accuracy in the identification of signatures. In the first stage, all samples were used to identify the signatures. In the second stage, the analysis was performed only for the non-hypermutated cases with the MSI and POLE signatures removed from the mutation counts to facilitate identification of signatures in the non-HM population.
Stemness Index
We used one-class logistic regression (Sokolov et al., 2016) to derive a stemness index based on a gene expression signature derived from embryonic and differentiated cells from the PCBC dataset (Daily et al., 2017; Salomonis et al., 2016) and applied this to GIAC samples using Spearman correlations between the model’s weight vector and the GIAC sample’s expression profile (Malta et al., 2018).
Differential Gene Expression Analysis between GIAC and non-GI AC
To identify genes differentially abundant in GIAC versus non-GI AC, excluding genes that are differentially expressed between normal GI tissue compared to normal non-GI tissue, we needed to use external gene expression data normal tissues. We selected 4 gastrointestinal (esophagus, stomach, colon-transverse, and colon-sigmoid) and 5 non-gastrointestinal (breast, lung, ovary, prostate, and uterine) normal tissue types through GTEx repository of normal tissues (Consortium et al., 2017) (https://www.gtexportal.org/home/datasets, GTEx Version 7), and utilized their RNA-sequencing expression dataset. Normalized expression values for both TCGA tumor and GTEx normal tissue cases were calculated by robust scaling (on values between 2.5 and 97.5 percentile) and winsorizing of each gene’s expression (mean ± 3 standard deviations) in the respective case population of tumoral or normal cases. Gastrointestinal and non-gastrointestinal normal tissues were selected based on the matching with composition of available GI and non-GI adenocarcinomas in TCGA PanCancer project. Orthogonal partial least squares-discriminant analysis (OPLS-DA) was used to discover a subgroup of genes (n=671) that were not differentially expressed in GI and non-GI normal tissues, but were members of our list of differentially expressed genes between GI adenocarcinomas (GIAC) and non-GI adenocarcinomas (Non-GI AC). Significance was determined by absolute loading in the OPLS discriminant analysis of higher than 0.05. The genes for which expression was highly associated with the stromal class of GI tumors identified by the method described in Isella et al (Isella et al., 2015) (n=118) were excluded from further analysis (absolute loading higher than 0.05). By utilizing an OPLS-DA model comparing GIAC and non-GI AC cases, the remaining 553 genes were ranked by their loadings toward overexpression in GIAC. Results were depicted in two heatmaps illustrating the normalized expression values for the selected genes in both GIAC and non-GI AC tissues (first heatmap), and normal GI and non-GI tissues (second heatmap).
Selection of transcription factors for gain- and loss-of-function studies
We used multiple sources to select 139 transcription factors (TFs) that are important in GI development. We first identified 40 TFs in the Gene Ontology (GO) database based on the intersection of two GO terms, RNA polymerase II transcription factor activity, sequence-specific DNA binding (GO: 0000981) and digestive tract development (GO: 0048565), in Homo sapiens. Further, we collected 24 TFs from the review by Noah et al. on human intestinal development and differentiation (Noah et al., 2011). Additionally, 93 genes were identified in the study in which Sherwood and colleagues used microarray and dynamic immunofluorescence technologies to profile gene expression during mouse endodermal organ formation (Sherwood et al., 2009). Finally, we also included nine other TFs that were significantly mutated in GIAC. In all, we examined 139 genes (taking the union of the four gene lists and removing genes with missing platform data).
DNA methylation data
Illumina Infinium DNA methylation arrays [including both HumanMethylation27 (HM27) and HumanMethylation450 (HM450)] were used to assay 921 GIAC and 76 adjacent non-malignant tissues. Level 3 data from two generations of Illumina infinium DNA methylation arrays were combined and further normalized between platforms using a probe-by-probe proportional rescaling method as outlined below to yield a final common set of 22,601 probes with comparative methylation levels between platforms. During data generation, a single technical replicate of the same cell line control sample from either of two different DNA extractions (TCGA-07-0227/TCGA-AV-A03D) was included on each plate as a control, and measured 44/198 times and 12/169 times on HM27 and HM450, respectively. These repeated measurements were therefore used for rescaling of the HM27 data to be comparable to HM450. For each probe within each platform, we computed the median β value across all technical replicates of each of the two TCGA IDs. We then combined the two extractions by taking the mean of the two medians obtained for each of the two replicate TCGA IDs, and obtained a single summarized DNA methylation read-out (β value) for the corresponding probe i for each platform, noted as and respectively. We then applied a constrained (within the range of 0 to 1 for β values) linear rescaling of the HM27 data for each probe and for each patient’s sample using and . When the HM27 β value of a patient’s sample j for probe i was smaller than the mean of median replicate samples on the HM27 for that probe, we linearly rescaled the HM27 β value Betahm27,i,j in the (0, Betahm27,i,j ) space; and when Betahm27,i,j was greater, we linearly rescaled the HM27 beta value Betahm27,i,j in the (Betahm27,i,j,1) space; This translates into the following mathematical computation: , if ; and , if .
After the between-platform normalization, we further excluded 779 probes that still showed a consistent platform difference (mean β value difference greater than or equal to 0.1) in six or more tumor types.
Unsupervised clustering analysis of DNA methylation data
Unsupervised clustering analyses of DNA methylation data were performed based on promoter CpG sites that did not exhibit tissue-specific DNA methylation in normal tissues and blood cells (mean β value < 0.2 for each tissue type), but acquired methylated in tumors.
GIAC and non-GI AC (Figure S1A)
We analyzed DNA methylation profiles of 3,759 adenocarcinomas including 921 GI adenocarcinomas and 2,828 non-GI adenocarcinomas representing 12 disease types (four GIAC and eight non-GI AC). We also included data from 333 histologically normal tumor-adjacent tissue specimens corresponding each disease type (BRCA n=101, PRAD n=39, OV n=12, CEAD n=1, UCEC n=43, EAC/GAC n=33, COAD n=37, READ n=6, CHOL n=9, PAAD n=10, LUAD n=42). We first used the data from the normal tissues and leukocytes to select CpG sites that lacked tissue-specific DNA methylation (mean β value < 0.2 in any tissue type and β value >0.3 in no more than five samples across the entire set). We then performed clustering analysis of the adenocarcinomas using 2,783 CpG sites that were hypermethylated (β value ≥0.3) in more than 10% within any of the 12 disease types. To minimize the influence of tumor purity on a clustering result, we dichotomized the data using a β value of ≥0.3 to define positive DNA methylation and < 0.3 to specify lack of methylation. We applied hierarchical clustering with Ward’s method to cluster the distance matrix computed with the Jaccard index. Heatmap was generated based on the original β values for 1,000 loci (a subset of 2,783 loci) with the highest standard deviation in DNA methylation measurements among all adenocarcinomas.
GIAC (Figure 2D)
We analyzed DNA methylation profiles of 921 GIAC and 77 (33 gastric and 44 colorectal) histologically normal tumor-adjacent tissue specimens. The precise locations within the GI organs from which the normal-adjacent tissue specimens were excised are not available. Unsupervised clustering of GIAC was performed based on 2,845 gene promoter loci unmethylated in normal tissues and leukocytes (mean β value < 0.2 in both normal gastric and colorectal tissues) but methylated (β value > 0.3) more than 5% in at least one of the GIAC tumor types. To minimize the influence of tumor purity, we dichotomized the data into 0’s and 1’s using a β value threshold of 0.3. The optimal number of clusters was assessed based on 80% probe and tumor resampling over 1,000 iterations of hierarchical clustering for K = 2, 3, 4…20 using the binary distance metric for clustering and Ward’s method for linkage as implemented in the R/Bioconductor ConsensusClusterPlus package. The heatmap was generated using the original β values. The probes were displayed based on the order of unsupervised hierarchal clustering of the β values using the Euclidean distance metric and Ward’s linkage method.
The union of MSI and CIMP-H GIAC (Figure 3B)
We used 158 tumors (93 GEA and 65 CRC) that were classified as either CIMP-H or MSI and 44 normals (12 stomach and 32 colorectal), which were assayed on the HM450 platform. Unsupervised and dichotomized clustering was performed using 35,436 sites lacking DNA methylation in normal tissues (mean β value < 0.2 in both normal gastric and colorectal tissues) and methylated (β value > 0.3) more than 10% in any of the tumor type. Heatmap was generated based on the top 10% of the most variably hypermethylated sites across 158 GIAC.
GIAC DNA hypermethylation subtypes
We chose seven GIAC DNA methylation clusters defined by the consensus clustering. For further integrative analyses, we focused on four prominent clusters showing a high frequency of cancer-associated DNA hypermethylation. We found that the gastroesophageal (GEA) and colorectal adenocarcinomas (CRC) largely clustered separately. Among GEA, EBV+ gastric cancers stood out from all the rest by their extensive DNA hypermethylation (cluster 4) and were designated as EBV-CIMP as previous study (Cancer Genome Atlas Research Network, 2014). Cluster 5 is significantly enriched for MSI tumors originated in both stomach and colon. It included well-known CIMP-High CRC associated with BRAFV600E mutations and MSI-associated Gastric-CIMP described previously (Cancer Genome Atlas Research Network, 2014; Weisenberger et al., 2006). We classified these tumors as GIAC CIMP-H, as having a higher prevalence of DNA hypermethylation than all the other clusters with the exception of EBV-CIMP. Further, we named cluster 6 as CRC CIMP-L that exhibited features consistent with CIMP-Low subtype previously described (Cancer Genome Atlas Research Network, 2012). It had a significant association with KRAS mutations (p < 2.2 ×10⁻¹⁶ [vs. CRC in other groups], Fisher’s exact test). Among GEA, cluster 1 was enriched for esophageal tumors (p = 8.0 × 10⁻⁸ [vs. GEAs in other groups]), and also had a mean DNA hypermethylation frequency slightly higher than that in CRC CIMP-L and other GEA clusters (cluster 2 and 3). We specified these tumors as GEA-CIMP-L. These tumors showed frequent epigenetic silencing of tumor suppressor genes including CDKN2A and MGMT (p = 1.5 × 10⁻¹⁰ and p = 1.5 × 10⁻¹¹, respectively, [vs. GEA clusters 2 and 3]).
Identification of epigenetically silenced genes
We used 775 GIAC and 44 adjacent non-malignant tissues assayed on the HM450 platform. Probes located within potential promoter regions (1500 bp flanking regions upstream and downstream of Transcription Start Sites (TSSs) of all transcripts annotated by UCSC) were examined for evidence of epigenetic silencing. We removed the CpG sites that were methylated in normal tissues and blood cells (mean β value > 0.2 for each tissue type). In order to remove the effect of tissue specificity on gene expression, we z-score-transformed log 2 gene expression data first within each cancer type. The z-scores were derived using the mean and standard deviation calculated with the unmethylated tumors only, defined as those with a β value of (0, 0.2). Samples across all the cancer types were then pooled. For each probe/gene pair, we chose the probes that exhibited epigenetic silencing with the following criteria: 1) at least 8 samples (>1% of all tumors) were observed with a β value of 0.3 or above (defined as the methylated group); 2) mean z-score of the methylated group was lower than −1.65; 3) FDR-corrected p value according to one-side t-test on z-scores was lower than 0.001 between the unmethylated and methylated groups. Probes surviving these steps were retained to call epigenetic silencing events based on DNA methylation profiles for each sample. If there were multiple probes associated with the same gene, a sample identified as epigenetically silenced at more than half the probes for the corresponding gene was also labeled as epigenetically silenced at the gene level.
CDKN2A epigenetic silencing calls were made using the exon-level RNA-seq data. CDKN2A DNA methylation status was assessed in each sample, based on the probe (cg13601799) located in the p16INK4 promoter CpG island. p16INK4 expression was determined by the log2(RPKM+1) level of its first exon (chr9: 21974403–21975132). The epigenetic silencing calls for each sample were made by evaluating a scatter plot showing an inverse association between DNA methylation and expression. For RAD51C, there was no common probe between HM27 and HM450 that was located in the promoter region. However, probe cg14837411 from HM27 and probe cg27221688 from HM450 were only 100bp apart, and both correlated with gene expression. Therefore, we combined them in determining the silencing status of this gene. Samples with a β value of 0.2 or above for either probe were designated as cases with epigenetic silencing.
DNA hypermethylation frequency in GIAC and Non-GI AC
We identified a set of 13,809 CpG sites that were unmethylated in normal tissues and blood cells (mean β value < 0.2 for each tissue type). For each CpG locus, tumors with a β value of 0.3 or greater were designated as methylated, and tumors with a β value of lower than 0.3 were designated as unmethylated. We then calculated the percentage of loci that were methylated among the loci investigated in each tumor.
Methods for integrative pathway analysis
We evaluated somatic mutations and copy-number changes relevant to well-studied signaling pathways curated in previous TCGA publications. Oncogenic relevance was assessed using OncoKB, a knowledge base for the oncogenic effects of cancer genes, that is manually curated by researchers and physicians at Memorial Sloan Kettering (Chakravarty et al., 2017). Specifically, a mutation was counted and included in the diagrams if either (1) it had been reported as a recurrent alteration in COSMIC (Forbes et al., 2011) or (2) it had been labeled as oncogenic or likely oncogenic in OncoKB. Amplifications and deep deletions were based on GISTIC calls and reflect a change of more than half of the baseline gene copies. The actual list of oncogenic and likely oncogenic alterations is regularly updated based on the literature; the most recent version can be retrieved online from the OncoKB public website (www.oncokb.org) or visualized when viewing the data in the cBioPortal (www.cbioportal.org). For known oncogenes, only genetic alterations inferred to be activating were considered; for tumor suppressor genes, only alterations inferred to be inactivating were considered.
QUANTIFICATION AND STATISTICAL ANALYSIS
We used Fisher’s exact test for independence between two categorical variables throughout the analyses. Wilcoxon rank-sum test was performed for any independence test between a continuous variable and a binary categorical variable. For any test between two continuous variables or any association test that needed to be adjusted by covariates, a (multiple) linear model was fitted to evaluate the significance of coefficients, and analysis of variance was used to calculate the proportion of variance explained by each variable. Non-negative variables that were heavily right-skewed, which included the aneuploidy scores, CIN-F score, number of MFAs, and the intensities of mutational signatures, were log-transformed (with a pseudo-count of 1 added) for appropriate fitting of multiple linear models. For the association test between aneuploidy scores and BRCA signature, the arm-level score and focal score were simultenously included as explanatory variables in the multiple linear model. The association test between BRCA signature and PARP1 expression (log-transformed) was adjusted by the copy number of PARP1. The intensity of the CpG>TpG signature was modeled by multiple linear regression with explanatory variables of upper/lower GI, molecular subtype, age, and CIMP status as an ordinal variable. A logistic regression model was fitted when the response variable was binary. The test between the CIN-F score and clinical stage was performed using an ordered logit model as the clinical stage was considered an ordinal variable, and the p values were calculated using normal approximation. The association test between number of MFAs and the CRC stromal subtype was performed using negative-binomial regression that models the sparse number of MFAs, so as to increase statistical power. Cox regression was used for survival analysis to evaluate the significance of the variables. All statistical analyses in this study were performed using the R statistical software (https://www.r-project.org).
DATA AND SOFTWARE AVAILABILITY
The raw data, processed data and clinical data can be found at the legacy archive of the GDC (https://portal.gdc.cancer.gov/legacy-archive/search/f) and the PancanAtlas publication page (https://gdc.cancer.gov/about-data/publications/pancanatlas). The mutation data can be found here: (https://gdc.cancer.gov/about-data/publications/mc3-2017). TCGA data can also be explored through the Broad Institute FireBrowse portal (http://gdac.broadinstitute.org) and the Memorial Sloan Kettering Cancer Center cBioPortal (http://www.cbioportal.org). Details for software availability are in the Key Resource Table.
KEY RESOURCES TABLE.
| REAGENT or RESOURCE | SOURCE | IDENTIFIER |
|---|---|---|
| Antibodies | ||
| RPPA antibodies | RPPA Core Facility, MD Anderson Cancer Center | https://www.mdanderson.org/research/research-resources/core-facilities/functional-proteomics-rppa-core.html |
| Biological Samples | ||
| Tumor and normal tissue and blood samples | TCGA Network | https://portal.gdc.cancer.gov/legacy-archive/ |
| Critical Commercial Assays | ||
| DNA/RNA AllPrep kit | Qiagen | Cat# 80204 |
| mirVana miRNA Isolation kit | Ambion | Cat# AM1560 |
| QiaAmp blood midi kit | Qiagen | Cat# 51185 |
| AmpFISTR Identifiler kit | Applied Biosystems | Cat# A30737 |
| RNA6000 nano Assay | Agilent | Cat# 5067-1511 |
| SureSelect Human All Exon 50 Mb | Agilent | Cat# G3370J |
| Genome-Wide Human SNP Array 6.0 | Affymetrix | Cat# 901150 |
| Illumina Barcoded Paired-End Library Preparation kit | Illumina | http://www.hgsc.bcm.edu/sites/-default/files/documents/-Illumina_Barcoded_Paired-End_Capture_Library_Preparation.pdf |
| TruSeq PE Cluster Generation kit | Illumina | PE-401-3001 |
| Phusion PCR Supermix HiFi (2X) | New England Biolabs | Cat# M0531L |
| HumanMethylation450 | Infinium | Cat# WG-314-1002 |
| HumanMethylation450 | Infinium | Cat# WG-311-2201 |
| mRNA TruSeq kit | Illumina | Cat# RS-122-2001 |
| Deposited Data | ||
| Raw genomic and clinical data | NCI Genomic Data Commons | https://portal.gdc.cancer.gov/legacy-archive/ |
| MC3 mutation annotation file | NCI Genomic Data Commons | https://gdc.cancer.gov/about-data/publications/mc3-2017 |
| Processed data files | NCI Genomic Data Commons | https://gdc.cancer.gov/about-data/publications/pancanatlas |
| Software and Algorithms | ||
| Broad Institute QC on BAM files - ContEst | (Cibulskis et al., 2011) | PMID: 21803805 |
| Broad Institute Mutation Calling - MuTect | (Cibulskis et al., 2013) | PMID: 23396013 |
| Broad Institute small indel Calling - Indelocator | https://www.broadinstitute.org/cancer/cga/indelocator | |
| Broad Institute Mutation/Indel Annotation - Oncotator | (Ramos et al., 2015) | PMID: 25703262 |
| Mutation Significance Analysis - MutSigCV | (Lawrence et al., 2014) | PMID: 24390350 |
| RNA,DNaseq classifier - BioBloomTools(v1.2.4.b) | (Chu et al., 2014) | PMID: 25143290 |
| Broad Institute - PathSeq | (Kostic et al., 2011) | PMID: 21552235 |
| RNA read assembly – MapSplice 0.7.4 | (Wang et al., 2010) | PMID: 20802226 |
| Gene expression quantification - RSEM | (Li and Dewey, 2011) | PMID: 21816040 |
| Copy number estimation | NA | http://archive.broadinstitute.org/cancer/cga/copynumber_pipeline |
| Significant focal copy number change – GISTIC 2.0 | (Mermel et al., 2011) | http://software.broadinstitute.org/software/cprg/?q=node/31 |
| Purity, ploidy, genome doubling - ABSOLUTE | (Carter et al., 2012) | http://archive.broadinstitute.org/cancer/cga/absolute |
| Cluster analysis - ConsensusClusterPlus | (Wilkerson and Hayes, 2010) | http://bioconductor.org/packages/release/bioc/html/ConsensusClusterPlus.html |
| Mbatch (EB++) | NA | http://bioinformatics.mdanderson.org/main/TCGABatchEffects:Overview |
Supplementary Material
Table S1. Related to Figure 1. Summary table of tumor sample characteristics.
Table S2. Related to Figure 1. Selected features for unsupervised clustering and non-GI AC case IDs.
Table S3. Related to Figure 1. Significantly mutated genes.
Table S4. Related to Figure 1. GISTIC regions and values.
Table S5. Related to Figure 1. Genes differentially expressed in GIAC compared to non-GIAC
Table S6. Related to Figure 1. GIAC developmental transcription factors
Table S7. Related to Figure 3. Epigenetic silencing calls
SIGNIFICANCE.
Adenocarcinomas of the gastrointestinal tract share not only a poor prognosis but also conserved molecular features. Hypermutated tumors display diverse immune features depending on tissue origin and molecular subtype, with implications for targeted immunotherapeutics. Upper GI tumors with chromosomal instability display a fine genome fragmentation enriched for high amplitude, focal somatic copy number alterations associated with whole genome doubling, specific mutational signatures, and advanced stage. We identified a genome stable molecular subtype among colorectal cancers with an elevated frequency of recurrent mutations in SOX9 and PCBP1.
HIGHLIGHTS.
GI adenocarcinomas comprised five molecular subtypes: EBV, MSI, HM-SNV, CIN, and GS
Hypermutated tumors had diverse immune features varying by tissue and subtype
CIN tumors displayed more fragmented copy number alterations in the upper GI tract
Genome-stable CRC subtype was enriched for recurrent mutations in SOX9 and PCBP1
Acknowledgments
We thank all patients who contributed to this study. This work was supported by the Intramural Research Program and the following grants from the United States National Institutes of Health: U24 CA143799, U24 CA143835, U24 CA143840, U24 CA143843, U24 CA143845, U24 CA143848, U24 CA143858, U24 CA143866, U24 CA143867, U24 CA143882, U24 CA143883, U24 CA144025, U54 HG003067, U54 HG003079, U54 HG003273 and P30 CA16672.
CONSORTIUM AUTHOR LIST
The members of The Cancer Genome Atlas Research Network for this project are:
NCI/NHGRI Project Team
Samantha J. Caesar-Johnson, John A. Demchok, Ina Felau, Martin L. Ferguson, Carolyn M. Hutter, Melpomeni Kasapi, Heidi J. Sofia, Roy Tarnuzzer, Zhining Wang, Liming Yang, Jean C. Zenklusen, Jiashan (Julia) Zhang
TCGA DCC
Sudha Chudamani, Jia Liu, Laxmi Lolla, Rashi Naresh, Todd Pihl, Qiang Sun, Yunhu Wan, Ye Wu
Genome Data Analysis Centers (GDACs)
The Broad Institute
Juok Cho, Timothy DeFreitas, Scott Frazer, Nils Gehlenborg, Gad Getz, David I. Heiman, Jaegil Kim, Michael S. Lawrence, Pei Lin, Sam Meier, Michael S. Noble, Gordon Saksena, Doug Voet, Hailei Zhang
Institute for Systems Biology
Brady Bernard, Nyasha Chambwe, Varsha Dhankani, Theo Knijnenburg, Roger Kramer, Kalle Leinonen, Yuexin Liu, Michael Miller, Sheila Reynolds, Ilya Shmulevich, Vesteinn Thorsson, Wei Zhang
MD Anderson Cancer Center
Rehan Akbani, Bradley M. Broom, Apurva M. Hegde, Zhenlin Ju, Rupa S. Kanchi, Anil Korkut, Jun Li, Han Liang, Shiyun Ling, Wenbin Liu, Yiling Lu, Gordon B. Mills, Kwok-Shing Ng, Arvind Rao, Michael Ryan, Jing Wang, John N. Weinstein, Jiexin Zhang
Memorial Sloan Kettering Cancer Center
Adam Abeshouse, Joshua Armenia, Debyani Chakravarty, Walid K. Chatila, Ino de Bruijn, Jianjiong Gao, Benjamin E. Gross, Zachary J. Heins, Ritika Kundra, Konnor La, Marc Ladanyi, Augustin Luna, Moriah G. Nissan, Angelica Ochoa, Sarah M. Phillips, Ed Reznik, Francisco Sanchez-Vega, Chris Sander, Nikolaus Schultz, Robert Sheridan, S. Onur Sumer, Yichao Sun, Barry S. Taylor, Jioajiao Wang, Hongxin Zhang
Oregon Health and Science University
Pavana Anur, Myron Peto, Paul Spellman
University of California Santa Cruz
Christopher Benz, Joshua M. Stuart, Christopher K. Wong, Christina Yau
University of North Carolina at Chapel Hill
D. Neil Hayes, Joel S. Parker, Matthew D. Wilkerson
Genome Characterization Centers (GCC)
BC Cancer Agency
Adrian Ally, Miruna Balasundaram, Reanne Bowlby, Denise Brooks, Rebecca Carlsen, Eric Chuah, Noreen Dhalla, Robert Holt, Steven J.M. Jones, Katayoon Kasaian, Darlene Lee, Yussanne Ma, Marco A. Marra, Michael Mayo, Richard A. Moore, Andrew J. Mungall, Karen Mungall, A. Gordon Robertson, Sara Sadeghi, Jacqueline E. Schein, Payal Sipahimalani, Angela Tam, Nina Thiessen, Kane Tse, Tina Wong
The Broad Institute
Ashton C. Berger, Rameen Beroukhim, Andrew D. Cherniack, Carrie Cibulskis, Stacey B. Gabriel, Galen F. Gao, Gavin Ha, Matthew Meyerson, Gordon Saksena, Steven E. Schumacher, Juliann Shih
Harvard
Melanie H. Kucherlapati, Raju S. Kucherlapati
Johns Hopkins
Stephen Baylin, Leslie Cope, Ludmila Danilova
University of Southern California
Moiz S. Bootwalla, Phillip H. Lai, Dennis T. Maglinte, David J. Van Den Berg, Daniel J. Weisenberger
University of North Carolina at Chapel Hill
J. Todd Auman, Saianand Balu, Tom Bodenheimer, Cheng Fan, D. Neil Hayes, Katherine A. Hoadley, Alan P. Hoyle, Stuart R. Jefferys, Corbin D. Jones, Shaowu Meng, Piotr A. Mieczkowski, Lisle E. Mose, Joel S. Parker, Amy H. Perou, Charles M. Perou, Jeffrey Roach, Yan Shi, Janae V. Simons, Tara Skelly, Matthew G. Soloway, Donghui Tan, Umadevi Veluvolu, Matthew D. Wilkerson
Van Andel Research Institute
Toshinori Hinoue, Peter W. Laird, Hui Shen
Genome Sequencing Centers (GSC)
Baylor College of Medicine
Michelle Bellair, Kyle Chang, Kyle Covington, Chad J. Creighton, Huyen Dinh, HarshaVardhan Doddapaneni, Lawrence A. Donehower, Jennifer Drummond, Richard A. Gibbs, Robert Glenn, Walker Hale, Yi Han, Jianhong Hu, Viktoriya Korchina, Sandra Lee, Lora Lewis, Wei Li, Xiuping Liu, Margaret Morgan, Donna Morton, Donna Muzny, Jireh Santibanez, Margi Sheth, Eve Shinbrot, Linghua Wang, Min Wang, David A. Wheeler, Liu Xi, Fengmei Zhao
The Broad Institute
Carrie Cibulskis, Stacy B. Gabriel, Julian Hess
Washington University at St. Louis
Elizabeth L. Appelbaum, Matthew Bailey, Matthew G. Cordes, Li Ding, Catrina C. Fronick, Lucinda A. Fulton, Robert S. Fulton, Cyriac Kandoth, Elaine R. Mardis, Michael D. McLellan, Christopher A. Miller, Heather K. Schmidt, Richard K. Wilson
Biospecimen Core Resource
The International Genomics Consortium
Daniel Crain, Erin Curley, Johanna Gardner, Kevin Lau, David Mallery, Scott Morris, Joseph Paulauskis, Robert Penny, Candace Shelton, Troy Shelton, Mark Sherman, Eric Thompson, Peggy Yena
Nationwide Children’s Organization
Jay Bowen, Julie M. Gastier-Foster, Mark Gerken, Kristen M. Leraas, Tara M. Lichtenberg, Nilsa C. Ramirez, Lisa Wise, Erik Zmuda
Tissue Source Sites
Australian Prostate Cancer Research Center
Niall Corcoran, Tony Costello, Christopher Hovens
Barretos Cancer Hospital
Andre L. Carvalho, Ana C. de Carvalho, José H. Fregnani, Adhemar Longatto-Filho, Rui M. Reis, Cristovam Scapulatempo-Neto, Henrique C. S. Silveira, Daniel O. Vidal
Barrow Neurological Institute
Andrew Burnette, Jennifer Eschbacher, Beth Hermes, Ardene Noss, Rosy Singh
Baylor College of Medicine
Matthew L. Anderson, Patricia D. Castro, Michael Ittmann
BC Cancer Agency
David Huntsman
BioreclamationIVT
Bernard Kohl, Xuan Le, Richard Thorp
Boston Medical Center
Chris Andry, Elizabeth R. Duffy
Botkin Hospital
Vladimir Lyadov, Oxana Paklina, Galiya Setdikova, Alexey Shabunin, Mikhail Tavobilov
Brain Tumor Center at the University of Cincinnati Gardner Neuroscience Institute
Christopher McPherson, Ronald Warnick
Brigham and Women’s Hospital
Ross Berkowitz, Daniel Cramer, Colleen Feltmate, Neil Horowitz, Adam Kibel, Michael Muto, Chandrajit P. Raut
Capital Biosciences, Inc
Andrei Malykh
Case Comprehensive Cancer Center
Jill S. Barnholtz-Sloan, Wendi Barrett, Karen Devine, Jordonna Fulop, Quinn T. Ostrom, Kristen Shimmel, Yingli Wolinsky
Case Western Reserve School of Medicine
Andrew E. Sloan
Catholic University of the Sacred Heart
Agostino De Rose, Felice Giuliante
Cedars-Sinai Medical Center
Marc Goodman, Beth Y. Karlan
Central Arkansas Veterans Healthcare System
Curt H. Hagedorn
Centura Health
John Eckman, Jodi Harr, Jerome Myers, Kelinda Tucker, Leigh Anne Zach
Chan Soon-Shiong Institute of Molecular Medicine at Windber
Brenda Deyarmin, Hai Hu, Leonid Kvecher, Caroline Larson, Richard J. Mural, Stella Somiari
Charles University
Ales Vicha, Tomas Zelinka
Christiana Care Health System
Joseph Bennett, Mary Iacocca, Brenda Rabeno, Patricia Swanson
CHU of Montreal
Mathieu Latour
CHU of Quebec
Louis Lacombe, Bernard Têtu
CHU of Quebec, Laval University Research Center of Chus
Alain Bergeron
Cleveland Clinic Foundation
Mary McGraw, Susan M. Staugaitis
Columbia University
John Chabot, Hanina Hibshoosh, Antonia Sepulveda, Tao Su, Timothy Wang
Cureline, Inc
Olga Potapova, Olga Voronina
Curie Institute
Laurence Desjardins, Odette Mariani, Sergio Roman-Roman, Xavier Sastre, Marc-Henri Stern
Dana-Farber Cancer Institute
Feixiong Cheng, Sabina Signoretti
Dignity Health Mercy Gilbert Medical Center
Jennifer Eschbacher
Duke University Medical Center
Andrew Berchuck, Darell Bigner, Eric Lipp, Jeffrey Marks, Shannon McCall, Roger McLendon, Angeles Secord, Alexis Sharp
Emory University
Madhusmita Behera, Daniel J. Brat, Amy Chen, Keith Delman, Seth Force, Fadlo Khuri, Kelly Magliocca, Shishir Maithel, Jeffrey J. Olson, Taofeek Owonikoko, Alan Pickens, Suresh Ramalingam, Dong M. Shin, Gabriel Sica, Erwin G. Van Meir, Hongzheng Zhang
Erasmus Medical Center
Wil Eijckenboom, Ad Gillis, Esther Korpershoek, Leendert Looijenga, Wolter Oosterhuis, Hans Stoop, Kim E. van Kessel, Ellen C. Zwarthoff
Foundation of the Carlo Besta Neurological Institute, IRCCS
Chiara Calatozzolo, Lucia Cuppini, Stefania Cuzzubbo, Francesco DiMeco, Gaetano Finocchiaro, Luca Mattei, Alessandro Perin, Bianca Pollo
Fred Hutchinson Cancer Research Center
Chu Chen, John Houck, Pawadee Lohavanichbutr
Friedrich-Alexander-University
Arndt Hartmann, Christine Stoehr, Robert Stoehr, Helge Taubert, Sven Wach, Bernd Wullich
Greater Poland Cancer Center
Witold Kycler, Dawid Murawa, Maciej Wiznerowicz
Greenville Health System Institute for Translational Oncology Research
Ki Chung, W. Jeffrey Edenfield, Julie Martin
Gustave Roussy institute
Eric Baudin
Harvard University
Glenn Bubley, Raphael Bueno, Assunta De Rienzo, William G. Richards
Henry Ford Health System
Ana deCarvalho, Steven Kalkanis, Tom Mikkelsen, Tom Mikkelsen, Houtan Noushmehr, Lisa Scarpace
Hospices Civils de Lyon
Nicolas Girard
Hospital Clinic
Marta Aymerich, Elias Campo, Eva Giné, Armando López Guillermo
Hue Central Hospital
Nguyen Van Bang, Phan Thi Hanh, Bui Duc Phu
Human Tissue Resource Network
Yufang Tang
Huntsman Cancer Institute
Howard Colman, Kimberley Evason
Icahn School of Medicine at Mount Sinai
Peter R. Dottino, John A. Martignetti
Imperial College London
Hani Gabra
Indivumed GmbH
Hartmut Juhl
Institute of Human Virology Nigeria
Teniola Akeredolu
Institute of Urgent Medicine
Serghei Stepa
The International Genomics Consortium
Daniel Crain, Erin Curley, Johanna Gardner, David Mallery, Scott Morris, Joseph Paulauskis, Robert Penny, Candace Shelton, Troy Shelton, Eric Thompson
John Wayne Cancer Institute
Dave Hoon
Keimyung University
Keunsoo Ahn, Koo Jeong Kang
Ludwich Maximilians University Munich
Felix Beuschlein
Maine Medical Center
Anne Breggia
Massachusetts General Hospital
Michael Birrer
Mayo Clinic
Debra Bell, Mitesh Borad, Alan H. Bryce, Erik Castle, Vishal Chandan, John Cheville, John A. Copland, Michael Farnell, Thomas Flotte, Nasra Giama, Thai Ho, Michael Kendrick, Jean-Pierre Kocher, Karla Kopp, Catherine Moser, David Nagorney, Daniel O’Brien, Brian Patrick O’Neill, Tushar Patel, Gloria Petersen, Florencia Que, Michael Rivera, Lewis Roberts, Robert Smallridge, Thomas Smyrk, Melissa Stanton, R. Houston Thompson, Michael Torbenson, Ju Dong Yang, Lizhi Zhang
McGill University Health Center
Fadi Brimo
MD Anderson Cancer Center
Jaffer A. Ajani, Ana Maria Angulo Gonzalez, Carmen Behrens, Jolanta Bondaruk, Russell Broaddus, Bradley Broom, Bogdan Czerniak, Bita Esmaeli, Junya Fujimoto, Jeffrey Gershenwald, Charles Guo, Alexander J. Lazar, Christopher Logothetis, Funda Meric-Bernstam, Funda Meric-Bernstam, Cesar Moran, Lois Ramondetta, David Rice, Anil Sood, Pheroze Tamboli, Timothy Thompson, Patricia Troncoso, Anne Tsao, Ignacio Wistuba
Melanoma Institute Australia
Candace Carter, Lauren Haydu, Peter Hersey, Valerie Jakrot, Hojabr Kakavand, Richard Kefford, Kenneth Lee, Georgina Long, Graham Mann, Michael Quinn, Robyn Saw, Richard Scolyer, Kerwin Shannon, Andrew Spillane, Jonathan Stretch, Maria Synott, John Thompson, James Wilmott
Memorial Sloan Kettering Cancer Center
Hikmat Al-Ahmadie, Timothy A. Chan, Ronald Ghossein, Anuradha Gopalan, Victor Reuter, Samuel Singer, Bhuvanesh Singh
Ministry of Health of Vietnam
Nguyen Viet Tien
Molecular Response
Thomas Broudy, Cyrus Mirsaidi, Praveen Nair
Nancy N. and J.C. Lewis Cancer & Research Pavilion at St. Joseph’s/Candler
Paul Drwiega, Judy Miller, Jennifer Smith, Howard Zaren
National Cancer Center Korea
Joong-Won Park
National Cancer Hospital of Vietnam
Nguyen Phi Hung
National Cancer Institute
Electron Kebebew, W. Marston Linehan, Adam R. Metwalli, Karel Pacak, Peter A. Pinto, Mark Schiffman, Laura S. Schmidt, Cathy D. Vocke, Nicolas Wentzensen, Robert Worrell, Hannah Yang
National Cancer Center of Georgia
Armaz Mariamidze
Norfolk & Norwich University Hospital
Marc Moncrieff
NYU Langone Medical Center
Chandra Goparaju, Jonathan Melamed, Harvey Pass
Ohio State University
Mohamed H. Abdel-Rahman, Dina Aziz, Sue Bell, Colleen M. Cebulla, Amy Davis, Rebecca Duell, J. Bradley Elder, Joe Hilty, Bahavna Kumar, James Lang, Norman L. Lehman, Randy Mandt, Phuong Nguyen, Robert Pilarski, Karan Rai, Lynn Schoenfield, Kelly Senecal, Paul Wakely
Oncology Institute
Natalia Botnariuc, Irina Caraman, Mircea Cernat, Inga Chemencedji, Adrian Clipca, Serghei Doruc, Ghenadie Gorincioi, Sergiu Mura, Maria Pirtac, Irina Stancul, Diana Tcaciuc
Ontario Tumour Bank
Monique Albert, Iakovina Alexopoulou, Angel Arnaout, John Bartlett, Jay Engel, Sebastien Gilbert, Jeremy Parfitt, Harman Sekhon
The Oregon Clinic
Paul Hansen
Oregon Health & Science University
George Thomas
Papworth Hospital NHS Foundation Trust
Doris M. Rassl, Robert C. Rintoul
Providence Health and Services
Carlo Bifulco, Raina Tamakawa, Walter Urba
QIMR Berghofer Medical Research Institute
Nicholas Hayward
Radboud Medical University Center
Henri Timmers
Regina Elena National Cancer Institute
Anna Antenucci, Francesco Facciolo, Gianluca Grazi, Mirella Marino, Roberta Merola
Reinier de Graaf Hospital
Ronald de Krijger
René Descartes University
Anne-Paule Gimenez-Roqueplo
Research Center of Chus Sherbrooke, Québec
Alain Piché
Research Institute of the McGill University Health Centre
Simone Chevalier, Ginette McKercher
The Research Institute at Nationwide Children’s Hospital
Nilsa Ramirez
Rockefeller University
Kivanc Birsoy
Rose Ella Burkhardt Brain Tumor and Neuro-Oncology Center
Gene Barnett, Cathy Brewer, Carol Farver, Theresa Naska, Nathan A. Pennell, Daniel Raymond, Cathy Schilero, Kathy Smolenski, Felicia Williams
Roswell Park Cancer Institute
Carl Morrison
Rush University
Jeffrey A. Borgia, Michael J. Liptay, Mark Pool, Christopher W. Seder
Saarland University
Kerstin Junker
Sage Bionetworks
Larsson Omberg
Saint-Petersburg City Clinical Oncology Hospital
Mikhail Dinkin, George Manikhas
Sapienza University of Rome
Domenico Alvaro, Maria Consiglia Bragazzi, Vincenzo Cardinale, Guido Carpino, Eugenio Gaudio
Spectrum Health
David Chesla, Sandra Cottingham
St. Petersburg Academic University RAS
Michael Dubina, Fedor Moiseenko
Stanford University
Renumathy Dhanasekaran
Technical University of Munich
Karl-Friedrich Becker, Klaus-Peter Janssen, Julia Slotta-Huspenina
Tufts Medical Center
Ronald Lechan, James Powers, Arthur Tischler
University of Alabama at Birmingham Medical Center
William E. Grizzle, Katherine C. Sexton
UC Cancer Institute
Alison Kastl
UCSF-Helen Diller Family Comprehensive Cancer Center
Joel Henderson, Sima Porten
University Health Network
Sylvia L. Asa
University Hospital of Giessen and Marburg
Jens Waldmann
University Hospital in Wurzburg, Germany
Martin Fassnacht
University Hospital Essen
Dirk Schadendorf
University Hospitals Case Medical Center
Marta Couce
University Medical Center Hamburg-Eppendorf
Markus Graefen, Hartwig Huland, Guido Sauter, Thorsten Schlomm, Ronald Simon, Pierre Tennstedt
University of Abuja Teaching Hospital
Oluwole Olabode
University of Arizona
Mark Nelson
University of Calgary
Oliver Bathe
University of California
Peter R. Carroll, June M. Chan, Philip Disaia, Pat Glenn, Robin K. Kelley, Charles N. Landen, Joanna Phillips, Michael Prados, Jeffry Simko, Karen Smith-McCune, Scott VandenBerg
University of Chicago Medicine
Kevin Roggin
University of Cincinnati
Ashley Fehrenbach, Ady Kendler
University of Cincinnati Cancer Institute
Suzanne Sifri, Ruth Steele
University of Colorado Cancer Center
Antonio Jimeno
University of Dundee
Francis Carey, Ian Forgie
University of Florence
Massimo Mannelli
University of Hawaii Cancer Center
Michael Carney, Brenda Hernandez
University of Heidelberg
Benito Campos, Christel Herold-Mende, Christin Jungk, Andreas Unterberg, Andreas von Deimling
University of Iowa Hospital & Clinics
Aaron Bossler, Joseph Galbraith, Laura Jacobus, Michael Knudson, Tina Knutson, Deqin Ma, Mohammed Milhem, Rita Sigmund
University of Kansas Cancer Center
Eryn M. Godwin, Sara Kendall, Cassaundra Shipman
University of Kansas Medical Center
Andrew K. Godwin, Rashna Madan, Howard G. Rosenthal
University of Maryland School of Medicine
Clement Adebamowo, Sally N. Adebamowo
University of Melbourne
Alex Boussioutas
University of Michigan
David Beer, Carol Bradford, Thomas Carey, Thomas Giordano, Andrea Haddad, Jeffrey Moyer, Lisa Peterson, Mark Prince, Laura Rozek, Gregory Wolf
University of Montreal
Anne-Marie Mes-Masson, Fred Saad
University of New Mexico
Therese Bocklage
University of Oklahoma
Lisa Landrum, Robert Mannel, Kathleen Moore, Katherine Moxley, Russel Postier, Joan Walker, Rosemary Zuna
University of Pennsylvania
Michael Feldman, Federico Valdivieso
University of Pittsburgh
Rajiv Dhir, James Luketich
University of Puerto Rico
Edna M. Mora Pinero, Mario Quintero-Aguilo
University of São Paulo
Carlos Gilberto Carlotti Junior, Jose Sebastião Dos Santos, Rafael Kemp, Ajith Sankarankuty, Daniela Tirapelli, Natália D. Aredes
University of Sheffield Western Bank
James Catto
University of Washington
Kathy Agnew, Elizabeth Swisher
University of Western Australia
Jenette Creaney, Bruce Robinson
University of Wisconsin School of Medicine and Public Health
Carl Simon Shelley
UQ Thoracic Research Centre
Rayleen Bowman, Kwun M. Fong, Ian Yang
Valley Health System
Robert Korst
Vanderbilt University Medical Center
W. Kimryn Rathmell
Walter Reed National Medical Center
J. Leigh Fantacone-Campbell, Jeffrey A. Hooke, Albert J. Kovatich, Craig D. Shriver
Washington University
John DiPersio, Bettina Drake, Ramaswamy Govindan, Sharon Heath, Timothy Ley, Brian Van Tine, Peter Westervelt
Weill Cornell Medical College
Mark A. Rubin
Yonsei University College of Medicine
Jung Il Lee
Pan-Gastrointestinal Cancer Analysis Working Group Participants
Baylor College of Medicine
Yumeng Wang, David A. Wheeler
BC Cancer Agency
Reanne Bowlby, Andrew J. Mungall
The Broad Institute
Adam J. Bass, Rameen Beroukhim, Susan Bullman, Andrew D. Cherniack, Mirazul Islam, Jaegil Kim, Yang Liu, Sam Meier, Chandra Sekhar Pedamallu, Steven E. Schumacher, Nilay S. Sethi, Juliann Shih
Case Western Reserve School of Medicine
Joseph E. Willis
Columbia University
Evan O. Pauli
Dana-Farber Cancer Institute
Adam J. Bass, Andrew D. Cherniack, Yang Liu, Nilay S. Sethi
Duke University Medical Center
Katherine S. Garman, Shannon J. McCall
George Washington University
Lopa Mishra, Sobia Zaida
Greater Poland Cancer Center
Maciej Wiznerowicz
Harvard University
Melanie H. Kucherlapati, Raju S. Kucherlapati, Hiroyuki Yoshida, Artem Sokolov
Henry Ford Health System
Tathiane M. Malta, Houtan Noushmehr
Institute for Systems Biology
William J. R. Longabaugh, Michael Miller, Ilya Shmulevich, Vésteinn Thorsson
Massachusetts General Hospital
Hiroyuki Yoshida
Mayo Clinic
Kenneth K. Wang
MD Anderson Cancer Center
Rehan Akbani, Apurva M. Hegde, Rupa S. Kanchi, Alexander J. Lazar, Shiyun Ling, Yuexin Liu, André Schultz, John N. Weinstein
Memorial Sloan Kettering Cancer Center
Francisco Sanchez-Vega
National Cancer Institute
Charles S. Rabkin
Stanford University
Christina Curtis, Andrew J. Gentles, Olivier Gevaert, Haruka Itakura, Jose A. Seoane
University of Alabama at Birmingham Medical Center
Akinyemi Ojesina
University of Calgary
Farshad Farshidfar
University of Kansas Medical Center
Andrew K. Godwin
University of Lausanne, Lausanne, Switzerland
Giovanni Cirello, Marco Mina
University of North Carolina at Chapel Hill
Margaret L. Gulley, Joel E. Tepper
University of Pennsylvania
Anil K. Rustgi
University of Southern California
Daniel J. Weisenberger
University of Texas Southwestern Medical Center
Havish S. Kantheti
Van Andel Research Institute
Toshinori Hinoue, Peter W. Laird, Hui Shen
Vanderbilt University Medical Center
Barbara G. Schneider
Institution Addresses
Australian Prostate Cancer Research Center, Epworth Hospital, VIC, Australia
Baylor College of Medicine, Department of Pathology and Immunology, One Baylor Plaza, Houston, TX 77030, USA
Baylor College of Medicine, Department of Obstetrics and Gynecology, One Baylor Plaza, Houston, Texas 77030, USA
Baylor College of Medicine, One Baylor Plaza, Houston, TX 77030, USA
Barretos Cancer Hospital, Av: Antenor Duarte Villela, 1331, Barretos, São Paulo, Brazil
Barrow Neurological Institute, St. Joseph’s Hospital and Medical Center, Phoenix, AZ 85013, USABC Cancer Agency, 675 W 10th Ave, Vancouver, BC V5Z 1L3, Canada
Beth Israel Deaconess Medical Center, Harvard University Medical School, Boston, MA 02215, USA
BioreclamationIVT, 99 Talbot Blvd Chestertown, MD 21620, USA
Boston Medical Center, Boston, MA 02118, USA
Botkin Hospital, 2-y Botkinskiy pr-d, 5, Moskva, Russia, 125284
Brain Tumor Center at the University of Cincinnati Gardner Neuroscience Institute, and Department of Neurosurgery, University of Cincinnati College of Medicine, and Mayfield Clinic, 260 Stetson Street, Suite 2200, Cincinnati, OH, 45219, USA
Brain Tumor Center at the University of Cincinnati Neuroscience Institute, and Department of Neurosurgery, University of Cincinnati College of Medicine, and Mayfield Clinic, 234 Goodman Street, Cincinnati, OH, 45219, USA
Brain Tumor and Neuro-oncology Center, Department of Neurosurgery, University Hospitals Case Medical Center, Case Western Reserve School of Medicine, 11100 Euclid Ave, Cleveland, OH, 44106, USABrigham and Women’s Hospital, 75 Francis St, Boston MA 02115, USA
Brigham and Women’s Hospital, Division of Surgical Oncology, Department of Surgery, 75 Francis Street, Boston, MA 02115, USA
Brigham and Women’s Hospital, Harvard Medical School, Department of Surgery, Boston, MA 02115, USA
Capital Biosciences, Inc., 900 Clopper Rd, Suite 120, Gaithersburg, MD 20878, USA
Case Comprehensive Cancer Center, 11100 Euclid Ave - Wearn 152, Cleveland, OH 44106-5065, USA
Catholic University of the Sacred Heart, Hepatobiliary Surgery Unit, A. Gemelli Hospital, Largo Agostino Gemelli 8, 00168 Rome, Italy
Cedars-Sinai Medical Center, 8700 Beverly Boulevard, Suite 290 West MOT, Los Angeles, CA 90048, USA
Central Arkansas Veterans Healthcare System, Little Rock, AR 72205, USA
CHU of Quebec, Laval University Research Center of Chus 2705, boul. Laurier Bureau TR72
QUÉBEC, Quebec G1V 4G2
Centura Health, 9100 E Mineral Cir, Centennial, CO 80112, USA
Chan Soon-Shiong Institute of Molecular Medicine at Windber, Windber, PA 15963, USA
Charles University, Czech Republic
CHU of Quebec, Hôtel-Dieu de Quebec-University Laval, 11 cote du palais, Quebec City, G1R 2J6
CHUM, Montreal, Qc, Canada.
Cleveland Clinic Taussig Cancer Institute, 9500 Euclid Avenue, Cleveland, OH 44195, USA
Clinic of Urology and Pediatric Urology, Saarland University, Homburg, Germany.
Columbia University, Department of Surgery, New York, NY 10032, USA
Columbia University, Department of Pathology and Cell Biology, New York, NY 10032, USA
Columbia University Medical Center, Molecular Pathology Shared Resource of Herbert Irving Comprehensive Cancer Center of Columbia University, New York, NY 10032, USA
Comprehensive Cancer Center Tissue Procurement Shared Resource, Cooperative Human Tissue Network Midwestern Division, Dept. of Pathology, Human Tissue Resource Network, The Ohio State University, 410 West 10th Ave, Doan Hall, Room E413A, Columbus, OH 43210, USA
Cureline, Inc., 290 Utah Ave, Ste 300, South San Francisco, CA 94080, USA
Dana-Farber Cancer Institute, 450 Brookline Ave, Boston, MA 02215, USA
Dardinger Neuro-Oncology Center, Department of Neurosurgery, James Comprehensive Cancer Center and The
Dignity Health Mercy Gilbert Medical Center, 3555 S Val Vista Dr, Gilbert, AZ 85297, USA
Duke University Medical Center, 177 MSRB, Box 3156, Durham, NC 27710, USA
Duke University Medical Center, Gynecologic Oncology, Box 3079, Durham, NC 27710, USA
Duke University School of Medicine, Department of Pathology, Durham, NC 27710, USA
Emory University, Departments of Neurosurgery and Hematology and Medical Oncology, School of Medicine and Winship Cancer Institute, 1365C Clifton Road. N.E., Atlanta, GA 30322, USA
Erasmus Medical Center, Wytemaweg 80, 3015 CN, Rotterdam, The Netherlands
Erasmus University Medical Center Rotterdam, Cancer Institute, Wytemaweg 80, 3015CN, Rotterdam, the Netherlands
The Foundation of the Carlo Besta Neurological Institute, IRCCS via Celoria 11, 20133, Milan, Italy
Fred Hutchinson Cancer Research Center, 1100 Fairview Ave N, Seattle, WA 98109, USA
Fred Hutchinson Cancer Research Center, Program in Epidemiology, Seattle, WA 98109, USA
Friedrich-Alexander-University Erlangen-Nuremberg, Division Molecular Urology, Department of Urology and Pediatric Urology, University Hospital Erlangen, 91054 Erlangen, Germany
Greater Poland Cancer Center, Garbary 15, 61-866 Poznań, Poland
Greenville Health System Institute for Translational Oncology Research, 900 West Faris Road, Greenville, SC 29605, USA
Harvard University, Cambridge, MA 02138, USA
Havener Eye Institute, The Ohio State University Wexner Medical Center, 915 Olentangy River Rd, Columbus, OH 43212, USA
Henry Ford Hospital, 2799 West Grand Blvd, Detroit, MI 48202, USA
Hermelin Brain Tumor Center, Henry Ford Health System, 2799 W Grand Blvd, Detroit, MI 48202, USA
Hospices Civils de Lyon, CARDIOBIOTEC, Lyon F-69677, France
Hospital Clinic, Villarroel 180, Barcelona, Spain, 08036
Hue Central Hospital, Hue, Vietnam
Human Tissue Resource Network, Dept. of Pathology, College of Medicine, 1615 Polaris Innovation Ctr, 2001 Polaris, Columbus, OH 43240, USA
Huntsman Cancer Institute, Univ. of Utah, 2000 Circle of Hope, Salt Lake City, UT 84112, USA
Icahn School of Medicine at Mount Sinai, Department of Genetics & Genomic Sciences, 1 Gustave L. Levy Place, New York, NY 10029, USA
Icahn School of Medicine at Mount Sinai, Department of Obstetrics/Gynecology and Reproductive Sciences, 1 Gustave L. Levy Place, New York, NY 10029, USA
Indivumed GmbH, 20251 Hamburg, Germany
René Descartes University, Hospital Européen Georges Pompidou, 20 rue Leblanc, 75015, Paris, France
Curie Institute, 26 rue Ulm, 75005 Paris, France
Gustave Roussy Institute of Oncology, 39 Rue Camille Desmoulins 94805, Villejuif, France
Imperial College London, Department of Surgery and Cancer, Du Cane Road London W12 0NN, UK
Institute of Human Virology Nigeria, Abuja, Nigeria
Institute of Pathology, Technical University of Munich, Trogerstr. 18, 83675 Munich, Germany
Institute of Pathology, University Hospital Erlangen, Friedrich-Alexander-University Erlangen-Nuremberg, 91054 Erlangen, Germany
Institute of Urgent Medicine, Republic of Moldova
Regina Elena National Cancer Institute Irccs - Ifo, Via Elio Chianesi 53, 00144, Rome, Italy
John Wayne Cancer Institute, 2200 Santa Monica Blvd, Santa Monica, CA 90404, USA
Keimyung University, Daegu, South Korea
Klinikum rechts der Isar, Technical University of Munich, Dept. of Surgery, Ismaninger Str. 22, 81675 Munich, Germany
Knight Comprehensive Cancer Institute, Oregon Health & Science University, Portland, OR 97239, USA
Ludwig Maximilians University Munich, Ziemssenstrasse 1, D-80336, Munich, Germany
Maine Medical Center, 22 Bramhall St., Portland, ME 04102, USA
Martini-Clinic, Prostate Cancer Center, University Medical Center Hamburg-Eppendorf, Martinistr. 52, D-20246 Hamburg, Germany
Massachusetts General Hospital, 55 Fruit Street, Boston, MA 02114, USA
Mayo Clinic, 5777 E Mayo Blvd, Phoenix, AZ 85054, USA
Mayo Clinic, 4500 San Pablo Road, Jacksonville, FL 32224, USA
Mayo Clinic, 200 First St. SW, Rochester, MN 55905, USA
Mayo Clinic Arizona, Department of Urology, 5779 E. Mayo Blvd, Phoenix AZ 85054, USA
Mayo Clinic Arizona, Department of Hematology and Medical Oncology, 5779 E. Mayo Blvd, Phoenix AZ 85054, USA
McGill University Health Center. 1001 Decarie Blvd, Montreal, QC, Canada H4A 3J1
MD Anderson Cancer Center, Department of Pathology, 1515 Holcombe Blvd. Unit 0085, Houston, TX 77030, USA
MD Anderson Cancer Center, Life Science Plaza Building, 2130 W. Holcombe Blvd, Unit 2951, Office: LSP9.4029, Houston, TX 77030, USA
M.D. Anderson Cancer Center, Orbital Oncology & Ophthalmic Plastic Surgery, Department of Plastic Surgery, 1515 Holcombe Blvd, Unit 1488 Houston, TX 77030, USA
MD Anderson Cancer Center, Departments of Pathology & Translational Molecular Pathology, 1515 Holcombe Blvd--Unit 85, Houston, TX 77030, USA
Melanoma Institute Australia, North Sydney, NSW, Australia 2060
Memorial Sloan Kettering Cancer Center, Department of Pathology, 1275 York Avenue, New York, NY 10065, USA
Memorial Sloan Kettering Cancer Center, Center for Molecular Oncology, 1275 York Avenue, New York, NY 10065, USA
Ministry of Health of Vietnam, Hanoi, Vietnam
Molecular Response, 11011 Torreyana Road, San Diego, CA 92121, USA
Nancy N. and J.C. Lewis Cancer & Research Pavilion at St. Joseph’s/Candler, 225 Candler Drive, Savannah, GA 31405, USA
National Cancer Hospital of Vietnam
National Cancer Institute, 31 Center Dr, Bethesda, MD 20892, USA
National Cancer Institute, Division of Cancer Epidemiology and Genetics, 9609 Medical Center Dr., Bethesda MD 20892, USA
National Cancer Institute, Urologic Oncology Branch, Center for Cancer Research, Building 10, Room 1-5940, Bethesda, MD 20892-1107, USA
National Cancer Center Korea, Center for Liver Cancer, 323 Ilsan-ro, Ilsan dong-gu, Goyang, Gyeonggi 10408, South Korea
Norfolk & Norwich University Hospital, Norwich, UK. NR4 7UY
NYU Langone Medical Center, Cardiothoracic Surgery, 530 First Avenue, 9V, New York, NY 10016, USA
The Ohio State University Comprehensive Cancer Center, 320 W 10th Avenue, Columbus, OH 43210, USA
The Ohio State University Wexner Medical Center, 2012 Kenny Rd, Columbus, OH 43221, USA
The Ohio State University Medical Center, Department of Neurological Surgery, 320 W 10th Ave, Columbus, OH, 43210, USA
The Ohio State University Wexner Medical Center, Department of Pathology, Doan Hall N337B and N308, 410 West 10th Ave., Columbus, OH 43210-1267, USA
Oncology Institute, Republic of Moldova
Ontario Tumor Bank - Hamilton site, St. Joseph’s Healthcare Hamilton, Hamilton, Ontario L8N 3Z5, Canada
Ontario Tumor Bank - Kingston site, Kingston General Hospital, Kingston, Ontario K7L 5H6, Canada
Ontario Tumor Bank – Ottawa site, The Ottawa Hospital, Ottawa, Ontario K1H 8L6, Canada.
Ontario Tumor Bank, London Health Sciences Centre, London, Ontario N6A 5A5, Canada
Ontario Tumor Bank, Ontario Institute for Cancer Research, Toronto, Ontario M5G 0A3, Canada
Papworth Hospital NHS Foundation Trust, Cambridge CB23 3RE, UK
QIMR Berghofer Medical Research Institute, Herston, QLD, Australia
Radboud Medical University Center, Geert Grooteplein-Zuid 10, Nijmegen, the Netherlands
Regina Elena National Cancer Institute, 00144 Rome, Italy
Reinier de Graaf Hospital, Reinier de Graafweg 5, 2625AD, Delft, the Netherlands
Research Institute of the McGill University Health Centre, McGill University, Montréal, Québec, Canada
Research Center Of Chus Sherbrooke, Québec aile 9, porte 6, 3001 12e Avenue Nord, Sherbrooke, QC J1H 5N4, Canada
Ribeirão Preto Medical School - FMRP, Department of Surgery and Anatomy, University of São Paulo, Brazil, 14049-900
Robert J. Tomsich Pathology & Laboratory Medicine Institute, Lerner Research Inst, Dept. of Pathology, Cleveland Clinic Foundation, Cleveland, OH 44195, USA
Rockefeller University, 1230 York Ave, New York, NY 10065, USA
Rose Ella Burkhardt Brain Tumor and Neuro-Oncology Center ND4-52A, Cleveland Clinic Foundation, 9500 Euclid Ave, Cleveland, OH 44195, USA
Rose Ella Burkhardt Brain Tumor and Neuro-Oncology Center, 9500 Euclid Avenue - CA51, Cleveland, OH 44195, USA
Rose Ella Burkhardt Brain Tumor and Neuro-Oncology Center, Department of Neurosurgery, Neurological and
Roswell Park Cancer Institute. Elm & Carlton Streets, Buffalo, NY 14263, USA
Rush University Medical Center, Department of Cardiovascular and Thoracic Surgery. Suite 774 Professional Office Building, 1735 W. Harrison St., Chicago, IL 60612, USA
Rush University Medical Center, Department of Pathology, Department of Cell and Molecular Medicine. 570 Jelke Southcenter, 1750 W. Harrison St., Chicago, IL 60612, USA
Sage Bionetworks, Seattle, WA 98109, USA
Saint-Petersburg City Clinical Oncology Hospital, 56 Veteranov prospect, Saint-Petersburg, 198255, Russia
Sapienza University of Rome, Piazzale Aldo Moro 5, 00185 Rome, Italy
Sir Peter MacCallum, Department of Oncology, University of Melbourne, Parkville, 3050, Victoria, Australia
St. Joseph’s/Candler Hospital, Department of Pathology, 5353 Reynolds St., Savannah, GA 31405, USA
St. Petersburg Academic University RAS, 8/3 Khlopin Str., St. Petersburg, 194021, Russia
Spectrum Health, Department of Pathology, 35 Michigan NE, Grand Rapids, MI 49503, USA
Stanford University, Palo Alto, CA, USA, USA
Stephenson Cancer Center, University of Oklahoma, Oklahoma City, OK 73104, USA
Tayside Tissue Bank, University of Dundee, Scotland UK DD1 9SY
The International Genomics Consortium, 445 N. 5th Street, Phoenix, AZ 85004, USA
The Oregon Clinic, 1111 NE 99th Ave, Portland, OR 97220, USA
The Prince Charles Hospital, UQ Thoracic Research Centre, Australia 4032
The Research Institute at Nationwide Children’s Hospital, 700 Children’s Drive, Columbus, OH 43205, USA
Tufts Medical Center, 800 Washington St., Boston, MA 02111, USA
UCSF-Helen Diller Family Comprehensive Cancer Center, 550 16th St., Mission Hall WS 6532 Box 3211, San Francisco, CA 94143, USA
University Hospital of Giessen and Marburg, Badingerstrasse 3, 35044, Marburg, Germany
University Hospital in Würzburg, Germany, Oberdürrbacher Strasse 6, 97080, Würzburg, Germany
University Health Network, 200 Elizabeth Street, Toronto ON M5G 2C4 Canada
University Hospital Essen, University Duisburg-Essen, German Cancer Consortium, Hufelandstr. 55; 45239 Essen, Germany
University Medical Center Hamburg-Eppendorf, Martinistr. 52, D-20246 Hamburg, Germany
University of Abuja Teaching Hospital, Gwagalada, FCT, Nigeria
University of Alabama at Birmingham Medical Center, 401 Beacon Pkwy W, Birmingham, AL 35209, USA
University of Arizona, Tucson AZ 85721, USA
University of Calgary, Departments of Surgery and Oncology, 1331 - 29th St NW, Calgary, AB, T2N 4N2, Canada
University of California San Francisco, 2340 Sutter St Rm S 229, San Francisco, CA 94143, USA
University of California, Irvine, 333 City Boulevard West, Suite 1400, Orange, CA 92868, USA
University of Chicago Medicine, 5841 S. Maryland Ave., Room G-216, MC 5094|Chicago, IL 60637, USA
University of Cincinnati Cancer Institute, Brain Tumor Clinical Trials, 200 Albert Sabin Way, Suite 1012, Cincinnati, OH 45267, USA
University of Cincinnati Cancer Institute, 200 Albert Sabin Way, Suite 1012, Cincinnati, OH 45267-0502, USA
University of Cincinnati, UC Health University Hospital, Dept. of Pathology & Laboratory Medicine, 234 Goodman Street, Cincinnati, OH 45219-0533, USA
University of Cincinnati Cancer Institute, Holmes Bldg., 200 Albert Sabin Way, Ste 1002, Cincinnati, OH 45267-0502, USA
University of Colorado Cancer Center, Aurora, CO 80111, USA
University of Dundee, Scotland UK DD1 9SY
University of Florence, Viale Pieraccini 6, 50139 Firenze, Italy
University of Hawaii Cancer Center, 701 Ilalo Street, Honolulu, HI 96813, USA
University of Heidelberg, Dept. Neuropathology, INF 224, 69120 Heidelberg, Germany
University of Heidelberg, Dept. Neurosurgery, INF 400, 69120 Heidelberg, Germany
University of Heidelberg, Division of Neurosurgical Research, Dept. Neurosurgery, INF 400, 69120 Heidelberg, Germany
University Hospitals Cleveland Medical Center, Division of Neuropathology, Department of Pathology, Providence Health and Services, Cleveland, OH 44106, USA
University of Iowa Hospital & Clinics, 200 Hawkins Drive, Clinical Trials-Data Management, 11510 PFP, Iowa City, IA 52242, USA
University of Iowa Hospital & Clinics, 200 Hawkins Drive, Hematology/Oncology, C32 GH, Iowa City, IA 52242, USA
University of Iowa Hospital & Clinics, 200 Hawkins Drive, ICTS-Informatics, 272 MRF, Iowa City, IA 52242, USA
University of Iowa Hospital & Clinics, 200 Hawkins Drive, Medicine Administration, 380 MRC, Iowa City, IA 52242, USA
University of Iowa Hospital & Clinics, 200 Hawkins Drive, Molecular Pathology, B606 GH, Iowa City, IA 52242, USA
University of Iowa Hospital & Clinics, 200 Hawkins Drive, Pathology, SW247 GH, Iowa City, IA 52242, USA
University of Kansas Cancer Center, 3901 Rainbow Blvd, Kansas City, KS 66160, USA
University of Kansas Medical Center, Kansas City, KS 66160, USA
University of Kansas Medical Center, Department of Pathology and Laboratory Medicine, Kansas City, KS 66206, USA
University of Kansas Medical Center Department of Orthopedic Surgery, 3901 Rainbow Boulevard, Kansas City, KS 66160, USA
University of Lausanne, Department of Computational Biology, Lausanne, Switzerland
University of Maryland School of Medicine, Department of Epidemiology and Public Health, Baltimore MD 21201, USA
University of Michigan, 500 S State St, Ann Arbor, MI 48109, USA
University of Michigan, Department of Surgery, Ann Arbor, MI 48109, USA
University of Montreal, 2900 Edouard Mont petit Blvd, Montreal, QC H3T 1J4, Canada
University of New Mexico, Albuquerque, NM 87131, USA
University of Pennsylvania, Philadelphia, PA 19104, USA
University of Pittsburgh, Department of Cardiothoracic Surgery, 200 Lothrop St, Suite C-800, Pittsburgh, PA 15213, USA
University of Pittsburgh, Department of Pathology, Pittsburgh, PA 15213, USA
University of Puerto Rico Comprehensive Cancer Center Biobank, Celso Barbosa St. Medical Center Area, San Juan, PR 00936
University of Sheffield Western Bank, Sheffield S10 2TN, UK
University of Washington, Seattle, WA 98105, USA
University of Western Australia School of Medicine, National Center for Asbestos Related Research, Nedlands, WA, Australia 6009
University of Wisconsin School of Medicine and Public Health, Department of Medicine, 1685 Highland Avenue, Madison, WI 53705, USA
Valley Health System, 1 Valley Health Plaza, Paramus, NJ 07652, USA
Vanderbilt University Medical Center, 1211 Medical Center Dr, Nashville, TN 37232, USA
Walter Reed National Military Medical Center, Clinical Breast Care Project, Murtha Cancer Center, Uniformed Services University, Bethesda, MD 20889, USA
Walter Reed National Military Medical Center, Murtha Cancer Center, Uniformed Services University, Bethesda, MD 20889, USA
Washington University School of Medicine, 600 S. Taylor Ave, St. Louis, MO 63110, USA
Washington University in St. Louis, Department of Medicine, 660 S. Euclid Ave., CB 8066, St. Louis, MO 63110, USA
Weill Cornell Medical College, New York, NY 10065, USA
Yonsei University College of Medicine, Department of Medicine, Seoul, Republic of Korea
Footnotes
AUTHOR CONTRIBUTIONS
Conceptualization: YL, NSS, TH, ADC, JAS, FF, RB, VT, AJB, PWL Data Analysis: YL, NSS, TH, ADC, FSV, JAS, FF, RB, MI, JK, WC, RA, RSK, VT Clinicopathologic Analysis: CSR, JEW, KKW, SJM, LM, AIO, SB, CSP, AJL Critical thinking: YL, NSS, TH, ADC, JAS, FF, RB, VT, AJB, PWL Writing - Original Draft: YL, NSS, TH, BGS, ADC, FF, VT, AJB, PWL Visualization: YL, NSS, TH, ADC, RB, MI, JK, WC, RA, RSK, RS, VT Writing - Review & Editing: YL, NSS, TH, BGS, ADC, VT, AJB, PWL
DECLARATION OF INTERESTS
Andrew Cherniack, Ashton C. Berger, and Galen Gao receive research support from Bayer Pharmaceuticals AG. Kenneth Wang serves on Advisory Board for Boston Scientific, Microtech, Olympus. Peter W. Laird is on the Scientific Advisory Board for AnchorDx. Josh M. Stuart is the Founder of Five3 Genomics and shareholder of Nantomics. Christina Yau is a part-time employee/consultant at NantOmics. Gordon Mills serves on the External Scientific Review Board of Astrazeneca. Daniel J. Weisenberger is a consultant for Zymo Research Corporation. Charles M. Perou is an equity stock holder, consultant, and Board of Director Member, of BioClassifier LLC and GeneCentric Diagnostics and is listed as inventor on patent applications on the Breast PAM50 and Lung Cancer Subtyping assays. Matthew Meyerson has research support from Bayer, is equity holder in, consultant for and Scientific Advisory Board chair for OrigiMed, and is inventor on patent for EGFR mutation diagnosis in lung cancer, licensed to LabCorp. Kyle R. Covington is an employee of Castle Biosciences Inc. Joel Tepper is a consultant at EMD Serono. Gordon Mills serves on the External Scientific Review Board of Astrazeneca. Anil Sood is on the SAB for Kiyatec and is a shareholder in BioPath. Beth Y. Karlan is on the Advisory Board for Invitae. Han Liang is a shareholder and scientific advisor of Precision Scientific Ltd. and Eagle Nebula Inc.
Publisher's Disclaimer: This is a PDF file of an unedited manuscript that has been accepted for publication. As a service to our customers we are providing this early version of the manuscript. The manuscript will undergo copyediting, typesetting, and review of the resulting proof before it is published in its final citable form. Please note that during the production process errors may be discovered which could affect the content, and all legal disclaimers that apply to the journal pertain.
References
- Alexandrov LB, Nik-Zainal S, Siu HC, Leung SY, Stratton MR. A mutational signature in gastric cancer suggests therapeutic strategies. Nat Commun. 2015;6:8683. doi: 10.1038/ncomms9683. [DOI] [PMC free article] [PubMed] [Google Scholar]
- Alexandrov LB, Nik-Zainal S, Wedge DC, Aparicio SA, Behjati S, Biankin AV, Bignell GR, Bolli N, Borg A, Borresen-Dale AL, et al. Signatures of mutational processes in human cancer. Nature. 2013;500:415–421. doi: 10.1038/nature12477. [DOI] [PMC free article] [PubMed] [Google Scholar]
- Arnold M, Soerjomataram I, Ferlay J, Forman D. Global incidence of oesophageal cancer by histological subtype in 2012. Gut. 2015;64:381–387. doi: 10.1136/gutjnl-2014-308124. [DOI] [PubMed] [Google Scholar]
- Banerjea A, Hands RE, Powar MP, Bustin SA, Dorudi S. Microsatellite and chromosomal stable colorectal cancers demonstrate poor immunogenicity and early disease recurrence. Colorectal Dis. 2009;11:601–608. doi: 10.1111/j.1463-1318.2008.01639.x. [DOI] [PubMed] [Google Scholar]
- Bignell GR, Greenman CD, Davies H, Butler AP, Edkins S, Andrews JM, Buck G, Chen L, Beare D, Latimer C, et al. Signatures of mutation and selection in the cancer genome. Nature. 2010;463:893–898. doi: 10.1038/nature08768. [DOI] [PMC free article] [PubMed] [Google Scholar]
- Bijlsma MF, Sadanandam A, Tan P, Vermeulen L. Molecular subtypes in cancers of the gastrointestinal tract. Nat Rev Gastroenterol Hepatol. 2017;14:333–342. doi: 10.1038/nrgastro.2017.33. [DOI] [PubMed] [Google Scholar]
- Bonhomme C, Duluc I, Martin E, Chawengsaksophak K, Chenard MP, Kedinger M, Beck F, Freund JN, Domon-Dell C. The Cdx2 homeobox gene has a tumour suppressor function in the distal colon in addition to a homeotic role during gut development. Gut. 2003;52:1465–1471. doi: 10.1136/gut.52.10.1465. [DOI] [PMC free article] [PubMed] [Google Scholar]
- Budinska E, Popovici V, Tejpar S, D’Ario G, Lapique N, Sikora KO, Di Narzo AF, Yan P, Hodgson JG, Weinrich S, et al. Gene expression patterns unveil a new level of molecular heterogeneity in colorectal cancer. J Pathol. 2013;231:63–76. doi: 10.1002/path.4212. [DOI] [PMC free article] [PubMed] [Google Scholar]
- Bunz F, Fauth C, Speicher MR, Dutriaux A, Sedivy JM, Kinzler KW, Vogelstein B, Lengauer C. Targeted inactivation of p53 in human cells does not result in aneuploidy. Cancer Res. 2002;62:1129–1133. [PubMed] [Google Scholar]
- Cancer Genome Atlas Research Network. Integrated genomic analyses of ovarian carcinoma. Nature. 2011;474:609–615. doi: 10.1038/nature10166. [DOI] [PMC free article] [PubMed] [Google Scholar]
- Cancer Genome Atlas Research Network. Comprehensive molecular characterization of human colon and rectal cancer. Nature. 2012;487:330–337. doi: 10.1038/nature11252. [DOI] [PMC free article] [PubMed] [Google Scholar]
- Cancer Genome Atlas Research Network. Comprehensive molecular characterization of gastric adenocarcinoma. Nature. 2014;513:202–209. doi: 10.1038/nature13480. [DOI] [PMC free article] [PubMed] [Google Scholar]
- Cancer Genome Atlas Research Network. Integrated genomic characterization of oesophageal carcinoma. Nature. 2017;541:169–175. doi: 10.1038/nature20805. [DOI] [PMC free article] [PubMed] [Google Scholar]
- Carter SL, Cibulskis K, Helman E, McKenna A, Shen H, Zack T, Laird PW, Onofrio RC, Winckler W, Weir BA, et al. Absolute quantification of somatic DNA alterations in human cancer. Nat Biotechnol. 2012;30:413–421. doi: 10.1038/nbt.2203. [DOI] [PMC free article] [PubMed] [Google Scholar]
- Chakravarty D, Gao J, Phillips S, Kundra R, Zhang H, Wang J, Rudolph JE, Yaeger R, Soumerai T, Nissan MH, et al. OncoKB: A Precision Oncology Knowledge Base. JCO Precision Oncology. 2017:1–16. doi: 10.1200/PO.17.00011. [DOI] [PMC free article] [PubMed] [Google Scholar]
- Chan TL, Curtis LC, Leung SY, Farrington SM, Ho JW, Chan AS, Lam PW, Tse CW, Dunlop MG, Wyllie AH, et al. Early-onset colorectal cancer with stable microsatellite DNA and near-diploid chromosomes. Oncogene. 2001;20:4871–4876. doi: 10.1038/sj.onc.1204653. [DOI] [PubMed] [Google Scholar]
- Chu J, Sadeghi S, Raymond A, Jackman SD, Nip KM, Mar R, Mohamadi H, Butterfield YS, Robertson AG, Birol I. BioBloom tools: fast, accurate and memoryefficient host species sequence screening using bloom filters. Bioinformatics. 2014;30:3402–3404. doi: 10.1093/bioinformatics/btu558. [DOI] [PMC free article] [PubMed] [Google Scholar]
- Cibulskis K, Lawrence MS, Carter SL, Sivachenko A, Jaffe D, Sougnez C, Gabriel S, Meyerson M, Lander ES, Getz G. Sensitive detection of somatic point mutations in impure and heterogeneous cancer samples. Nat Biotechnol. 2013;31:213–219. doi: 10.1038/nbt.2514. [DOI] [PMC free article] [PubMed] [Google Scholar]
- Cibulskis K, McKenna A, Fennell T, Banks E, DePristo M, Getz G. ContEst: estimating cross-contamination of human samples in next-generation sequencing data. Bioinformatics. 2011;27:2601–2602. doi: 10.1093/bioinformatics/btr446. [DOI] [PMC free article] [PubMed] [Google Scholar]
- Consortium, G.T., Laboratory, D.A., Coordinating Center -Analysis Working G, Statistical Methods groups-Analysis Working G, Enhancing G.g, Fund NIHC, Nih/Nci, Nih/Nhgri, Nih/Nimh, Nih/Nida, et al. Genetic effects on gene expression across human tissues. Nature. 2017;550:204–213. doi: 10.1038/nature24277. [DOI] [PMC free article] [PubMed] [Google Scholar]
- Costello M, Pugh TJ, Fennell TJ, Stewart C, Lichtenstein L, Meldrim JC, Fostel JL, Friedrich DC, Perrin D, Dionne D, et al. Discovery and characterization of artifactual mutations in deep coverage targeted capture sequencing data due to oxidative DNA damage during sample preparation. Nucleic Acids Res. 2013;41:e67. doi: 10.1093/nar/gks1443. [DOI] [PMC free article] [PubMed] [Google Scholar]
- Cristescu R, Lee J, Nebozhyn M, Kim KM, Ting JC, Wong SS, Liu J, Yue YG, Wang J, Yu K, et al. Molecular analysis of gastric cancer identifies subtypes associated with distinct clinical outcomes. Nat Med. 2015;21:449–456. doi: 10.1038/nm.3850. [DOI] [PubMed] [Google Scholar]
- Daily K, Ho Sui SJ, Schriml LM, Dexheimer PJ, Salomonis N, Schroll R, Bush S, Keddache M, Mayhew C, Lotia S, et al. Molecular, phenotypic, and sample-associated data to describe pluripotent stem cell lines and derivatives. Sci Data. 2017;4:170030. doi: 10.1038/sdata.2017.30. [DOI] [PMC free article] [PubMed] [Google Scholar]
- Davoli T, Uno H, Wooten EC, Elledge SJ. Tumor aneuploidy correlates with markers of immune evasion and with reduced response to immunotherapy. Science. 2017;355 doi: 10.1126/science.aaf8399. [DOI] [PMC free article] [PubMed] [Google Scholar]
- Derks S, Liao X, Chiaravalli AM, Xu X, Camargo MC, Solcia E, Sessa F, Fleitas T, Freeman GJ, Rodig SJ, et al. Abundant PD-L1 expression in Epstein-Barr Virusinfected gastric cancers. Oncotarget. 2016;7:32925–32932. doi: 10.18632/oncotarget.9076. [DOI] [PMC free article] [PubMed] [Google Scholar]
- Dienstmann R, Vermeulen L, Guinney J, Kopetz S, Tejpar S, Tabernero J. Consensus molecular subtypes and the evolution of precision medicine in colorectal cancer. Nat Rev Cancer. 2017;17:79–92. doi: 10.1038/nrc.2016.126. [DOI] [PubMed] [Google Scholar]
- Dulak AM, Schumacher SE, van Lieshout J, Imamura Y, Fox C, Shim B, Ramos AH, Saksena G, Baca SC, Baselga J, et al. Gastrointestinal adenocarcinomas of the esophagus, stomach, and colon exhibit distinct patterns of genome instability and oncogenesis. Cancer Res. 2012;72:4383–4393. doi: 10.1158/0008-5472.CAN-11-3893. [DOI] [PMC free article] [PubMed] [Google Scholar]
- Dulak AM, Stojanov P, Peng S, Lawrence MS, Fox C, Stewart C, Bandla S, Imamura Y, Schumacher SE, Shefler E, et al. Exome and whole-genome sequencing of esophageal adenocarcinoma identifies recurrent driver events and mutational complexity. Nat Genet. 2013;45:478–486. doi: 10.1038/ng.2591. [DOI] [PMC free article] [PubMed] [Google Scholar]
- Ebert MP, Tanzer M, Balluff B, Burgermeister E, Kretzschmar AK, Hughes DJ, Tetzner R, Lofton-Day C, Rosenberg R, Reinacher-Schick AC, et al. TFAP2E-DKK4 and chemoresistance in colorectal cancer. N Engl J Med. 2012;366:44–53. doi: 10.1056/NEJMoa1009473. [DOI] [PubMed] [Google Scholar]
- Fang M, Hutchinson L, Deng A, Green MR. Common BRAF(V600E)-directed pathway mediates widespread epigenetic silencing in colorectal cancer and melanoma. Proc Natl Acad Sci U S A. 2016;113:1250–1255. doi: 10.1073/pnas.1525619113. [DOI] [PMC free article] [PubMed] [Google Scholar]
- Forbes SA, Bindal N, Bamford S, Cole C, Kok CY, Beare D, Jia M, Shepherd R, Leung K, Menzies A, et al. COSMIC: mining complete cancer genomes in the Catalogue of Somatic Mutations in Cancer. Nucleic Acids Res. 2011;39:D945–950. doi: 10.1093/nar/gkq929. [DOI] [PMC free article] [PubMed] [Google Scholar]
- Ganem NJ, Storchova Z, Pellman D. Tetraploidy, aneuploidy and cancer. Curr Opin Genet Dev. 2007;17:157–162. doi: 10.1016/j.gde.2007.02.011. [DOI] [PubMed] [Google Scholar]
- Glover TW, Wilson TE, Arlt MF. Fragile sites in cancer: more than meets the eye. Nat Rev Cancer. 2017;17:489–501. doi: 10.1038/nrc.2017.52. [DOI] [PMC free article] [PubMed] [Google Scholar]
- Guinney J, Dienstmann R, Wang X, de Reynies A, Schlicker A, Soneson C, Marisa L, Roepman P, Nyamundanda G, Angelino P, et al. The consensus molecular subtypes of colorectal cancer. Nat Med. 2015;21:1350–1356. doi: 10.1038/nm.3967. [DOI] [PMC free article] [PubMed] [Google Scholar]
- Guo Z, Kozlov S, Lavin MF, Person MD, Paull TT. ATM activation by oxidative stress. Science. 2010;330:517–521. doi: 10.1126/science.1192912. [DOI] [PubMed] [Google Scholar]
- Herman JG, Umar A, Polyak K, Graff JR, Ahuja N, Issa JP, Markowitz S, Willson JK, Hamilton SR, Kinzler KW, et al. Incidence and functional consequences of hMLH1 promoter hypermethylation in colorectal carcinoma. Proc Natl Acad Sci U S A. 1998;95:6870–6875. doi: 10.1073/pnas.95.12.6870. [DOI] [PMC free article] [PubMed] [Google Scholar]
- Hinoue T, Weisenberger DJ, Pan F, Campan M, Kim M, Young J, Whitehall VL, Leggett BA, Laird PW. Analysis of the association between CIMP and BRAF in colorectal cancer by DNA methylation profiling. PLoS One. 2009;4:e8357. doi: 10.1371/journal.pone.0008357. [DOI] [PMC free article] [PubMed] [Google Scholar]
- Hoadley KA, Yau C, Hinoue T, Wolf DM, et al. Cell-of-Origin Patterns Dominate the Molecular Classification of 10,000 Tumors from 33 Types of Cancer. Cell. 2018 doi: 10.1016/j.cell.2018.03.022. Under Review. [DOI] [PMC free article] [PubMed] [Google Scholar]
- Hoadley KA, Yau C, Wolf DM, Cherniack AD, Tamborero D, Ng S, Leiserson MD, Niu B, McLellan MD, Uzunangelov V, et al. Multiplatform analysis of 12 cancer types reveals molecular classification within and across tissues of origin. Cell. 2014;158:929–944. doi: 10.1016/j.cell.2014.06.049. [DOI] [PMC free article] [PubMed] [Google Scholar]
- International Agency for Research on Cancer. WHO Classification of Tumours of the Digestive System. 4 2010. [Google Scholar]
- Isella C, Terrasi A, Bellomo SE, Petti C, Galatola G, Muratore A, Mellano A, Senetta R, Cassenti A, Sonetto C, et al. Stromal contribution to the colorectal cancer transcriptome. Nat Genet. 2015;47:312–319. doi: 10.1038/ng.3224. [DOI] [PubMed] [Google Scholar]
- Janjigian YY, Sanchez-Vega F, Jonsson P, Chatila WK, Hechtman JF, Ku GY, Riches JC, Tuvy Y, Kundra R, Bouvier N, et al. Genetic Predictors of Response to Systemic Therapy in Esophagogastric Cancer. Cancer Discov. 2018;8:49–58. doi: 10.1158/2159-8290.CD-17-0787. [DOI] [PMC free article] [PubMed] [Google Scholar]
- Javier BM, Yaeger R, Wang L, Sanchez-Vega F, Zehir A, Middha S, Sadowska J, Vakiani E, Shia J, Klimstra D, et al. Recurrent, truncating SOX9 mutations are associated with SOX9 overexpression, KRAS mutation, and TP53 wild type status in colorectal carcinoma. Oncotarget. 2016;7:50875–50882. doi: 10.18632/oncotarget.9682. [DOI] [PMC free article] [PubMed] [Google Scholar]
- Jin Z, Yoon HH. The promise of PD-1 inhibitors in gastro-esophageal cancers: microsatellite instability vs. PD-L1. J Gastrointest Oncol. 2016;7:771–788. doi: 10.21037/jgo.2016.08.06. [DOI] [PMC free article] [PubMed] [Google Scholar]
- Kandoth C, McLellan MD, Vandin F, Ye K, Niu B, Lu C, Xie M, Zhang Q, McMichael JF, Wyczalkowski MA, et al. Mutational landscape and significance across 12 major cancer types. Nature. 2013;502:333–339. doi: 10.1038/nature12634. [DOI] [PMC free article] [PubMed] [Google Scholar]
- Kim J, Fox C, Peng S, Pusung M, Pectasides E, Matthee E, Hong YS, Do IG, Jang J, Thorner AR, et al. Preexisting oncogenic events impact trastuzumab sensitivity in ERBB2-amplified gastroesophageal adenocarcinoma. J Clin Invest. 2014;124:5145–5158. doi: 10.1172/JCI75200. [DOI] [PMC free article] [PubMed] [Google Scholar]
- Kim J, Mouw KW, Polak P, Braunstein LZ, Kamburov A, Tiao G, Kwiatkowski DJ, Rosenberg JE, Van Allen EM, D’Andrea AD, et al. Somatic ERCC2 mutations are associated with a distinct genomic signature in urothelial tumors. Nat Genet. 2016;48:600–606. doi: 10.1038/ng.3557. [DOI] [PMC free article] [PubMed] [Google Scholar]
- Koh J, Ock CY, Kim JW, Nam SK, Kwak Y, Yun S, Ahn SH, Park DJ, Kim HH, Kim WH, et al. Clinicopathologic implications of immune classification by PD-L1 expression and CD8-positive tumor-infiltrating lymphocytes in stage II and III gastric cancer patients. Oncotarget. 2017;8:26356–26367. doi: 10.18632/oncotarget.15465. [DOI] [PMC free article] [PubMed] [Google Scholar]
- Korn JM, Kuruvilla FG, McCarroll SA, Wysoker A, Nemesh J, Cawley S, Hubbell E, Veitch J, Collins PJ, Darvishi K, et al. Integrated genotype calling and association analysis of SNPs, common copy number polymorphisms and rare CNVs. Nat Genet. 2008;40:1253–1260. doi: 10.1038/ng.237. [DOI] [PMC free article] [PubMed] [Google Scholar]
- Kostic AD, Ojesina AI, Pedamallu CS, Jung J, Verhaak RG, Getz G, Meyerson M. PathSeq: software to identify or discover microbes by deep sequencing of human tissue. Nat Biotechnol. 2011;29:393–396. doi: 10.1038/nbt.1868. [DOI] [PMC free article] [PubMed] [Google Scholar]
- Lawrence MS, Stojanov P, Mermel CH, Robinson JT, Garraway LA, Golub TR, Meyerson M, Gabriel SB, Lander ES, Getz G. Discovery and saturation analysis of cancer genes across 21 tumour types. Nature. 2014;505:495–501. doi: 10.1038/nature12912. [DOI] [PMC free article] [PubMed] [Google Scholar]
- Le DT, Durham JN, Smith KN, Wang H, Bartlett BR, Aulakh LK, Lu S, Kemberling H, Wilt C, Luber BS, et al. Mismatch repair deficiency predicts response of solid tumors to PD-1 blockade. Science. 2017;357:409–413. doi: 10.1126/science.aan6733. [DOI] [PMC free article] [PubMed] [Google Scholar]
- Leffers H, Dejgaard K, Celis JE. Characterisation of two major cellular poly(rC)-binding human proteins, each containing three K-homologous (KH) domains. Eur J Biochem. 1995;230:447–453. [PubMed] [Google Scholar]
- Leung SY, Yuen ST, Chung LP, Chu KM, Chan AS, Ho JC. hMLH1 promoter methylation and lack of hMLH1 expression in sporadic gastric carcinomas with high-frequency microsatellite instability. Cancer Res. 1999;59:159–164. [PubMed] [Google Scholar]
- Li B, Dewey CN. RSEM: accurate transcript quantification from RNA-Seq data with or without a reference genome. BMC Bioinformatics. 2011;12:323. doi: 10.1186/1471-2105-12-323. [DOI] [PMC free article] [PubMed] [Google Scholar]
- Li M, Fang X, Baker DJ, Guo L, Gao X, Wei Z, Han S, van Deursen JM, Zhang P. The ATM-p53 pathway suppresses aneuploidy-induced tumorigenesis. Proc Natl Acad Sci U S A. 2010;107:14188–14193. doi: 10.1073/pnas.1005960107. [DOI] [PMC free article] [PubMed] [Google Scholar]
- Ljunggren HG, Malmberg KJ. Prospects for the use of NK cells in immunotherapy of human cancer. Nat Rev Immunol. 2007;7:329–339. doi: 10.1038/nri2073. [DOI] [PubMed] [Google Scholar]
- Lynch HT, Snyder CL, Shaw TG, Heinen CD, Hitchins MP. Milestones of Lynch syndrome: 1895–2015. Nat Rev Cancer. 2015;15:181–194. doi: 10.1038/nrc3878. [DOI] [PubMed] [Google Scholar]
- Malta TM, Sokolov A, Gentles AJ, et al. Cancer Cell Under Review. 2018. [Google Scholar]
- Matsusaka K, Kaneda A, Nagae G, Ushiku T, Kikuchi Y, Hino R, Uozaki H, Seto Y, Takada K, Aburatani H, et al. Classification of Epstein-Barr virus-positive gastric cancers by definition of DNA methylation epigenotypes. Cancer Res. 2011;71:7187–7197. doi: 10.1158/0008-5472.CAN-11-1349. [DOI] [PubMed] [Google Scholar]
- McCarroll SA, Kuruvilla FG, Korn JM, Cawley S, Nemesh J, Wysoker A, Shapero MH, de Bakker PI, Maller JB, Kirby A, et al. Integrated detection and population-genetic analysis of SNPs and copy number variation. Nat Genet. 2008;40:1166–1174. doi: 10.1038/ng.238. [DOI] [PubMed] [Google Scholar]
- McConnell BB, Kim SS, Yu K, Ghaleb AM, Takeda N, Manabe I, Nusrat A, Nagai R, Yang VW. Kruppel-like factor 5 is important for maintenance of crypt architecture and barrier function in mouse intestine. Gastroenterology. 2011;141:1302–1313. 1313 e1301–1306. doi: 10.1053/j.gastro.2011.06.086. [DOI] [PMC free article] [PubMed] [Google Scholar]
- Mermel CH, Schumacher SE, Hill B, Meyerson ML, Beroukhim R, Getz G. GISTIC2.0 facilitates sensitive and confident localization of the targets of focal somatic copy-number alteration in human cancers. Genome Biol. 2011;12:R41. doi: 10.1186/gb-2011-12-4-r41. [DOI] [PMC free article] [PubMed] [Google Scholar]
- Mishra L, Shetty K, Tang Y, Stuart A, Byers SW. The role of TGF-beta and Wnt signaling in gastrointestinal stem cells and cancer. Oncogene. 2005;24:5775–5789. doi: 10.1038/sj.onc.1208924. [DOI] [PubMed] [Google Scholar]
- Moons LM, Bax DA, Kuipers EJ, Van Dekken H, Haringsma J, Van Vliet AH, Siersema PD, Kusters JG. The homeodomain protein CDX2 is an early marker of Barrett’s oesophagus. J Clin Pathol. 2004;57:1063–1068. doi: 10.1136/jcp.2003.015727. [DOI] [PMC free article] [PubMed] [Google Scholar]
- Muro K, Chung HC, Shankaran V, Geva R, Catenacci D, Gupta S, Eder JP, Golan T, Le DT, Burtness B, et al. Pembrolizumab for patients with PD-L1-positive advanced gastric cancer (KEYNOTE-012): a multicentre, open-label, phase 1b trial. Lancet Oncol. 2016;17:717–726. doi: 10.1016/S1470-2045(16)00175-3. [DOI] [PubMed] [Google Scholar]
- Nandan MO, Ghaleb AM, Liu Y, Bialkowska AB, McConnell BB, Shroyer KR, Robine S, Yang VW. Inducible intestine-specific deletion of Kruppel-like factor 5 is characterized by a regenerative response in adult mouse colon. Dev Biol. 2014;387:191–202. doi: 10.1016/j.ydbio.2014.01.002. [DOI] [PMC free article] [PubMed] [Google Scholar]
- Noah TK, Donahue B, Shroyer NF. Intestinal development and differentiation. Exp Cell Res. 2011;317:2702–2710. doi: 10.1016/j.yexcr.2011.09.006. [DOI] [PMC free article] [PubMed] [Google Scholar]
- Olshen AB, Venkatraman ES, Lucito R, Wigler M. Circular binary segmentation for the analysis of array-based DNA copy number data. Biostatistics. 2004;5:557–572. doi: 10.1093/biostatistics/kxh008. [DOI] [PubMed] [Google Scholar]
- Palles C, Cazier JB, Howarth KM, Domingo E, Jones AM, Broderick P, Kemp Z, Spain SL, Guarino E, Salguero I, et al. Germline mutations affecting the proofreading domains of POLE and POLD1 predispose to colorectal adenomas and carcinomas. Nat Genet. 2013;45:136–144. doi: 10.1038/ng.2503. [DOI] [PMC free article] [PubMed] [Google Scholar]
- Phipps AI, Passarelli MN, Chan AT, Harrison TA, Jeon J, Hutter CM, Berndt SI, Brenner H, Caan BJ, Campbell PT, et al. Common genetic variation and survival after colorectal cancer diagnosis: a genome-wide analysis. Carcinogenesis. 2016;37:87–95. doi: 10.1093/carcin/bgv161. [DOI] [PMC free article] [PubMed] [Google Scholar]
- Ramos AH, Lichtenstein L, Gupta M, Lawrence MS, Pugh TJ, Saksena G, Meyerson M, Getz G. Oncotator: cancer variant annotation tool. Hum Mutat. 2015;36:E2423–2429. doi: 10.1002/humu.22771. [DOI] [PMC free article] [PubMed] [Google Scholar]
- Ratan A, Olson TL, Loughran TP, Jr, Miller W. Identification of indels in next-generation sequencing data. BMC Bioinformatics. 2015;16:42. doi: 10.1186/s12859-015-0483-6. [DOI] [PMC free article] [PubMed] [Google Scholar]
- Reed KR, Korobko IV, Ninkina N, Korobko EV, Hopkins BR, Platt JL, Buchman V, Clarke AR. Hunk/Mak-v is a negative regulator of intestinal cell proliferation. BMC Cancer. 2015;15:110. doi: 10.1186/s12885-015-1087-2. [DOI] [PMC free article] [PubMed] [Google Scholar]
- Reich M, Liefeld T, Gould J, Lerner J, Tamayo P, Mesirov JP. GenePattern 2.0. Nat Genet. 2006;38:500–501. doi: 10.1038/ng0506-500. [DOI] [PubMed] [Google Scholar]
- Roepman P, Schlicker A, Tabernero J, Majewski I, Tian S, Moreno V, Snel MH, Chresta CM, Rosenberg R, Nitsche U, et al. Colorectal cancer intrinsic subtypes predict chemotherapy benefit, deficient mismatch repair and epithelial-to-mesenchymal transition. Int J Cancer. 2014;134:552–562. doi: 10.1002/ijc.28387. [DOI] [PMC free article] [PubMed] [Google Scholar]
- Salari K, Spulak ME, Cuff J, Forster AD, Giacomini CP, Huang S, Ko ME, Lin AY, van de Rijn M, Pollack JR. CDX2 is an amplified lineage-survival oncogene in colorectal cancer. Proc Natl Acad Sci U S A. 2012;109:E3196–3205. doi: 10.1073/pnas.1206004109. [DOI] [PMC free article] [PubMed] [Google Scholar]
- Salomonis N, Dexheimer PJ, Omberg L, Schroll R, Bush S, Huo J, Schriml L, Ho Sui S, Keddache M, Mayhew C, et al. Integrated Genomic Analysis of Diverse Induced Pluripotent Stem Cells from the Progenitor Cell Biology Consortium. Stem Cell Reports. 2016;7:110–125. doi: 10.1016/j.stemcr.2016.05.006. [DOI] [PMC free article] [PubMed] [Google Scholar]
- Sartore-Bianchi A, Trusolino L, Martino C, Bencardino K, Lonardi S, Bergamo F, Zagonel V, Leone F, Depetris I, Martinelli E, et al. Dual-targeted therapy with trastuzumab and lapatinib in treatment-refractory, KRAS codon 12/13 wild-type, HER2-positive metastatic colorectal cancer (HERACLES): a proof-of-concept, multicentre, openlabel, phase 2 trial. Lancet Oncol. 2016;17:738–746. doi: 10.1016/S1470-2045(16)00150-9. [DOI] [PubMed] [Google Scholar]
- Schepers A, Clevers H. Wnt signaling, stem cells, and cancer of the gastrointestinal tract. Cold Spring Harb Perspect Biol. 2012;4:a007989. doi: 10.1101/cshperspect.a007989. [DOI] [PMC free article] [PubMed] [Google Scholar]
- Secrier M, Li X, de Silva N, Eldridge MD, Contino G, Bornschein J, MacRae S, Grehan N, O’Donovan M, Miremadi A, et al. Mutational signatures in esophageal adenocarcinoma define etiologically distinct subgroups with therapeutic relevance. Nat Genet. 2016;48:1131–1141. doi: 10.1038/ng.3659. [DOI] [PMC free article] [PubMed] [Google Scholar]
- Sheltzer JM, Blank HM, Pfau SJ, Tange Y, George BM, Humpton TJ, Brito IL, Hiraoka Y, Niwa O, Amon A. Aneuploidy drives genomic instability in yeast. Science. 2011;333:1026–1030. doi: 10.1126/science.1206412. [DOI] [PMC free article] [PubMed] [Google Scholar]
- Sheltzer JM, Ko JH, Replogle JM, Habibe Burgos NC, Chung ES, Meehl CM, Sayles NM, Passerini V, Storchova Z, Amon A. Single-chromosome Gains Commonly Function as Tumor Suppressors. Cancer Cell. 2017;31:240–255. doi: 10.1016/j.ccell.2016.12.004. [DOI] [PMC free article] [PubMed] [Google Scholar]
- Sherwood RI, Chen TY, Melton DA. Transcriptional dynamics of endodermal organ formation. Dev Dyn. 2009;238:29–42. doi: 10.1002/dvdy.21810. [DOI] [PMC free article] [PubMed] [Google Scholar]
- Sia EA, Kokoska RJ, Dominska M, Greenwell P, Petes TD. Microsatellite instability in yeast: dependence on repeat unit size and DNA mismatch repair genes. Mol Cell Biol. 1997;17:2851–2858. doi: 10.1128/mcb.17.5.2851. [DOI] [PMC free article] [PubMed] [Google Scholar]
- Sokolov A, Paull EO, Stuart JM. One-Class Detection of Cell States in Tumor Subtypes. Pac Symp Biocomput. 2016;21:405–416. [PMC free article] [PubMed] [Google Scholar]
- Tan IB, Ivanova T, Lim KH, Ong CW, Deng N, Lee J, Tan SH, Wu J, Lee MH, Ooi CH, et al. Intrinsic subtypes of gastric cancer, based on gene expression pattern, predict survival and respond differently to chemotherapy. Gastroenterology. 2011;141:476–485. 485 e471–411. doi: 10.1053/j.gastro.2011.04.042. [DOI] [PMC free article] [PubMed] [Google Scholar]
- Thompson SL, Compton DA. Proliferation of aneuploid human cells is limited by a p53-dependent mechanism. J Cell Biol. 2010;188:369–381. doi: 10.1083/jcb.200905057. [DOI] [PMC free article] [PubMed] [Google Scholar]
- Torre LA, Siegel RL, Ward EM, Jemal A. Global Cancer Incidence and Mortality Rates and Trends--An Update. Cancer Epidemiol Biomarkers Prev. 2016;25:16–27. doi: 10.1158/1055-9965.EPI-15-0578. [DOI] [PubMed] [Google Scholar]
- Torres EM, Sokolsky T, Tucker CM, Chan LY, Boselli M, Dunham MJ, Amon A. Effects of aneuploidy on cellular physiology and cell division in haploid yeast. Science. 2007;317:916–924. doi: 10.1126/science.1142210. [DOI] [PubMed] [Google Scholar]
- Tripathi V, Sixt KM, Gao S, Xu X, Huang J, Weigert R, Zhou M, Zhang YE. Direct Regulation of Alternative Splicing by SMAD3 through PCBP1 Is Essential to the Tumor-Promoting Role of TGF-beta. Mol Cell. 2016;64:1010. doi: 10.1016/j.molcel.2016.11.025. [DOI] [PubMed] [Google Scholar]
- Wagner JA, Rosario M, Romee R, Berrien-Elliott MM, Schneider SE, Leong JW, Sullivan RP, Jewell BA, Becker-Hapak M, Schappe T, et al. CD56bright NK cells exhibit potent antitumor responses following IL-15 priming. J Clin Invest. 2017;127:4042–4058. doi: 10.1172/JCI90387. [DOI] [PMC free article] [PubMed] [Google Scholar]
- Wang K, Singh D, Zeng Z, Coleman SJ, Huang Y, Savich GL, He X, Mieczkowski P, Grimm SA, Perou CM, et al. MapSplice: accurate mapping of RNA-seq reads for splice junction discovery. Nucleic Acids Res. 2010;38:e178. doi: 10.1093/nar/gkq622. [DOI] [PMC free article] [PubMed] [Google Scholar]
- Wang K, Yuen ST, Xu J, Lee SP, Yan HH, Shi ST, Siu HC, Deng S, Chu KM, Law S, et al. Whole-genome sequencing and comprehensive molecular profiling identify new driver mutations in gastric cancer. Nat Genet. 2014;46:573–582. doi: 10.1038/ng.2983. [DOI] [PubMed] [Google Scholar]
- Weisenberger DJ, Siegmund KD, Campan M, Young J, Long TI, Faasse MA, Kang GH, Widschwendter M, Weener D, Buchanan D, et al. CpG island methylator phenotype underlies sporadic microsatellite instability and is tightly associated with BRAF mutation in colorectal cancer. Nat Genet. 2006;38:787–793. doi: 10.1038/ng1834. [DOI] [PubMed] [Google Scholar]
- Widschwendter M, Fiegl H, Egle D, Mueller-Holzner E, Spizzo G, Marth C, Weisenberger DJ, Campan M, Young J, Jacobs I, et al. Epigenetic stem cell signature in cancer. Nat Genet. 2007;39:157–158. doi: 10.1038/ng1941. [DOI] [PubMed] [Google Scholar]
- Williams BR, Prabhu VR, Hunter KE, Glazier CM, Whittaker CA, Housman DE, Amon A. Aneuploidy affects proliferation and spontaneous immortalization in mammalian cells. Science. 2008;322:703–709. doi: 10.1126/science.1160058. [DOI] [PMC free article] [PubMed] [Google Scholar]
- Xiao Y, Freeman GJ. The microsatellite instable subset of colorectal cancer is a particularly good candidate for checkpoint blockade immunotherapy. Cancer Discov. 2015;5:16–18. doi: 10.1158/2159-8290.CD-14-1397. [DOI] [PMC free article] [PubMed] [Google Scholar]
- Zhou Q, Talvinen K, Sundstrom J, Elzagheid A, Pospiech H, Syvaoja JE, Collan Y. Mutations/polymorphisms in the 55 kDa subunit of DNA polymerase epsilon in human colorectal cancer. Cancer Genomics Proteomics. 2009;6:297–304. [PubMed] [Google Scholar]
Associated Data
This section collects any data citations, data availability statements, or supplementary materials included in this article.
Supplementary Materials
Table S1. Related to Figure 1. Summary table of tumor sample characteristics.
Table S2. Related to Figure 1. Selected features for unsupervised clustering and non-GI AC case IDs.
Table S3. Related to Figure 1. Significantly mutated genes.
Table S4. Related to Figure 1. GISTIC regions and values.
Table S5. Related to Figure 1. Genes differentially expressed in GIAC compared to non-GIAC
Table S6. Related to Figure 1. GIAC developmental transcription factors
Table S7. Related to Figure 3. Epigenetic silencing calls