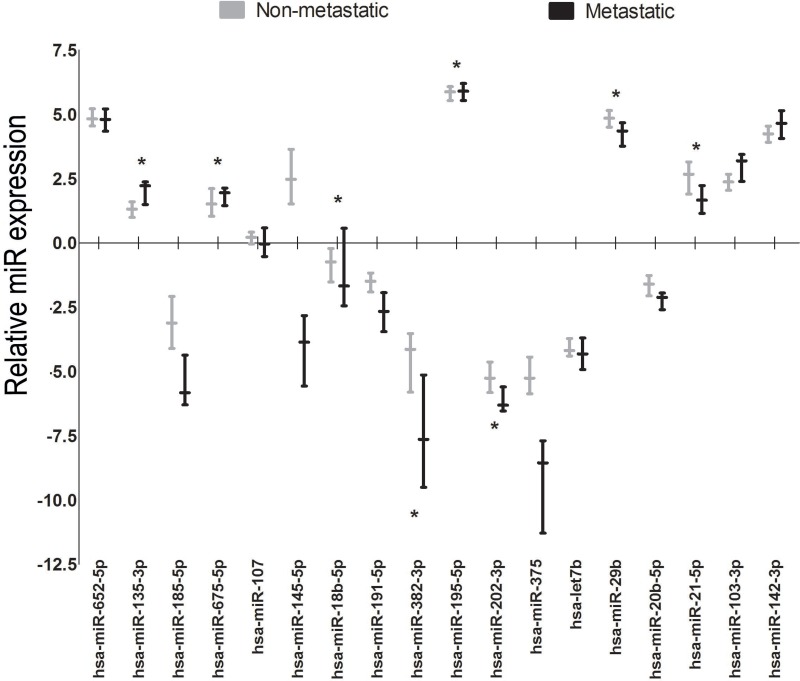
Figure 4. Relative miR expression of candidate miRs for metastatic versus non-metastatic validation samples.
The y-axis reflects the relative miR expression as compared to the overall expression of the 18 miRs evaluated in the validation cohort. The median and interquartile ranges per miR are displayed by the box-plot. *P-value< 0.05 (Mann–Whitney U test, after correction by Benjamini-Hochberg method (10% FDR).

