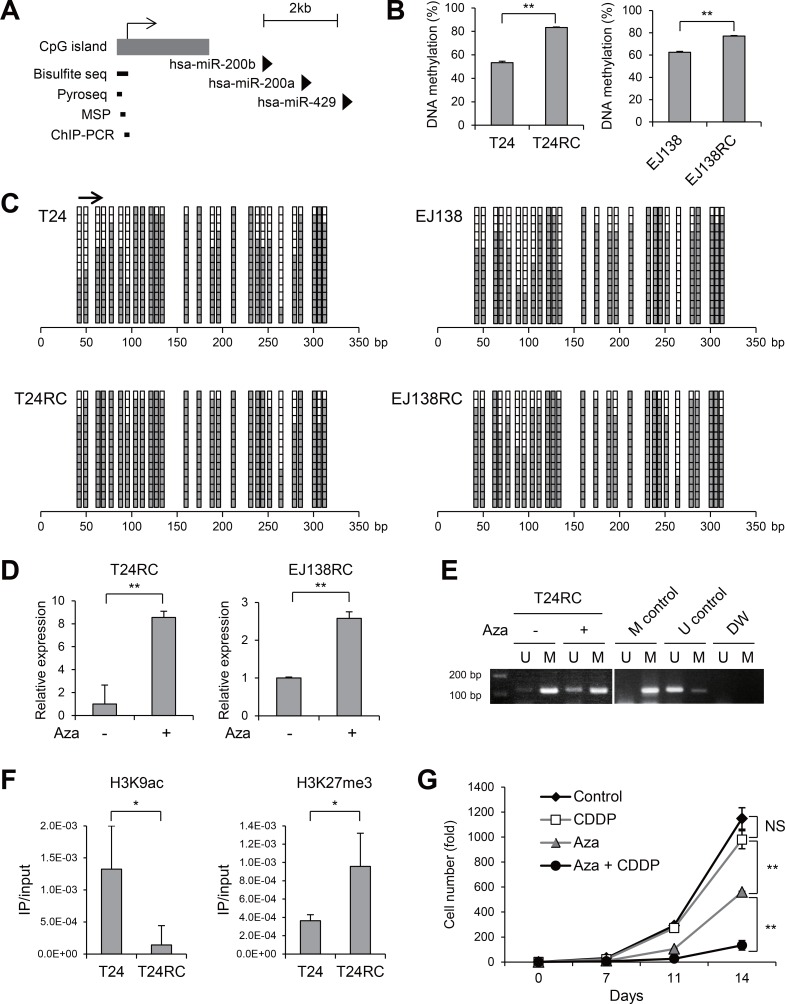
Figure 2. Epigenetic silencing of miR-200b in CDDP-resistant BCa cells.
(A) Schematic representation of the miR-200b, -200a and -429 genomic loci. Location of the CpG island and regions analyzed using the indicated methods are also shown. (B) Results of bisulfite pyrosequencing in the indicated BCa cells. (C) Results of bisulfite sequencing in the indicated cells. The region analyzed with bisulfite pyrosequencing is indicated by an arrow. (D) qRT-PCR analysis of miR-200b in CDDP-resistant BCa cells treated with or without 5-aza-dC (Aza). (E) MSP analysis in T24RC cells treated with or without 5-aza-dC. Bands in the “M” lanes are PCR products obtained with methylation-specific primers; those in the “U” lanes are products obtained with unmethylated-specific primers. In vitro methylated DNA and DNMT1/DNMT3B double knockout HCT116 cells serve as methylated and unmethylated controls. (F) ChIP-PCR analysis in the indicated cells. Levels of H3K9ac and H3K27me3 are shown. (G) Proliferation of T24RC cells treated with or without 5-aza-dC (Aza) and/or CDDP. Numbers of cells with the indicated treatments are shown relative to the numbers on day 0 (5 × 10³ cells). Shown in B, D, F and G are means of 3 replications; error bars represent SDs. NS, not significant; *P < 0.05, **P < 0.01.

