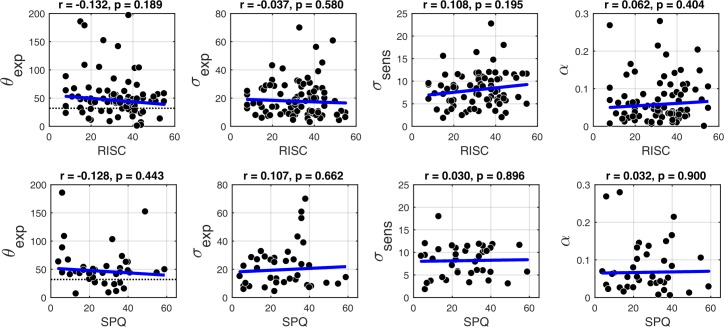
Appendix 1—figure 9. Correlations with the BAYES model parameter values and schizotypy traits (as measured by both RISC and SPQ).
First column: θexp - mean of the prior expectations, second column: σexp - uncertainty of the prior distribution, third column: σsens - uncertainty in the sensory likelihood and fourth column: α - fraction of random estimations. Robust correlation coefficients and p-values are indicated above each plot. The blue lines denote robust regression.

